
Employment trends are casting a shadow

Key points
- Strong employment is both a catalyst and harbinger of economic growth
- Weakening employment is often an early clue of a weakening economy
- Construction, trucking, and temporary employment trends may offer a better picture of employment trends than the official unemployment rate
Author notes on indicators
Over the years, I have developed a number of indicators that I track for trading and/or informational purposes. Many of them do not appear on our website. To avoid frustrating some subscribers, I sometimes avoid writing about things that subscribers cannot track directly on our site. Other times, however, I decide to go ahead and pass along what I consider helpful knowledge - with the promise that I will update the indicator or system in question when it is relevant. The indicator detailed below falls into this latter category (although, in all candor, I probably should have written about it a month ago).
Employment is an important clue regarding recessions
Generally speaking, when employment is bountiful, times are good. When people are working and making money to spend on goods and services, the economy typically hums along. However, when employment declines - and unemployment rises - it often is a byproduct of a weakening economy. The official Unemployment Rate is a reasonably helpful tool. However, how the official number is calculated has changed over the years and may not always reflect an accurate picture.
So, what follows is one approach to combining employment trends in some economy-sensitive areas into one indicator to hopefully generate some early clues regarding impending strength or weakness in the economy. In a nutshell, the indicator (which I developed and calculate independently) combines trends in employment among construction, trucking, and temporary employees.
A note regarding calculation and analysis: The raw data for each sector is generally available in the first week of each month. However, I do not analyze this data until the close of the last trading day of each month. So, if, for example, the number of construction, trucking, and temporary workers is reported on October 1st, I do not use those new numbers until the month-end calculation after the close on the last trading day of October.
- The raw indicator is calculated at the end of the month by multiplying the latest value for each of the three data series and then dividing the result by one million (example calculations will be covered later)
- This raw indicator is then compared to its own 12-month exponential moving average to determine if it is in an uptrend or a downtrend. If the raw indicator is above the 12-month EMA, it is considered to be in an uptrend, and vice versa
- Uptrends are considered favorable for stocks and the economy as a whole
- Downtrends are deemed unfavorable for stocks and the economy.
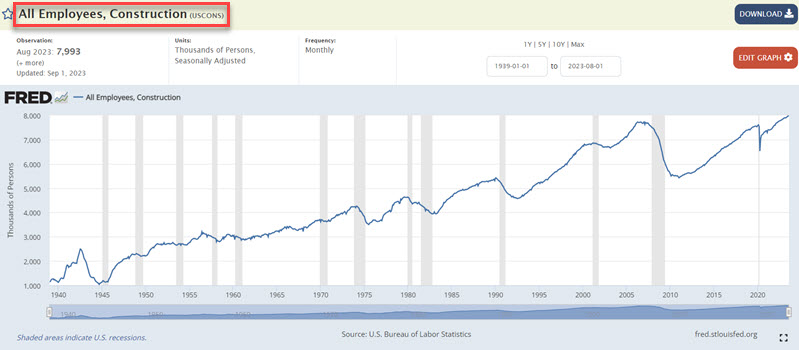
Tracking construction employment
The data for this indicator can be found here. The chart below displays the raw data for construction employment.
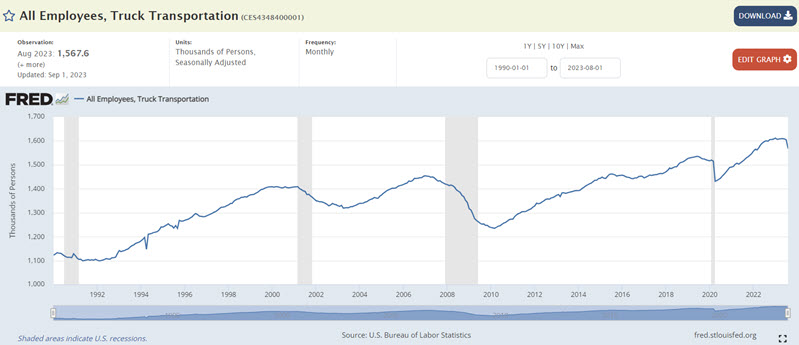
Tracking trucking employment
The data for this indicator can be found here. The chart below displays the raw data for trucking employment.
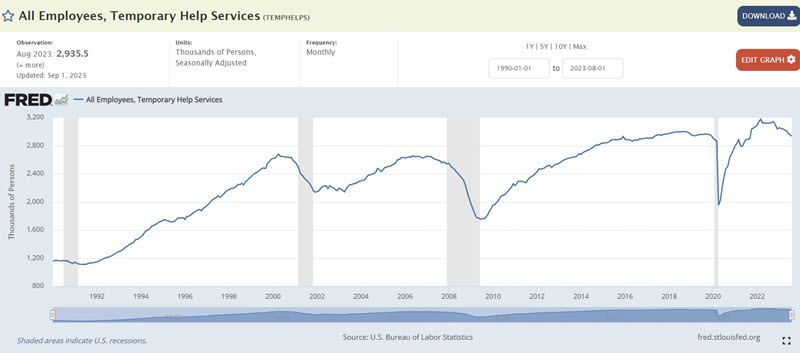
Tracking temporary employment
The data for this indicator can be found here. The chart below displays the raw data for temporary employment.
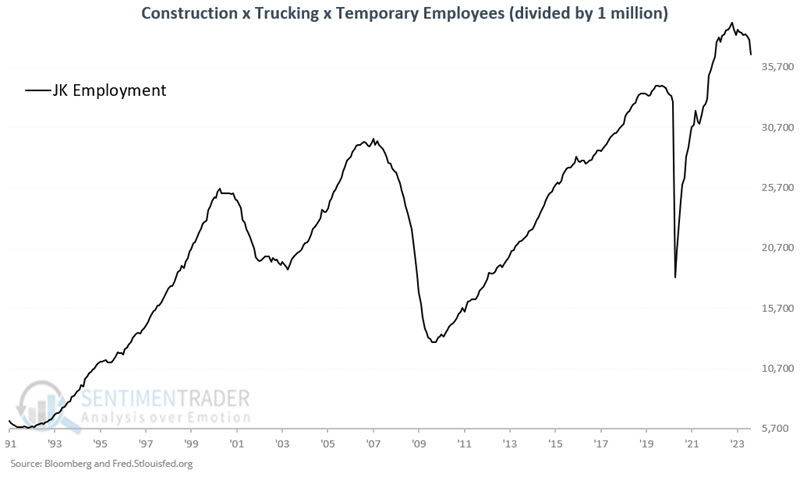
Combining the three data series
At the end of each month, the values for each of the three data series are multiplied together and then divided by one million as follows:
(All Employees, Construction x All Employees, Truck Transportation x All Employees, Temporary Help Services) / 1,000,000
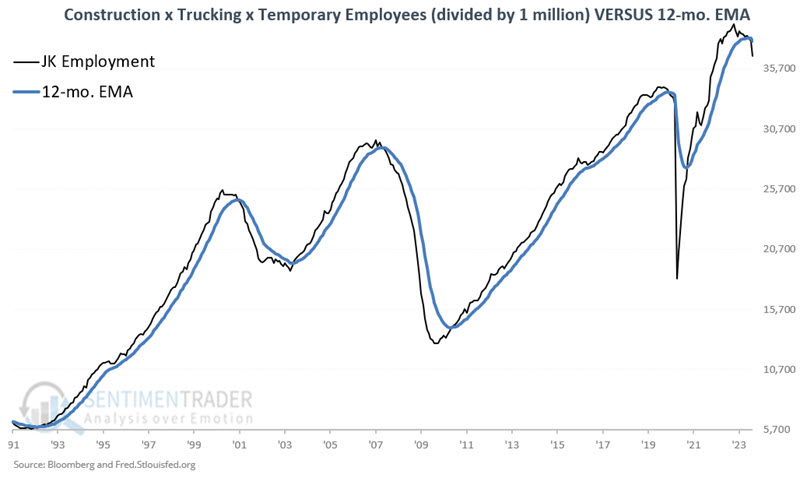
The chart below displays the raw indicator, which I refer to as JK Employment, for lack of a better name.
The following chart adds a 12-month exponential moving average based on the month-end readings for the raw indicator.
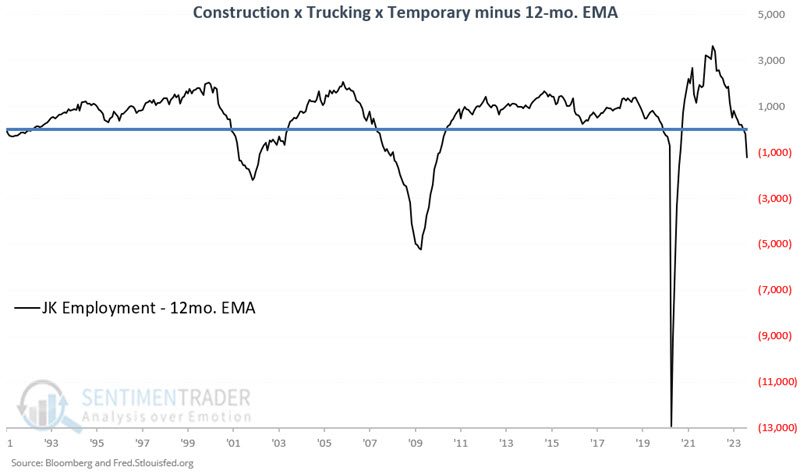
Finally, the chart below shows the results of the following calculation:
JK Employment - 12-month exponential moving average
Values above 0 are considered favorable for stocks and the economy and vice versa. The latest signal was a cross back below 0 on 2023-08-31.
Stock market performance based on JK Employment readings
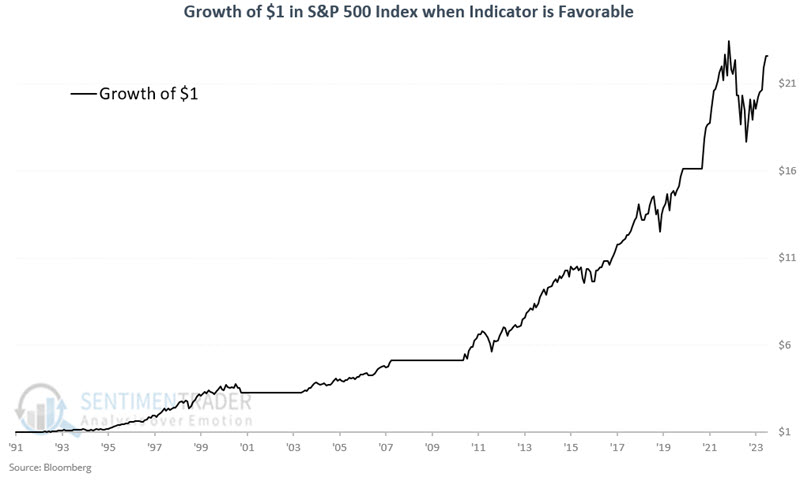
Our test period extends from 1991-03-31 through 2023-09-30. If the latest calculation shows JK Employment to be above its 12-month EMA at the end of the month, then we hold the S&P 500 during the following month.
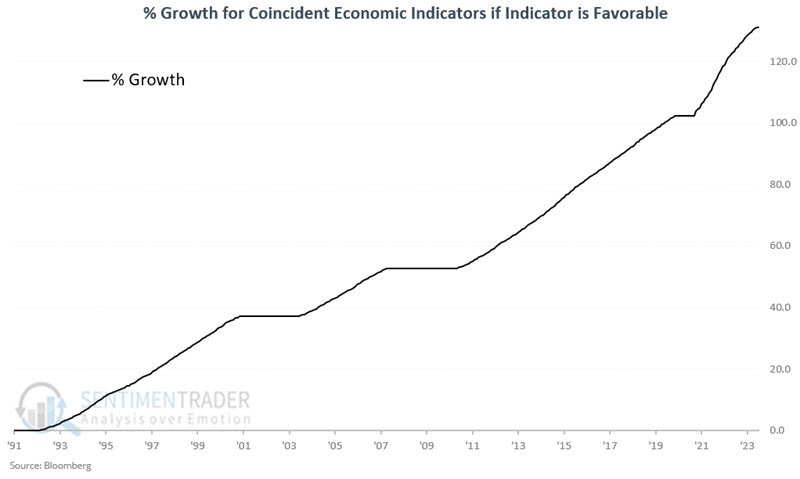
The chart below displays the growth of $1 invested in the S&P 500 Index only when JK Employment is above its 12-month EMA. The cumulative gain was +2,159.7%. Note that this employment indicator remained favorable throughout the 2022 bear market. This suggests that the 2022 decline was primarily a reaction to inflation and not a sign of an impending recession.
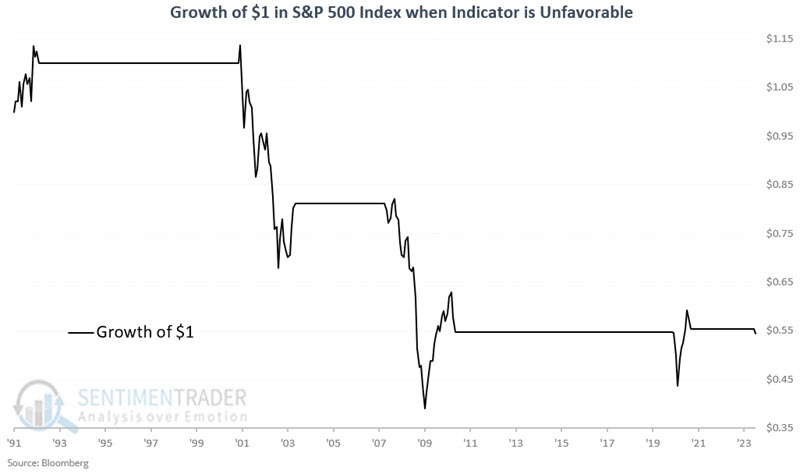
Conversely, the chart below displays the growth of $1 invested in the S&P 500 Index only when JK Employment is below its 12-month EMA. The cumulative loss is -45.7%.
The table below compares the S&P 500 monthly performance when the indicator is Favorable to the monthly performance when the Indicator is Unfavorable.
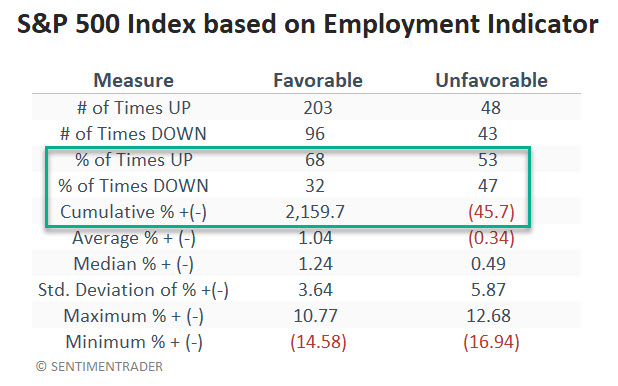
This model is not intended to be a standalone "100% in or 100%" out trading model. It is best used in a broader "weight of the evidence" approach.
Economic performance based on JK Employment readings
Now, let's look at economic performance based on this model. Our test period extends from 1991-03-31 through 2023-09-30. For measuring economic performance, we will track the cumulative increase or decrease for the Coincident Economic Indicators on a monthly basis, depending on whether JK Employment is above or below its 12-month EMA.
The chart below displays the cumulative % movement for the Coincident Economic Indicators only when JK Employment exceeds its 12-month EMA. The cumulative gain was +131%. Notably, when the indicator was favorable, no months saw the Coincident indicators decline on a monthly basis.
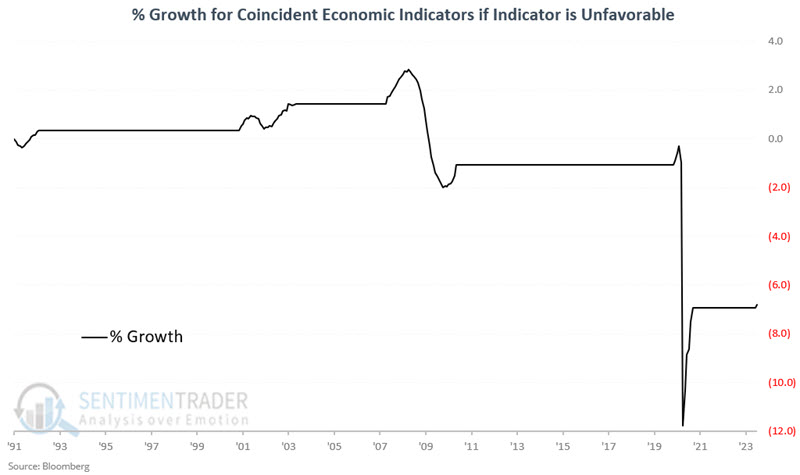
Conversely, the chart below displays the cumulative % movement for the Coincident Economic Indicators when JK Employment is below its 12-month EMA. The cumulative loss is -6.8%.
The table below compares Coincident Economic Indicator performance when the Indicator is Favorable versus the monthly performance when the Indicator is Unfavorable.
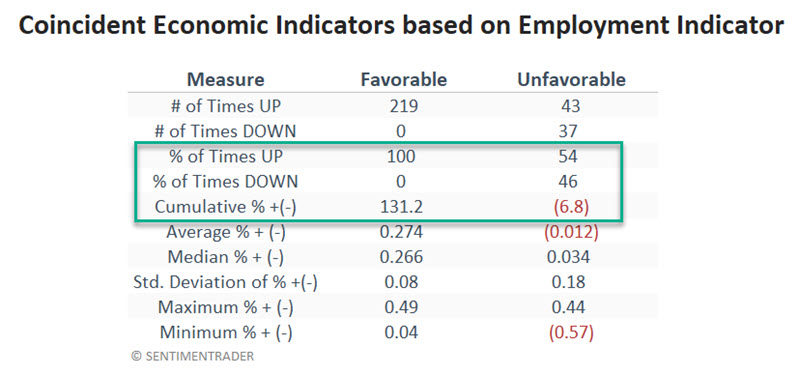
The most important thing to note is this: Since 1991, there have been 37 months that have witnessed a decline in the Coincident Economic Indicator index (i.e., economic contraction), and all 37 of those declining months occurred when the JK Employment indicator was below its 12-month EMA.
That said, there were 43 other months when the Coincident Economic Indicators increased despite a negative indicator reading. So, a negative reading does not guarantee a recession - it simply speaks to a higher probability of economic weakness. Likewise, the fact that none of the 219 months when the JK Employment indicator was above its 12-month EMA was followed by a declining month for the Coincident indicators does not guarantee that it will never happen.
What the research tells us…
A strong economy and strong employment trends typically go hand in hand. Also, specific economic sectors - notably construction, trucking, and temporary employees - are keenly sensitive to economic changes and can often offer early clues regarding strengthening or weakening. The fact that the JK Employment indicator has been below its 12-month EMA since the end of August 2023 does not guarantee a weak economy or stock market going forward. But it does appear to add weight to the unfavorable side of the stock market and economic ledger.