
Emerging Signs of Life in the Healthcare Sector

Key Takeaways
- Health Care (XLV) has suffered severe breadth compression, but extreme oversold readings are currently triggering high-probability historical buy signals.
- The 20-day moving average of XLV constituents trading above their upper Bollinger Band has collapsed below 1%, an extreme momentum washout that has historically yielded a 100% win rate over the forward 12-month period.
- Intermediate-term breadth (the percentage of members above their 50-day moving average) plunged violently from 85% to 10%, a capitulation setup that typically precedes sustained sector outperformance.
Few healthcare stocks in a strong uptrend
At our desk, we frequently field two distinct questions regarding the Health Care sector right now. The first: "Will this battered sector eventually recover?" As the data will show, there is ample evidence to answer with a definitive "yes." The second, more pressing question: "Is now the right time to buy?" That is inherently more difficult to time perfectly.
Buying into steep drawdowns offers the widest margin for outsized returns if a structural bottom is forming. On the flip side, stepping in too early is the classic definition of "catching a falling knife." However, recent research published by Jay highlighted some positive signs emerging in the healthcare sector. Now, we are seeing quantitative breadth signals align to support a bullish thesis for Health Care.
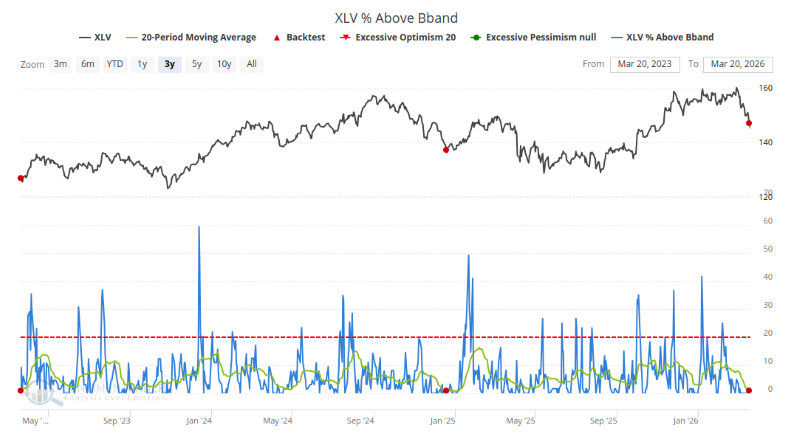
To measure internal participation, we track the percentage of stocks within an ETF trading above their upper Bollinger Band. This breadth metric acts as a gauge for upside momentum and participation. Typically, at major turning points, internal market breadth diverges from the underlying index. Extreme readings in these indicators are highly actionable; when an index exhibits total capitulation-where virtually no constituents are showing upside momentum-we systematically look for mean-reversion trades in the days, weeks, and months that follow.
Signals like these have resulted in a perfect win rate
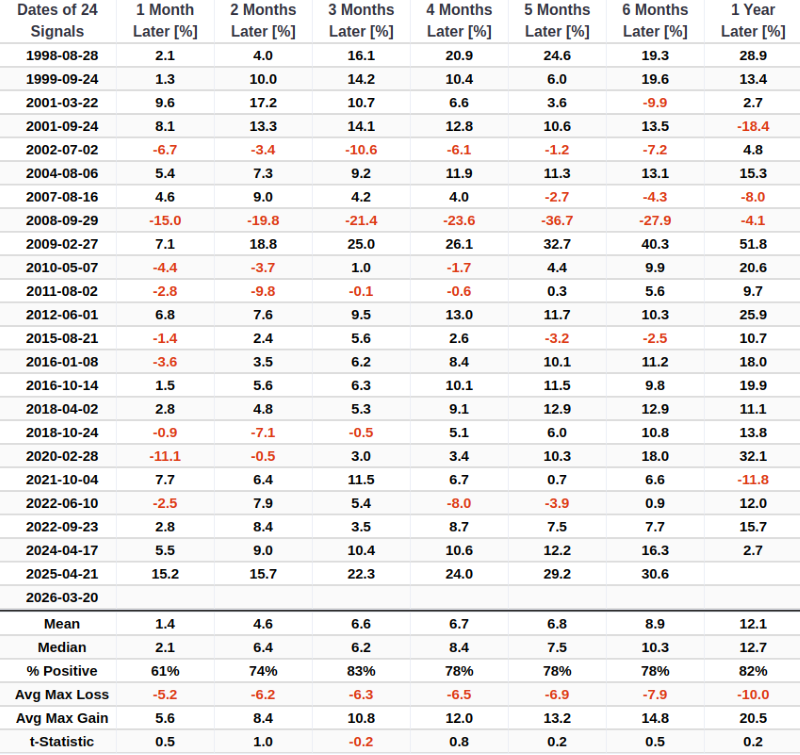
The chart below highlights instances where the 20-day moving average of the percentage of XLV constituents trading above their upper Bollinger Band dropped below 1. The most recent signal fired on Mar 20, 2026.
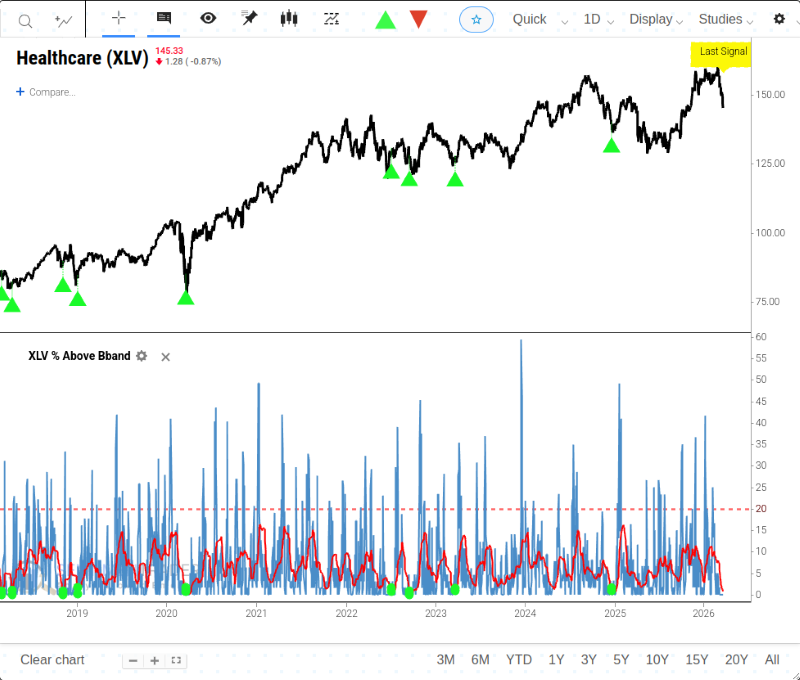
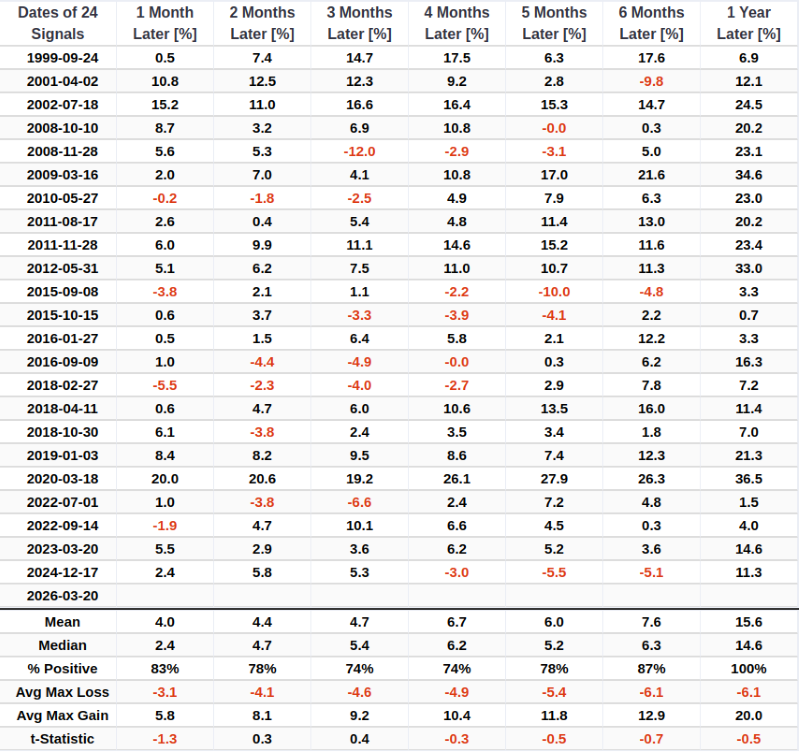
The table below details the signal-by-signal forward returns. When this Bollinger Band participation metric drops below 1, XLV has posted a flawless 100% win rate over the subsequent one-year timeframe.
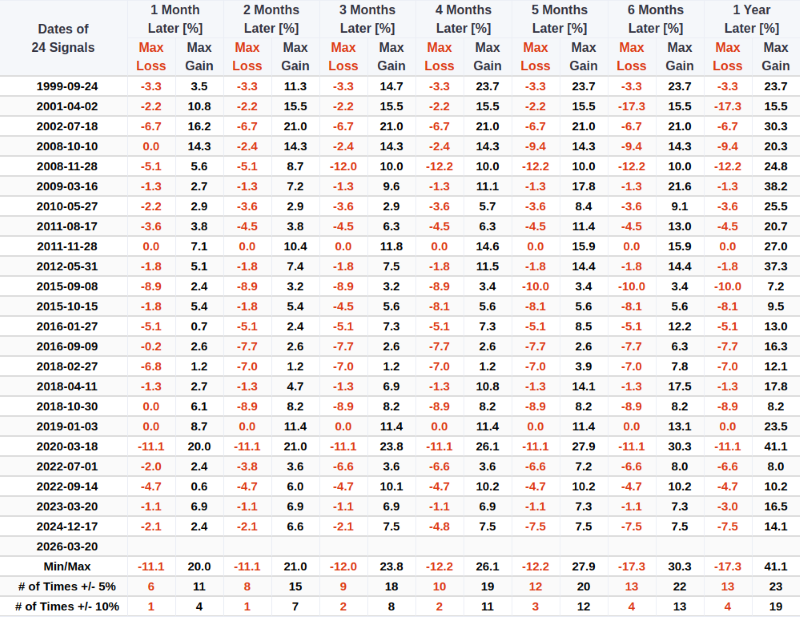
Looking at the distribution of maximum gains versus maximum losses over that one-year forward window, the sector experienced a max gain exceeding 10% on 19 occasions, compared to a max drawdown exceeding -10% on only 4 occasions. This sharply skewed ratio confirms that the statistical edge is firmly with the bulls at these levels.
It is also worth noting that this capitulation in Health Care tends to act as a constructive macro tell; the S&P 500-the world's premier equity benchmark-also exhibits highly positive win rates and absolute performance in the 12 months following this signal. For related backtest, click here.
50-Day Moving Average
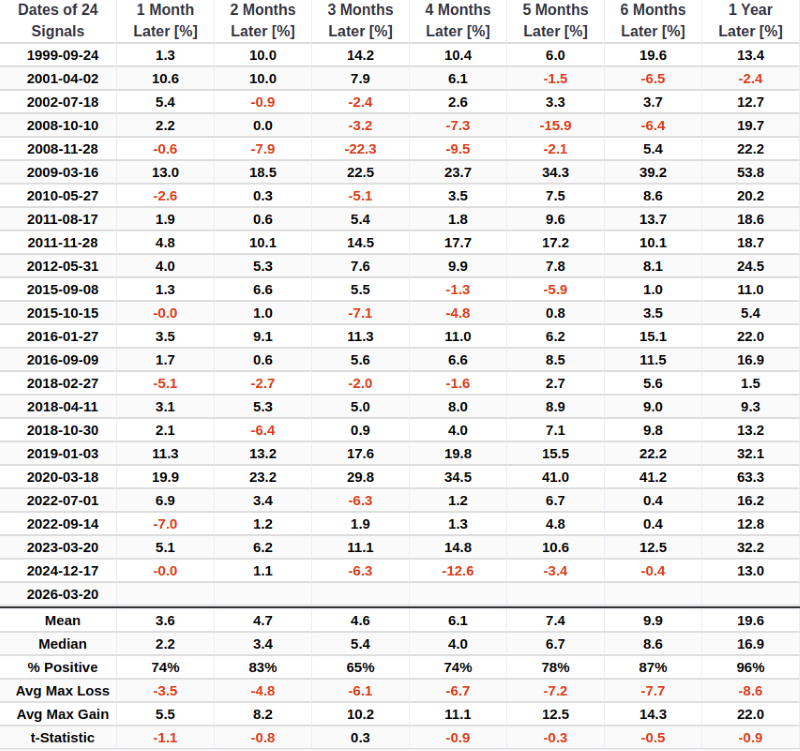
Our intermediate-term breadth indicator-XLV Breadth (% > 50 Day Avg)-experienced a violent compression, plunging from a robust 85% at the start of the year down to a depressed 10% last Friday. To historically contextualize this exact market environment, we ran a screen for instances where this metric crossed below the 10.1% threshold after recently peaking above 80%.
The chart below displays historical occurrences of this breadth collapse.
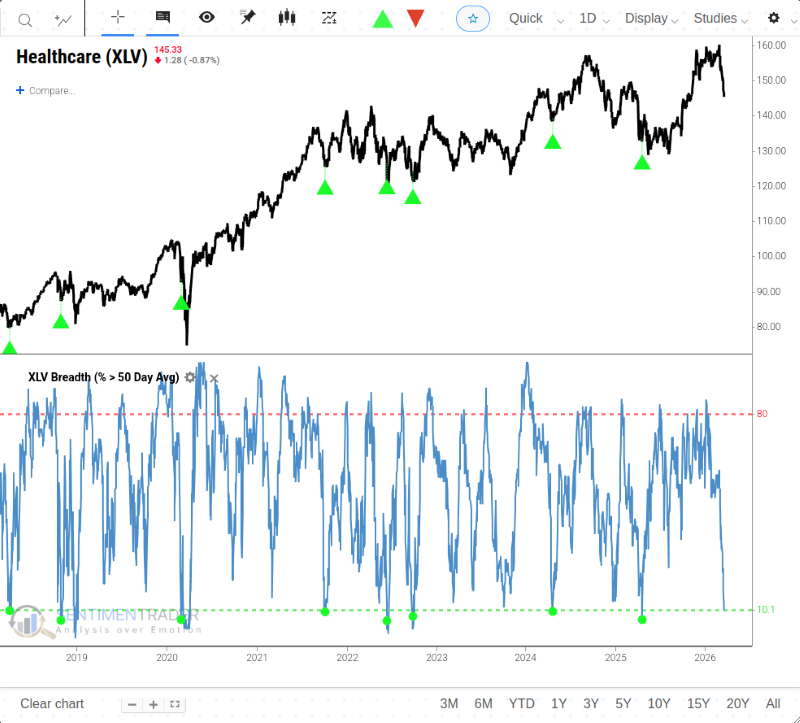
The table below shows the individual results and performance of all signals. This signal indicates that XLV is likely to trend upward in the medium to long term.
Seasonality
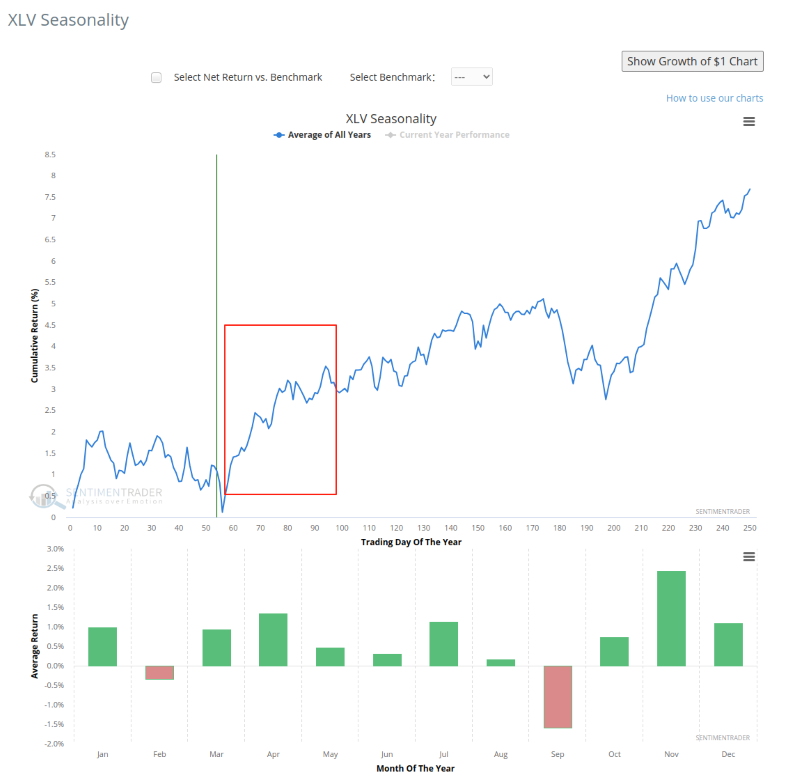
The chart below details the annualized seasonal trend for the Health Care sector (XLV), indicating that we are entering a historically strong period for the asset class.
What the research tells us…
The good news is that various typically reliable indicators suggest prices in the healthcare industry will rise over the coming year. The bad news is that the industry is clearly not currently on an upward trend. The sector has endured a severe internal washout, evidenced by intermediate breadth (% > 50-day MA) collapsing to 10% and upside momentum (Bollinger Band participation) effectively flatlining near zero. These deep oversold readings provide an potential entry point for investors looking to allocate capital to the Health Care sector over the next 6 to 12 months.