
Emerging markets and the U.S. Dollar - an update

Key points
- Emerging markets have shown enough signs of life recently to be taken seriously as potentially poised for a meaningful rally
- The US dollar has offered a confirming signal
- Seasonality remains a tailwind during the first half of 2023.
Things are happening in the emerging markets space
If you have not done so, please read this article yesterday from Jason that highlighted several favorable developments for emerging markets. The information below is a follow-up to my article on the topic from early December 2022. You might also review the potential change in the relationship between US domestic and international stocks discussed here.
In the original article, I highlighted the performance of emerging markets based on simple trend-following for both emerging markets and the US dollar. To summarize:
It is favorable for emerging markets when:
- The MSCI Emerging Markets Index's 5-week moving average is ABOVE its 30-week moving average
- The US dollar's 5-week moving average is BELOW its 30-week moving average
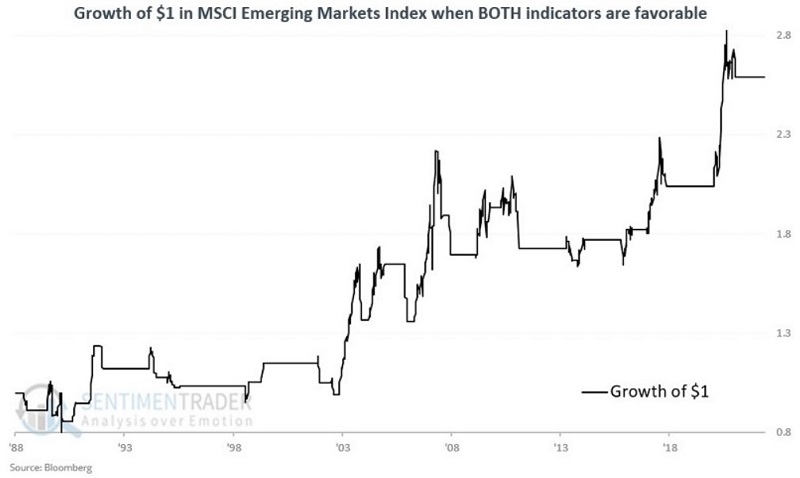
The cumulative growth from holding the MSCI Emerging Markets Index since 1988 when EITHER indicator is bullish was +828% versus +622% using a buy-and-hold approach.
The chart below displays the growth of $1 in the MSCI Emerging Markets Index when BOTH Indicators are bullish.
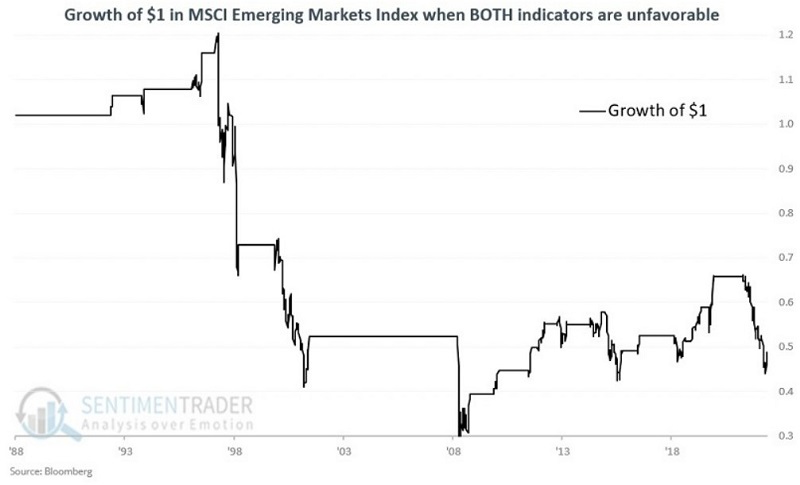
Conversely, it is unfavorable for emerging markets when:
- The MSCI Emerging Markets Index's 5-week moving average is BELOW its 30-week moving average
- The US dollar's 5-week moving average is ABOVE its 30-week moving average
The chart below displays the growth of $1 in the MSCI Emerging Markets Index when both of the above are true. The cumulative decline since 1988 was -53% when both indicators were unfavorable.
A potential turn for the positive
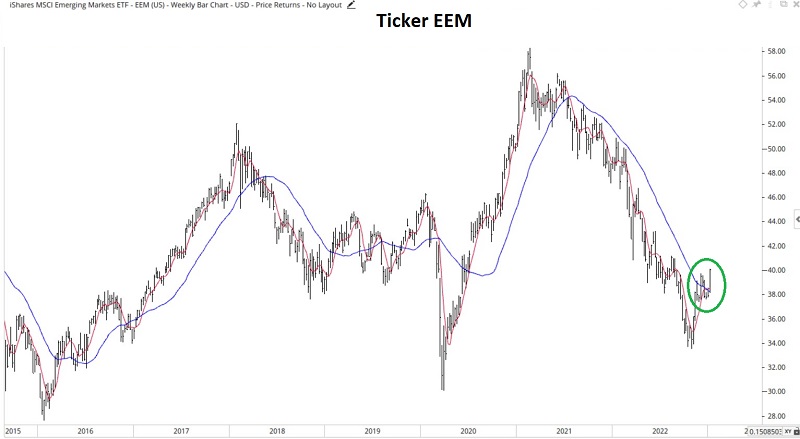
As of the week ending 2023-01-06, both indicators above are favorable. The chart below shows that the 5-week MA for emerging markets has once again crossed back above the 30-week MA.
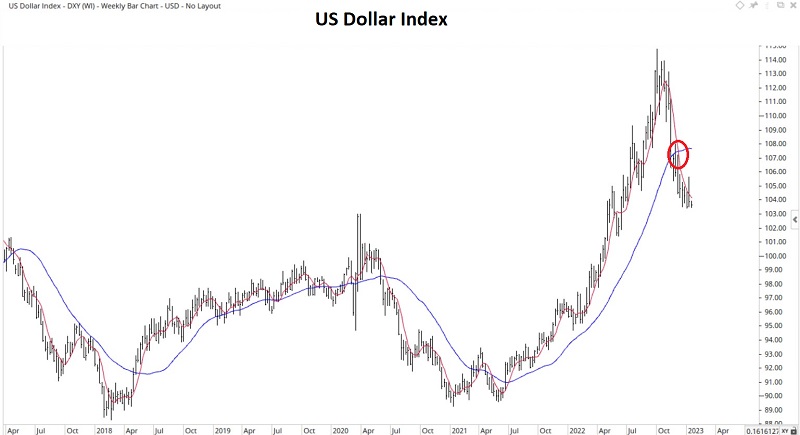
The chart below shows that the US dollar index's 5-week MA dropped below the 30-week MA back on 2022-12-09.
This new favorable configuration does not guarantee that emerging markets will launch into a massive rally. But it does add substantially favorable weight to the bullish side of the ledger - particularly in light of the additional signals highlighted yesterday by Jason.
A potential tailwind from seasonality
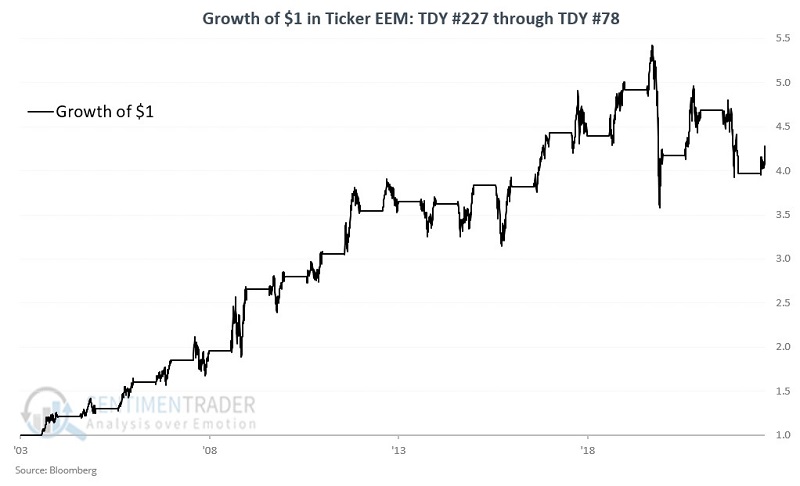
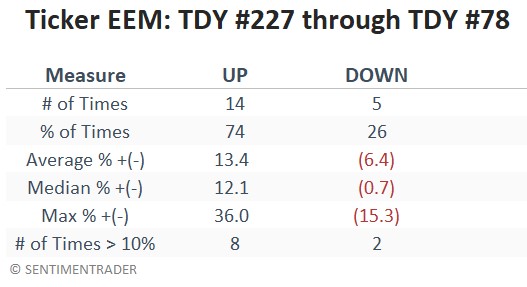
The chart below displays the annual seasonal trend for iShares Emerging Markets ETF (EEM), which tracks the MSCI Emerging Markets Index. Note the highlighted period that extends from Trading Day of Year (TDY) #227 through TDY #78 the following year.
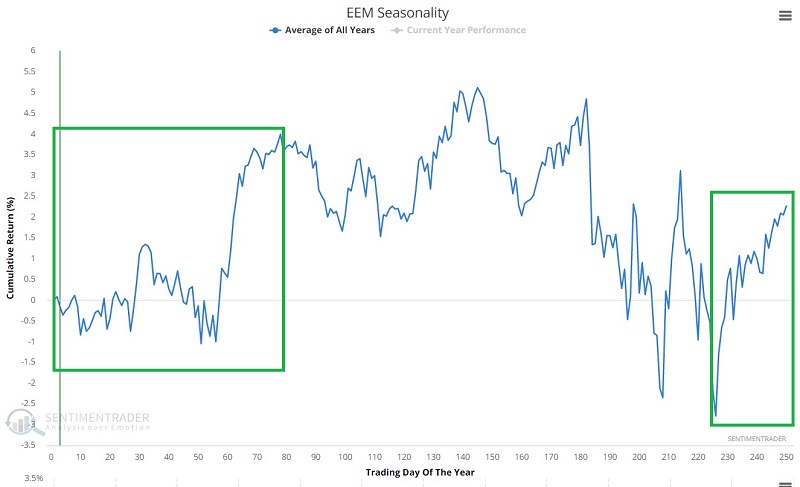
For this cycle, that period extends from the close on 2022-11-25 through the closing on 2023-4-25. So far, EEM has been up 7.7% since 2022-11-25. The chart and table below display the performance of EEM during this favorable seasonal period starting in 2003.
What the research tells us…
In the original article, I raised whether the 5-week and 30-week methods detailed above qualify as a standalone trading model. At this point, it doesn't have to. When the latest favorable developments are added to the signals highlighted by Jason and the potentially favorable seasonality, there is now enough "weight of the evidence" for an investor to make a bullish case for emerging markets. The one caveat remains that "favorable weight of the evidence" is not the same as "a sure thing." Investors considering a commitment to emerging markets must still carefully consider how much capital to allocate (position sizing) and how much of that capital to risk (risk management).