
Emerging markets and the US dollar

Key points:
- Emerging markets have been dead money for the last 15 years
- The trend of the US Dollar can help assess the prospects for emerging markets
- When moving averages on the dollar were unfavorable, it preceded good gains for emerging markets
A simple price trend filter for emerging markets
For U.S.-based investors, returns in emerging markets are often dictated by trends in the dollar. That bodes well for them at the moment.
For testing purposes, we will use index data for the MSCI Emerging Markets Index starting in 1988. For trading purposes, a trader can use the iShares MSCI Emerging Markets ETF ( EEM), shown below.
The key things that jump off this chart are 1) large intermittent swings in price and 2) no net gain over the past 15 years. I've also applied a simple trend-following moving average filter. The chart below displays a weekly chart for ticker EEM with a 5-week and 30-week moving average. These values are not optimized but are simply my default starting point.
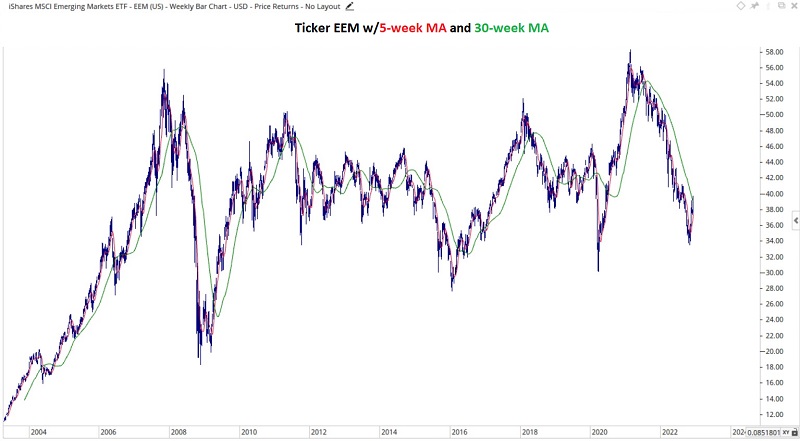
Like most trend-following methods, there are periods when this simple approach rides the right side of the trend for an extended period, and other times that experience whipsaws back and forth.
Testing this rudimentary approach using the MSCI Emerging Markets Index starting in 1988, the chart below displays the growth of $1 invested in the Index only when the 5-week MA is above the 30-week MA.
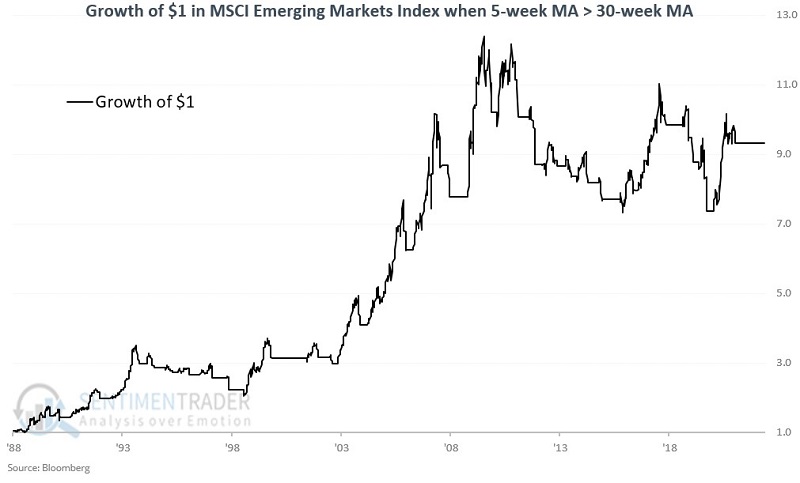
These results are decent and represent a gain of 27% more than a buy-and-hold approach. But again, these results are not optimized and serve primarily as a baseline to see if factoring in the performance of the US Dollar might add value.
The chart below displays the growth of $1 invested in the Index only when the 5-week MA is below the 30-week MA.
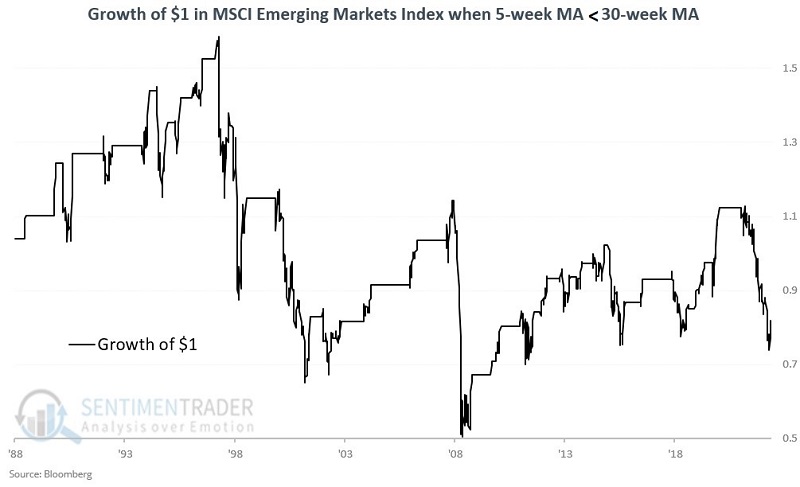
Holding the Index when the 5-week MA is above the 30-week MA registered a gain of +828%. Holding the Index when the 5-week MA is below the 30-week MA registered a loss of -22%.
Emerging markets versus the US Dollar
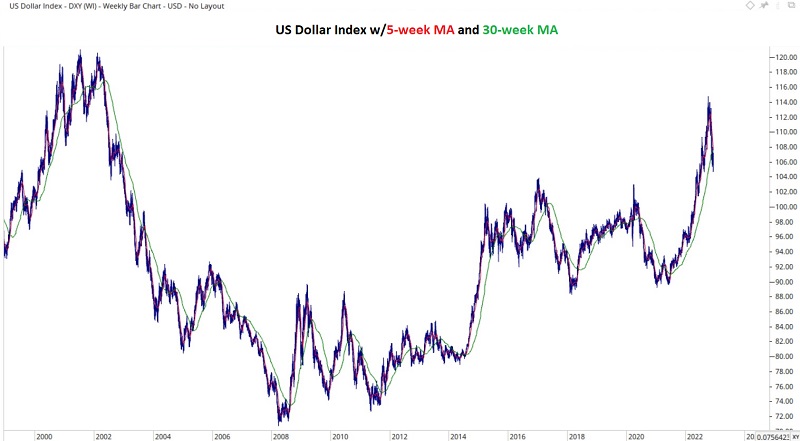
Now, let's use the same approach and apply a 5-week and 30-week moving average to the US Dollar index. However, we use the opposite interpretation because the emerging markets and US Dollar Index are inversely correlated.
Therefore, It is considered favorable for emerging markets if the US Dollar's 5-week MA is below its 30-week MA, and vice versa.
The chart below shows the level of the US Dollar Index since the late 1990s. Also shown are the 5-week and 30-week moving averages. The dollar is considered to be falling if the 5-week is below the 30-week and vice versa. That, in turn, is deemed favorable for emerging markets.
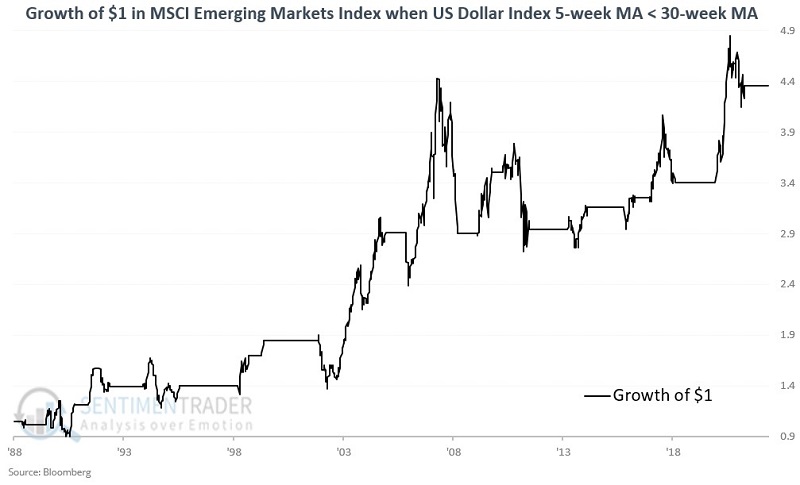
The chart below demonstrates the growth of $1 invested in the Emerging Markets Index only when the US Dollar is falling.
And below, when the dollar is rising.
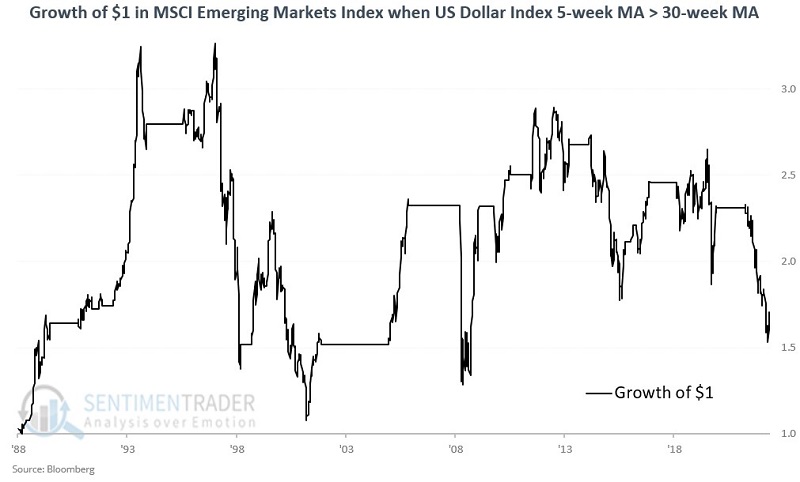
Since 1988, holding the MSCI Emerging Markets Index when the US Dollar 5-week MA is below the 30-week MA registered a gain of +331%. Holding it when the dollar was rising registered a gain of +67%. However, note that since the peak profit in July 1997, the loss has been a painful -48%.
Combining Emerging Markets and US Dollar trends
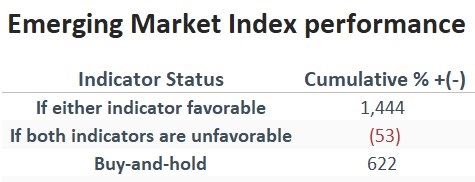
First, our baseline results since 1988:
- Buy-and-hold = +622%
- Long only when MSCI Emerging Markets Index 5-week > 30-week = +828%
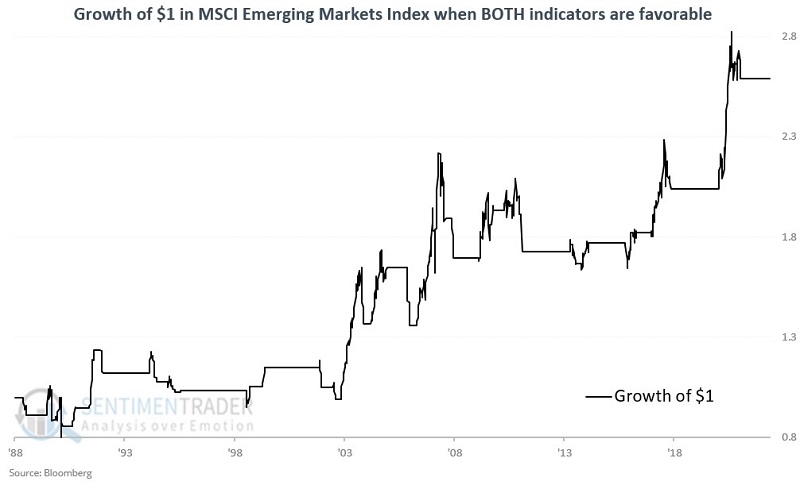
The chart below displays the growth of $1 invested in the Emerging Markets Index only when it is in an uptrend, and the dollar is in a downtrend.
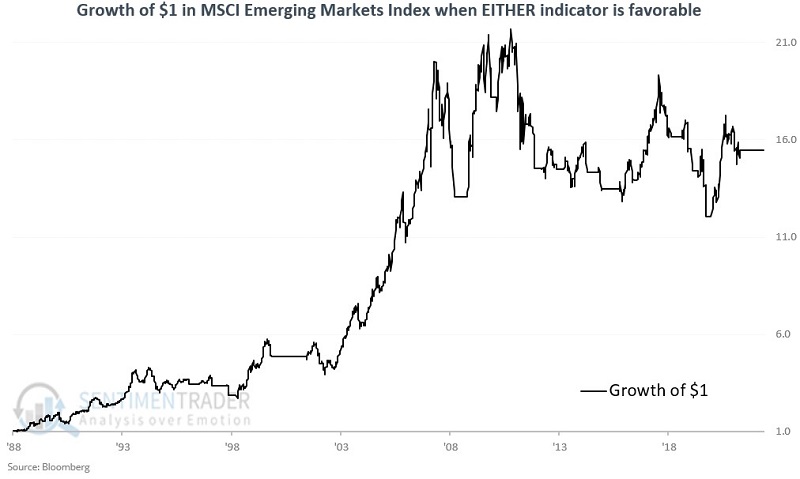
Below, we can see the growth of $1 invested in the index only when either the Emerging Markets Index is in an uptrend OR the US Dollar Index is in a downtrend. In other words, as long as either index is in a favorable trend, we will hold Emerging Markets.
Finally, the chart below shows the growth of $1 invested in emerging markets only when the index is in a downtrend AND the US Dollar Index is in an uptrend - the worst of both worlds.
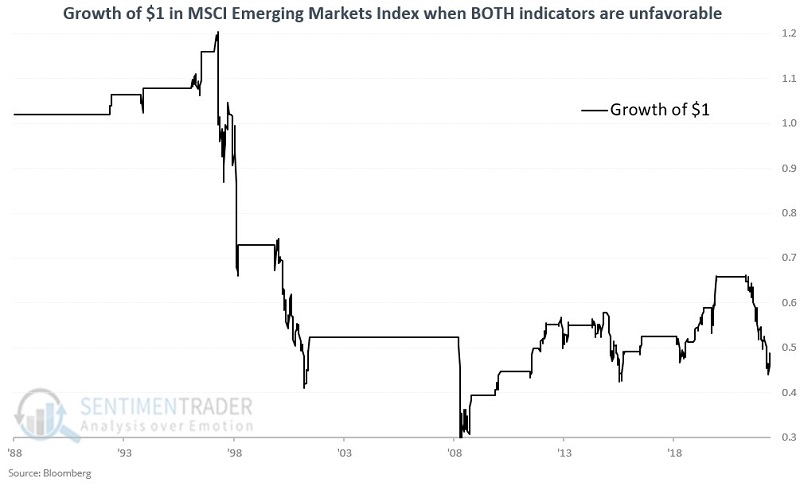
Investors who attempted to play the Emerging Markets sector in the past 44 years could have avoided a lot of grief and aggravation by simply monitoring price trends for the MSCI Emerging Markets Index and the US Dollar.
If either trend filter was favorable, emerging markets returned +1,444%, but if both were unfavorable, that turned into a loss of 53%.
What the research tells us…
There are two key implications to consider. First, emerging markets have now traded sideways over the last 15 years. The historical nature of stock markets suggests that this is not a permanent state of affairs and that, at some point, a significant advance will ultimately take place. Secondly, if and when the time comes that you are considering investing in emerging markets, you may be wise to take a close look at the price trend of the sector itself and the direction of the US Dollar.