Products
SentimenTrader Trading Tools
‍
Backtest Engine
My Trading Toolkit
Correlation Analysis
Seasonality
Indicators & Data API
‍
Proprietary Indicators & Charts
Market Data API
Strategies & Scanner
‍
50+ Trading Strategies
Smart Stock Scanner
Research Reports
‍
Research Solutions
Reports Library
Free Resources
Simple Backtest Calculator
Simple Seasonality Calculator
The Kelly Criterion Calculator
Sentiment Geo Map
Public Research Reports
Pricing
Company
About
In the News
Testimonials
Client Success Stories
Contact
Log inLoginSign up
< BACK TO ALL REPORTS

Emerging Market Central Bank Policy Rates

Dean Christians
2021-10-06
Emerging market central banks have begun the process of normalizing interest rates after one of the most profound easing cycles in history. What's driving the policy change, and should we be concerned.

Central banks around the globe have begun the process of normalizing interest rates after one of the most profound easing cycles in history. Emerging markets are leading the charge as inflationary pressures are driving the shift in monetary policy. Remember, inflation acts as a tax on the poor and impacts corporate margins for specific industries that have no pricing power.

Let's review the outlook for emerging markets when inflation rises and central banks tighten monetary policy.

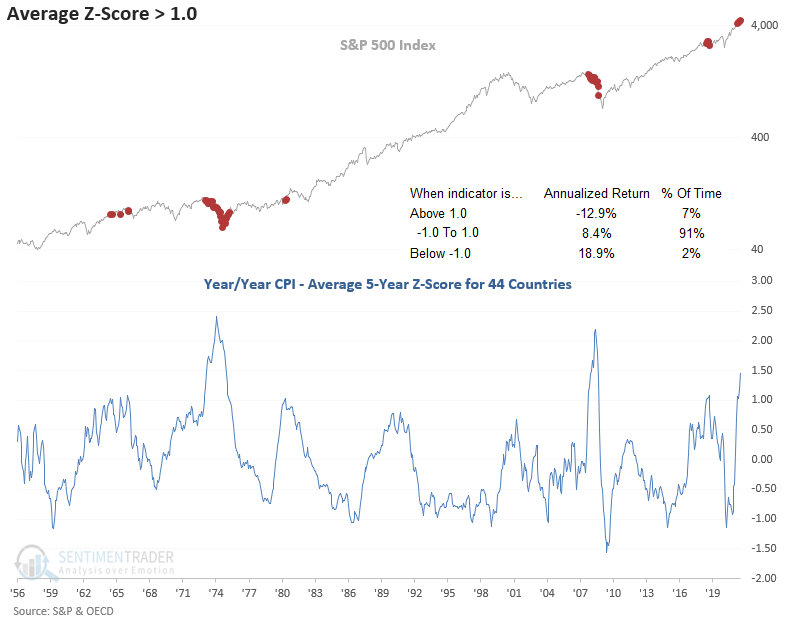
HISTORICAL INFLATION CHART

The following indicator applies a rolling 5-year z-score to the Y/Y change in CPI for 44 countries and measures the average for all countries. When the average z-score surpasses 1.0, stocks suffer. 

Inflation is a global phenomenon. 

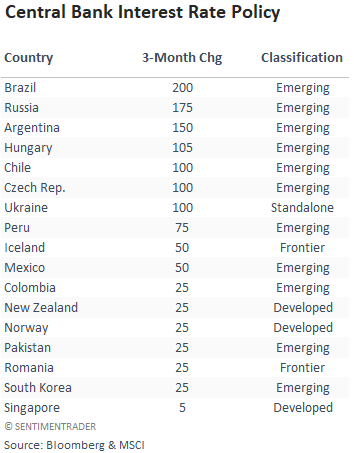
The following table contains countries with a positive 3-month change in central bank policy rates. I selected the countries from a Bloomberg policy rate table that includes 53 countries.

Emerging market economies are dominating the list of countries with a tighter interest rate policy.

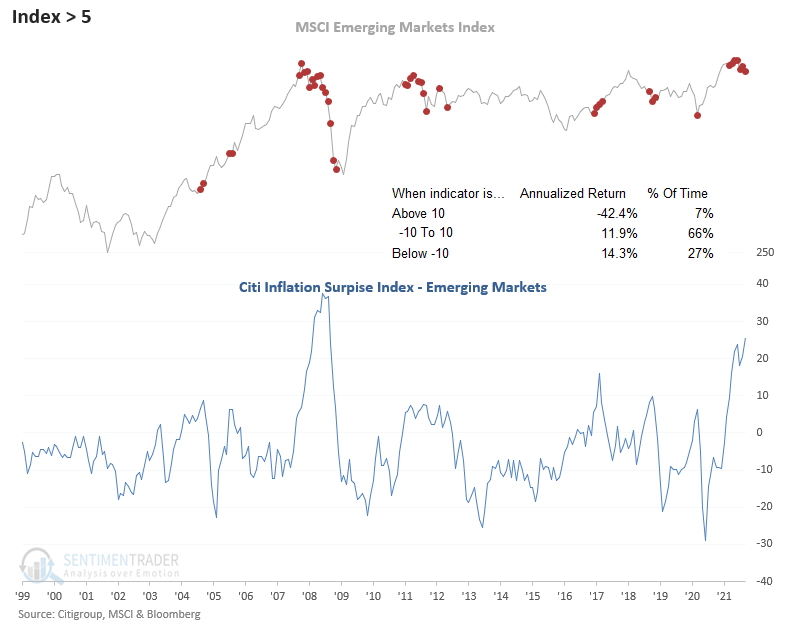
EMERGING MARKET INFLATION

The Citi Inflation Surprise Index for emerging markets has now risen to the highest level since 2008. The index measures price surprises relative to market expectations. As the table shows, a level above 10 is unfavorable for the MSCI Emerging market Index.

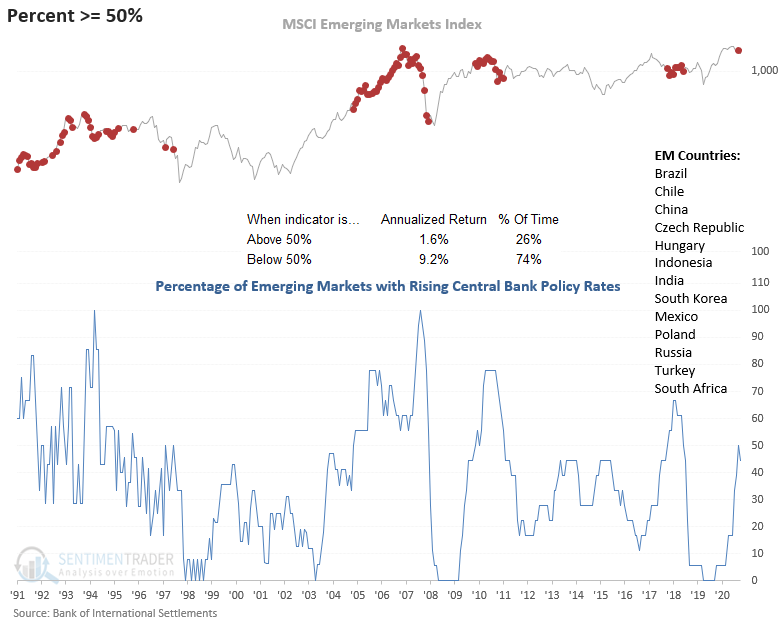
The following chart contains an indicator that measures the percentage of emerging market countries with increasing policy rates. The calculation uses 13 essential economies, including the BRICs. The indicator touched 50% in August before dropping in September due to a rate cut in Turkey. Annualized returns diminish when the percentage increases above 50% and turn markedly negative when above 60%.

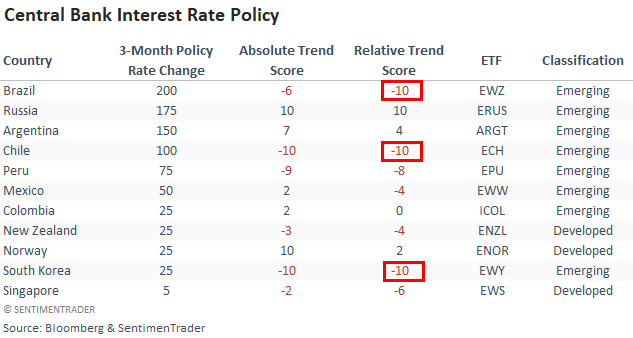
Let's look at central bank policy for countries with a USD-based ETF and include the absolute and relative trend score indicators from my Monday morning ETF Update. As the table shows, several ETFs maintain weak comparable profiles versus the S&P 500, especially Brazil, Chile, and South Korea. Russia is bucking the trend as the country is heavily tied to energy resources.

 Scores range from 10 highest to -10 lowest.

Never fight the fed is one of the golden rules of investing. When central banks act, take note. As the data shows, a broad-based allocation to emerging market stocks looks unfavorable until EM central banks decide to change course.

Sorry, you don't have access to this report

Upgrade your subscription plan to get access
Go to Dasboard
PRODUCTS
SentimenTrader
Trading Tools
Indicators & Data API
‍
Strategies & Scanner
‍
Research Reports
FREE
RESOUrCES
Simple Backtest
Calculator
Simple Seasonality
Calculator
The Kelly Criterion
Calculator
Sentiment Geo Map
‍
Public Research Reports
‍
Pricing
Bundle pricing
‍
Announcements
‍
FAQ
COMPANY
‍
About
‍
In the News
‍
Testimonials
‍
Client Success Stories
CONTACT
‍
General Inquiries
‍
Media Inquiries
‍
Financial Professionals Inquiries
‍
© 2025 Sundial Capital Research Inc. All rights reserved.
Setsail Marketing
TermsPrivacyAffiliate Program
Risk Disclosure: Futures and forex trading contains substantial risk and is not for every investor. An investor could potentially lose all or more than the initial investment. Risk capital is money that can be lost without jeopardizing ones’ financial security or life style. Only risk capital should be used for trading and only those with sufficient risk capital should consider trading. Past performance is not necessarily indicative of future results.

Hypothetical Performance Disclosure: Hypothetical performance results have many inherent limitations, some of which are described below. No representation is being made that any account will or is likely to achieve profits or losses similar to those shown; in fact, there are frequently sharp differences between hypothetical performance results and the actual results subsequently achieved by any particular trading program. One of the limitations of hypothetical performance results is that they are generally prepared with the benefit of hindsight. In addition, hypothetical trading does not involve financial risk, and no hypothetical trading record can completely account for the impact of financial risk of actual trading. for example, the ability to withstand losses or to adhere to a particular trading program in spite of trading losses are material points which can also adversely affect actual trading results. There are numerous other factors related to the markets in general or to the implementation of any specific trading program which cannot be fully accounted for in the preparation of hypothetical performance results and all which can adversely affect trading results.

Testimonial Disclosure: Testimonials appearing on this website may not be representative of other clients or customers and is not a guarantee of future performance or success.