
Election Cycle This, Election Cycle That (Part II)

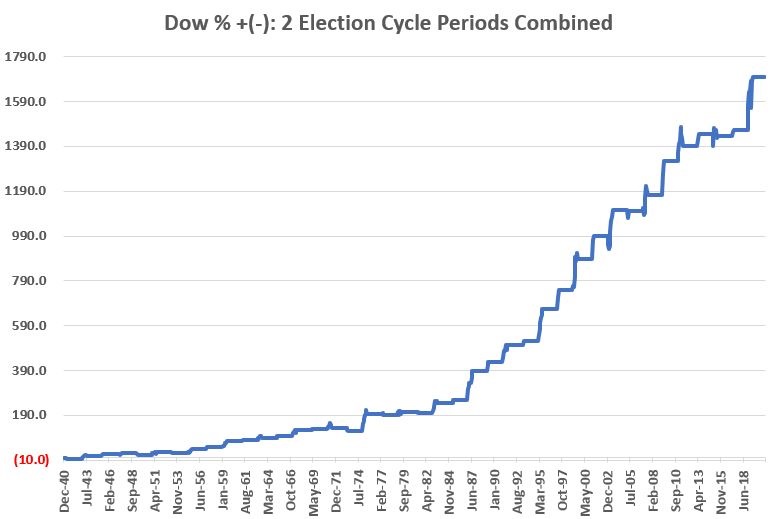
In Part I we analyzed the performance generated by holding the Dow Jones Industrial Average ONLY during two distinct periods within the 4-year election cycle:
- April-May of the Post-Election year
- January through July of the Pre-Election year
There is good news and better news. The good news - as you can see in the chart below from Part I - is that when combined these two periods showed a net gain during every 4-year election cycle starting in 1941.
The better news is that there may be a way to improve upon these results.
Using Other Indexes
Instead of using the Dow Jones Industrial Average, let's consider the S&P 400 MidCap Index and the Nasdaq 100 Index.
Data Notes:
In Part I we used price performance only data for the Dow.
In Part II we will use monthly total return data as follows:
- The first month of data for the S&P 400 MidCap Index is January 1981. So, we will start our test there.
- The first month of monthly total return data I have for the Nasdaq 100 Index is April of 1996. So:
- From January 1981 through March 1996, we will use Nasdaq Composite Index data
- From April 1996 through December 2020, we will use Nasdaq 100 Index data
(Are we having fun yet?)
Election Cycle: Period 1
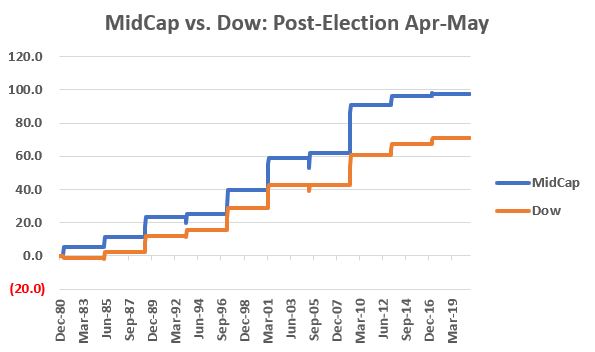
For Period 1 we will look at the performance of the S&P 400 MidCap Index versus the performance of the Dow ONLY during April and May of the Post-Election year starting in 1981.
The chart below displays the cumulative price gain for the MidCap Index and the Dow during this 2-month period every four years.
The Table below displays the actual cycle-by-cycle results.
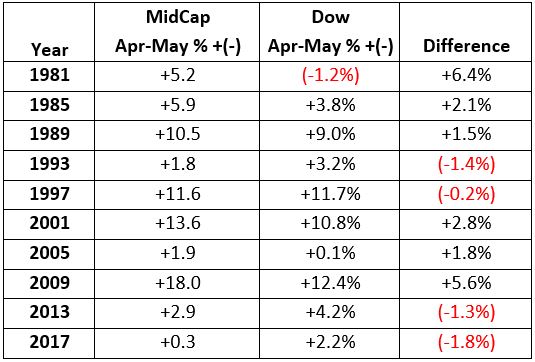
The S&P 400 MidCap Index showed a gain during all 10 cycles and outperformed the Dow 6 out of 10 times.
Election Cycle: Period 2
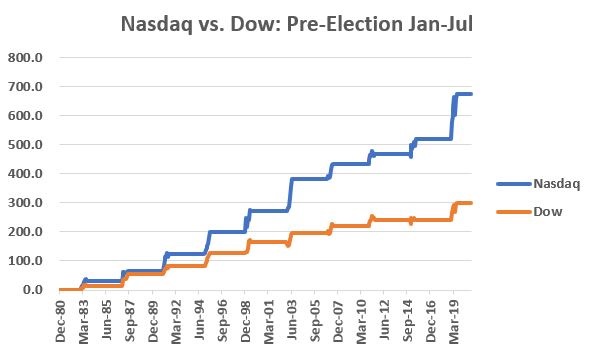
For Period 2 we will look at the price performance for the Nasdaq* versus the Dow during January through July of the Pre-Election year starting in 1983.
The chart below displays the cumulative price gain for the Nasdaq* and the Dow during this 7-month period every four years.
*-Nasdaq Composite 1981-1996, Nasdaq 100 Index 1996-2020
The Table below displays the actual cycle-by-cycle results.
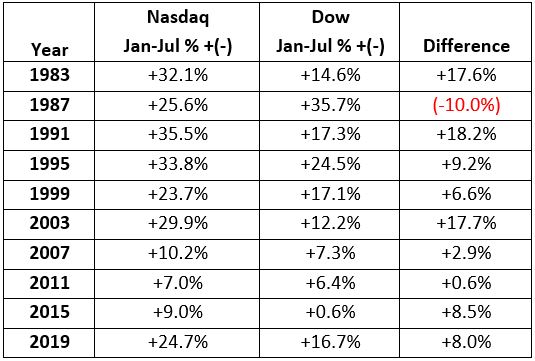
The Nasdaq showed a gain during all 10 cycles and outperformed the Dow 9 out of 10 times.
Two Periods Combined
Just to complete the "experiment", let's compare holding the S&P 400 MidCap Index ONLY during April and May of each post-election year and holding the Nasdaq during January through July of every pre-election year starting in 1981 (a return of zero percent is assumed for all other months). And let's compare these results to holding the Dow Jones Industrial Average during these months instead. The hypothetical equity curves appear in the chart below.
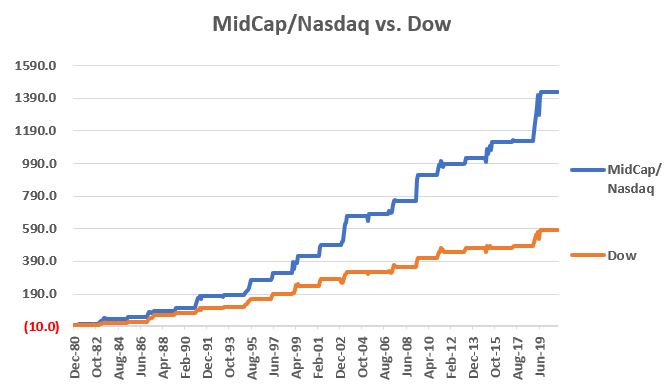
The Table below displays the actual cycle-by-cycle results.
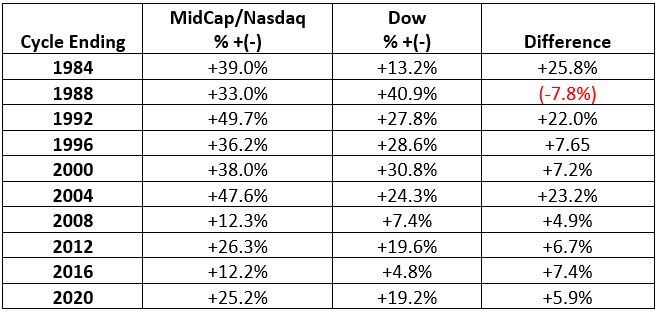
In sum:
- MidCap/Nasdaq gained +1,430%
- Dow gained +583%
- MidCap/Nasdaq outperformed the Dow across 9 of 10 completed 4-year cycles