
Election Cycle Months - Part II: The Sector Edition

Key Points
- The original article highlighted the tendency for the stock market to move cyclically and that certain months (JK Election Cycle Months) within the four-year (48-month) presidential election cycle tended to witness better performance than others
- In this piece, we look at sector performance during JK Election Cycle Months
A quick review
The original article displayed the table below. The months across each four-year election cycle labeled "Stocks" are considered "favorable." The other months are considered "unfavorable" (although, in reality, the model is agnostic stocks during those months and not necessarily outright bearish.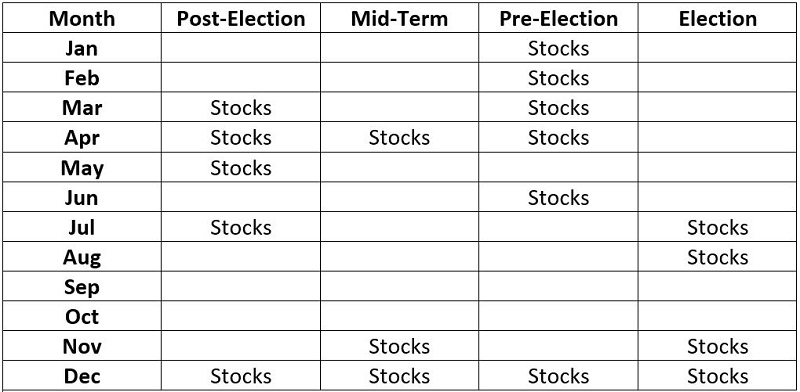
Sector performance during favorable months of the JK Election Cycle
The tests below:
- Examine sector performance only during the months marked "Stocks" in the calendar above
- We use month-end total return data from June 1926 through March 2022
- The data for each sector uses the Fama French dataset from June 1926 into 1990 and then the S&P 500 sector data indexes after that
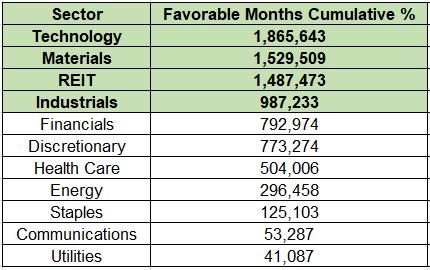
Test #1: Total Cumulative % performance
The table below displays the cumulative % +(-) achieved by each sector if held long only during the months listed "Stocks" in the table above, during each 4-year election cycle since June 1926.
Looking at returns by decade
As you can see in the table above, Technology, Materials, REITs, and Industrials showed the largest cumulative gains. One might be tempted to stop there. However, the most underappreciated factor in investing is "consistency." Anything that provides a large theoretical return but is so volatile that an investor may have trouble "riding out" the occasional but inevitable rough spots is essentially "not as good as looks."
So, we will analyze the decade-by-decade returns for each sector held only during the "favorable" JK Election Cycle Months for all subsequent tests. The table below displays decade-by-decade returns. Note that the figures at the bottom of the table (Average, Median, Standard Deviation, and Average/Standard Deviation) use only full decades. In other words, these figures exclude the 1926-1929 and 2020-2022 periods.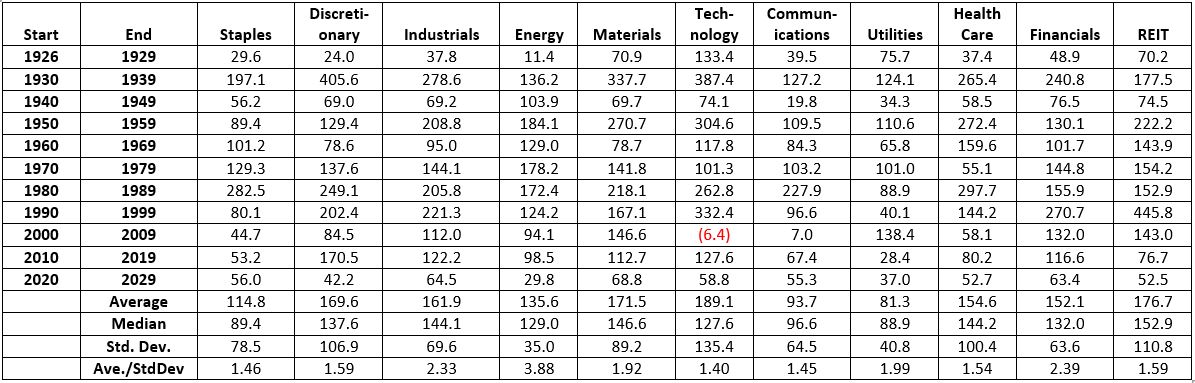
We will analyze the relative performance based on the four factors at the bottom of the table above.
Test #2: Average decade % performance
This test examines each sector's average decade-by-decade % performance (held only during favorable JK Election Cycle Months).
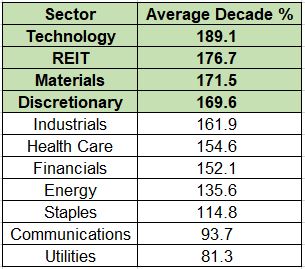
No surprise, the top four sectors are the same as Test #1.
Test #3: Median decade % performance
This test examines each sector's median decade-by-decade % performance (held only during favorable JK Election Cycle Months).
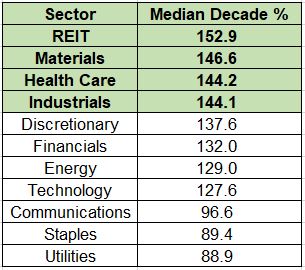
Here we find 3 of the top 4 performers are still the same. However, thanks to a higher degree of consistency across many decades, Health Care replaces Technology in this ranking.
Test #4: Standard Deviation of decade % performance
This test examines the standard deviation of the decade-by-decade % performance for each sector (held only during favorable JK Election Cycle Months). In this test, the lower the value, the better, i.e., it values "steady, quiet" returns above maximum returns.
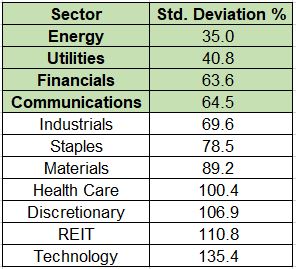
If our goal were to invest in the least volatile sectors during JK Election Cycle Months, then Energy, Utilities, Financials, and Communications would come out on top.
Test #5: Average % divided by Standard Deviation%
This test measures the relative reward-to-risk for each sector across decades. We consider the average decade % return versus the volatility of those returns to find the sectors that (theoretically) offer the highest risk-adjusted returns.
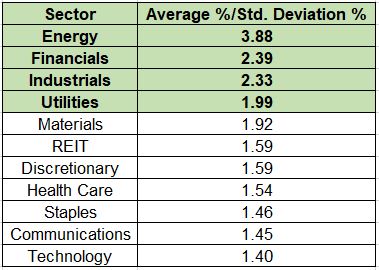
On this basis, the top four sectors are Energy, Financials, Industrials, and Utilities. Interestingly, Technology - which generated the highest overall return - ranks last by this measure.
Performance versus Consistency
Deciding whether to emphasize overall performance or long-term consistency is a question each investor must answer based on their own priorities and temperament. Let's illustrate the potential implications.
The chart below displays the growth of $1 invested in Technology during favorable months versus the growth of $1 split among all eleven sectors only during favorable months from 1926 through 1999.
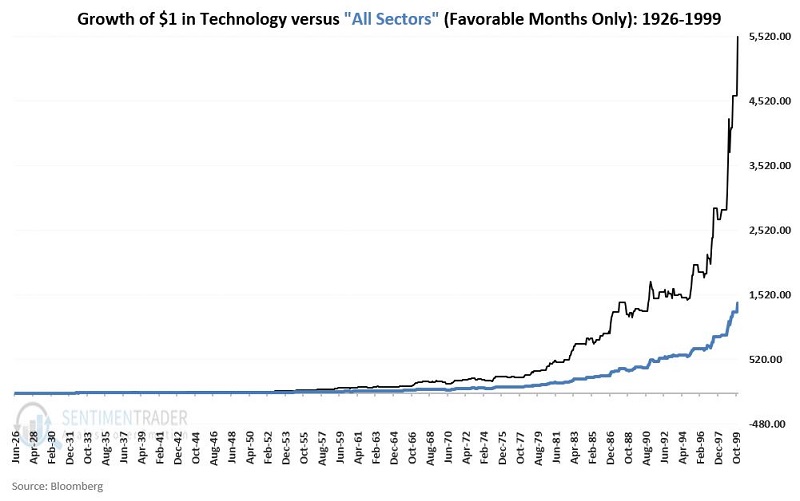
Clearly, technology enjoyed huge outperformance over many decades. In addition, from roughly 2017 into late 2021, Technology was once again a huge outperformer. Still...
The chart below displays the same comparison (technology sector vs. all sectors) from 2000 into 2022.
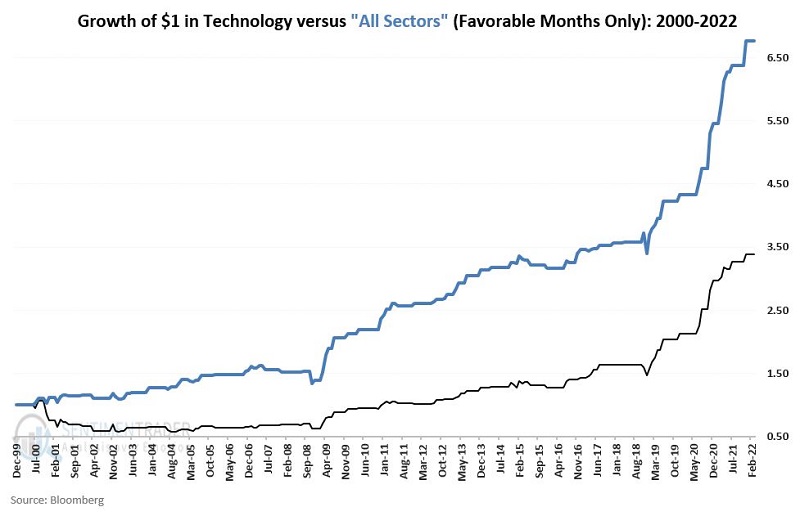
The key thing to note is this: Despite the huge run and outperformance of the Technology sector in recent years, the massive 2000-2002 decline for this sector has caused it to underperform significantly (again, we are talking ONLY about favorable months for the JK Election Cycle) versus "all" sectors. Would an investor keep buying into Technology after nine years of a big net decline from 2000 to 2009? This is probably the key question to ponder.
What the research tells us…
The stock market has demonstrated long-term consistency of performance across the four-year election cycle. By focusing on individual sectors, an investor may outperform both a buy-and-hold approach and an index-only-based approach. Each investor must decide for themselves (regarding virtually any approach to investing) whether to seek maximum returns, minimum risk, or the highest tradeoff between the two.