
Eight out of nine (and five out of five) isn't bad

Key points
- The S&P 500 Index has closed higher during 8 of the first nine months of 2024
- In addition, the index has closed higher for the last five consecutive months
- Historically, following these events, the stock market has typically continued to trend higher
Eight of the first nine months of the year closed higher
The S&P 500 has closed higher during eight of nine months in 2024. The chart below displays a monthly bar chart for the index. The
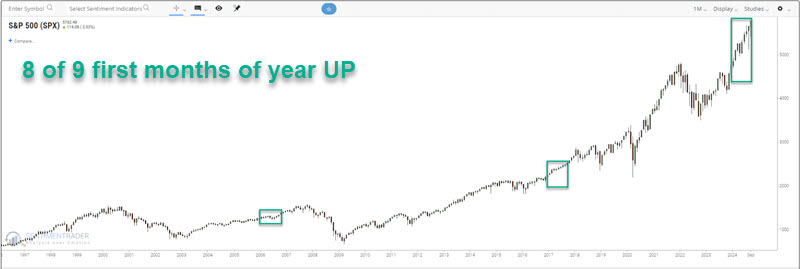
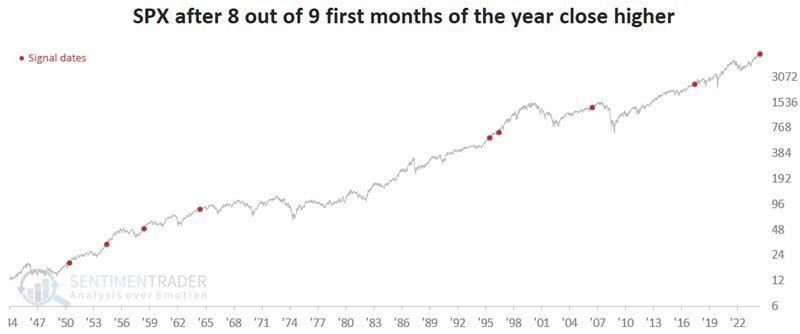
The chart below highlights those times in the Post-WWII era when the S&P 500 Index closed higher during eight of the first nine months of the year (i.e., through the end of September).
The table below displays the price performance for the S&P 500 following the dates highlighted above.
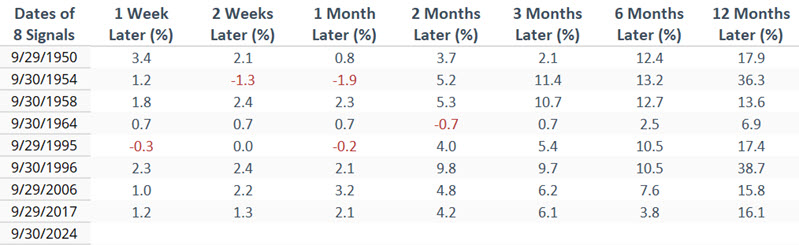
The table below summarizes S&P 500 performance during the periods highlighted in the chart above.
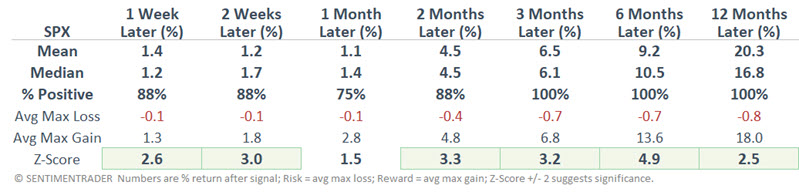
The key points in the table above are the high Win Rates and favorable z-scores across almost all timeframes. This does not guarantee a higher market in the months and years ahead, but it does serve as a reminder to give the bullish case the benefit of the doubt.
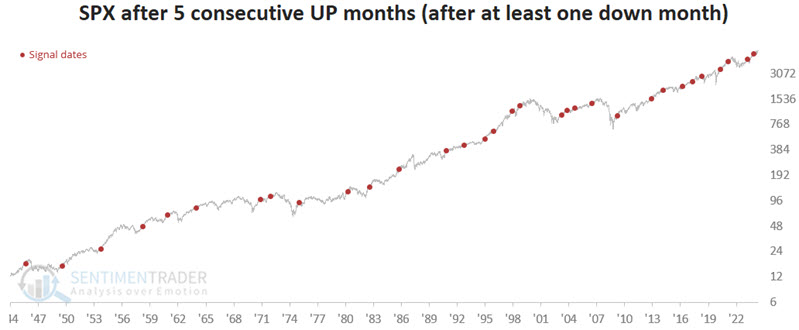
S&P 500 closes higher for five straight months
The S&P 500 registered a monthly loss during April 2024. Since then, it has registered five consecutive higher monthly closes. Intuitively, this causes many investors to presume that the market may "already be up too much" and/or that it is due for a pullback (which could be true). However, history suggests this event should fall on the favorable side of the "weight of the evidence" ledger.
The chart below highlights those times when the S&P 500 closed higher for the fifth consecutive month, following a down month.
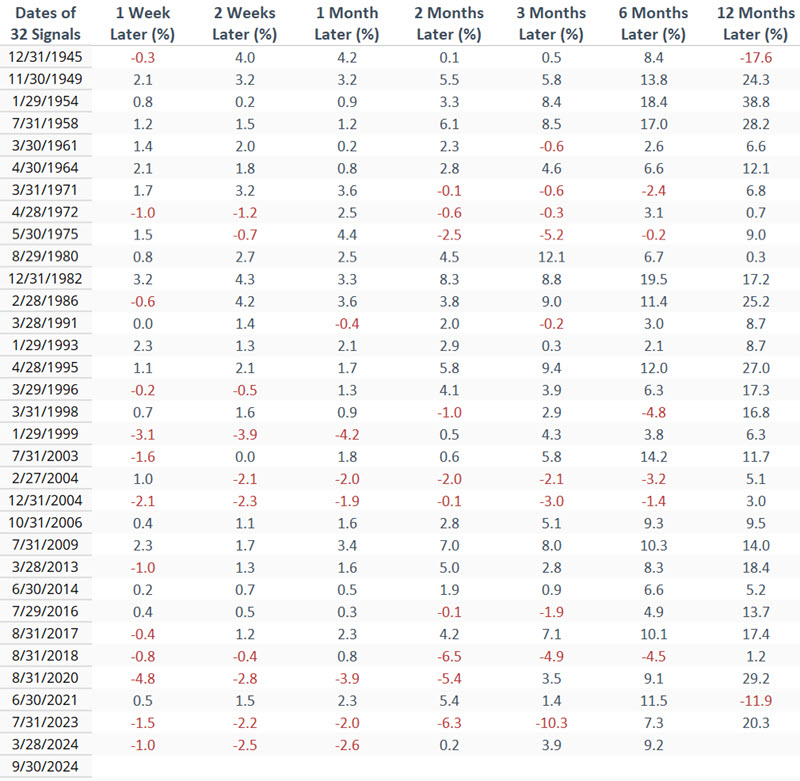
The table below displays the price performance for the S&P 500 following the dates highlighted in the chart above.
The table below summarizes S&P 500 performance during the periods highlighted in the chart and table above.
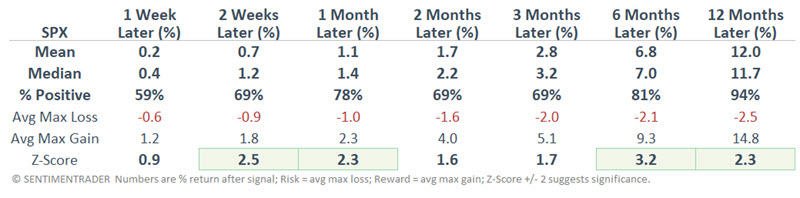
One caveat is that Median Returns are not spectacular. Nevertheless, the Win Rates (especially for six and twelve months) and decent z-scores again suggest that long-term investors continue to give the bullish case the benefit of the doubt.
What the research tells us…
Momentum is a real thing in the stock market. Many investors start to get skittish following a significant advance, assuming that a pullback must be in the offing. And pullbacks - sometimes sizable - are a normal part of market action. However, the real question for longer-term investors is more one of "fight or flight" or, maybe more accurately, "flight or sit tight." While some individuals are tempted to "sell into strength" or "not hold on too long," the above results suggest that long-term investors sit tight and continue to give the bullish case the benefit of the doubt.