Products
SentimenTrader Trading Tools
‍
Backtest Engine
My Trading Toolkit
Correlation Analysis
Seasonality
Market Prediction
Indicators & Data API
‍
Proprietary Indicators & Charts
Market Data API
Strategies & Scanner
‍
50+ Trading Strategies
Smart Stock Scanner
Smart Option Scanner
Research Reports
‍
Research Solutions
Reports Library
Free Resources
Simple Backtest Calculator
Simple Seasonality Calculator
The Kelly Criterion Calculator
Sentiment Geo Map
Public Research Reports
Education
Sentiment Indicators
Technical Indicators
Pricing
Company
About
In the News
Testimonials
Client Success Stories
Contact
Log inLoginSign up
< BACK TO ALL REPORTS

Economic surprises turn positive for the first time in over five months

Dean Christians
2024-10-07
The Citigroup Economic Surprise Index, which tracks how actual economic releases compare to expectations, has moved into positive territory after an extended stretch of negative readings. Comparable shifts in economic trends led to a rise in the S&P 500 over the following year in all but one instance.

Key points:

  • The Citi Economic Surprise Index turned positive, following an extended period in negative territory
  • Similar trends in economic reports surpassing expectations fueled a bullish bias in the S&P 500
  • Cyclical stocks outperformed defensive ones as the 10-year Treasury yield tended to increase

Economic releases are beating expectations

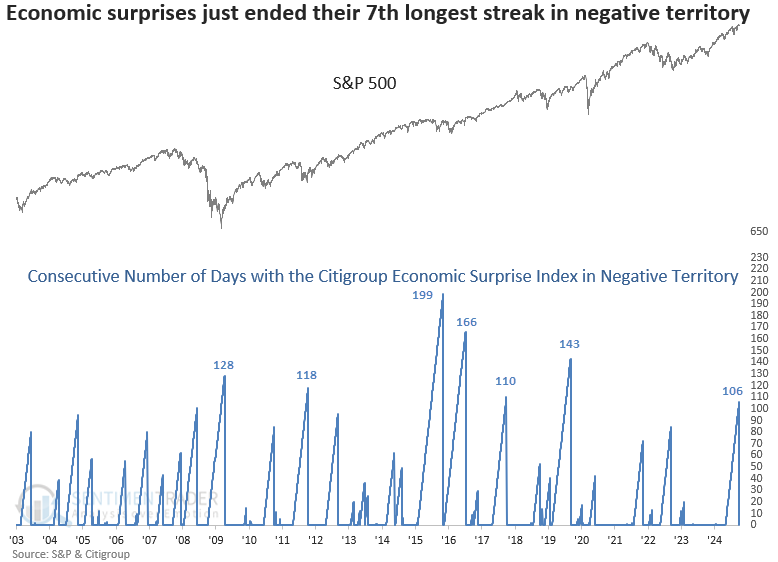
When the Citi Economic Surprise Index rises above zero, it reflects that economic reports have exceeded analysts' projections over a rolling three-month period. In contrast, a reading below zero means releases have been weaker than anticipated. 

Following the 7th longest streak in history in negative territory, the Citigroup Economic Surprise Index turned positive. 

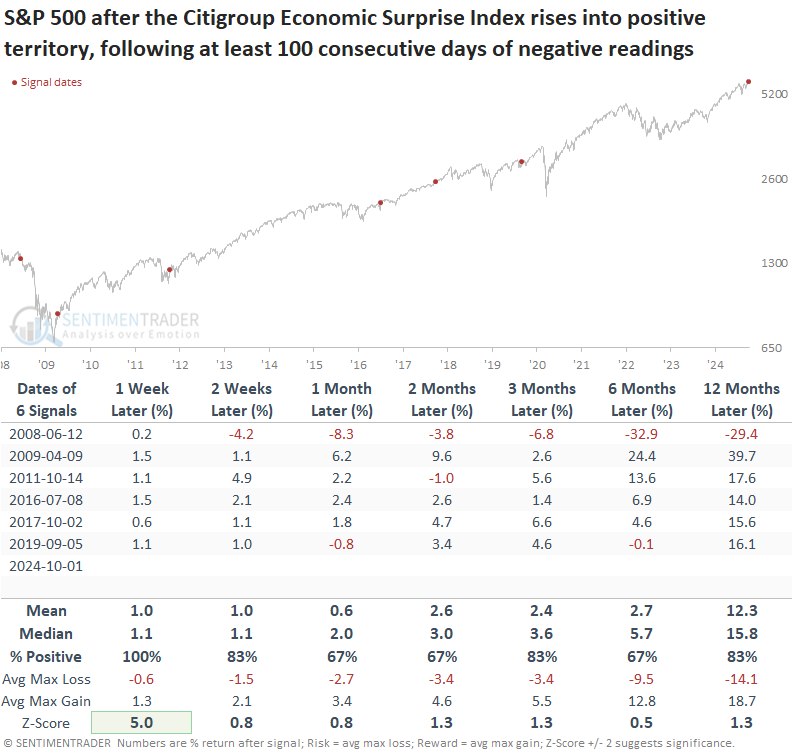
The previous streak of at least 100 consecutive days in negative territory occurred in 2019, when the Federal Reserve last shifted from a tightening to an easing policy stance, offering an interesting comparison. That signal produced a maximum gain of 13% in the S&P 500 over six months, just before the onset of Covid. 

Similar reversals in economic surprises produced positive stock returns

While the sample size is small, whenever the Citigroup Economic Surprise Index increased above zero following at least 100 consecutive days in negative territory, the S&P 500 rose in all but one case over the following year. That instance occurred in 2008, during a downtrend in the S&P 500, a scenario vastly different from today's market environment. 

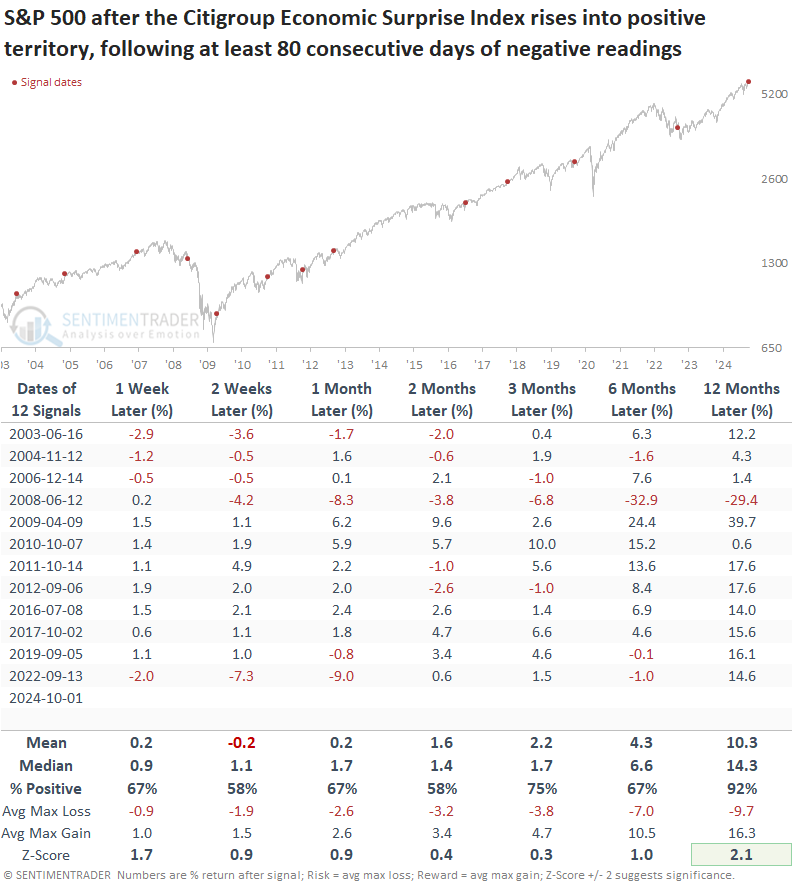
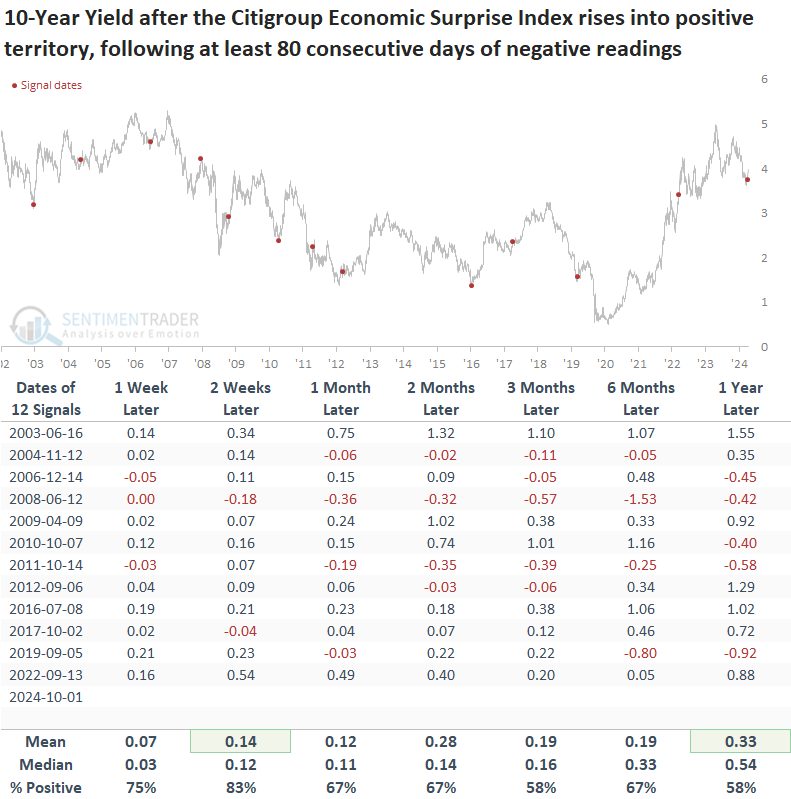
If the threshold is reduced from 100 consecutive days to 80, the sample size grows, with precedents jumping from 6 to 12. Under these conditions, the S&P 500 continued its upward trajectory, rising 92% of the time over the subsequent year. 

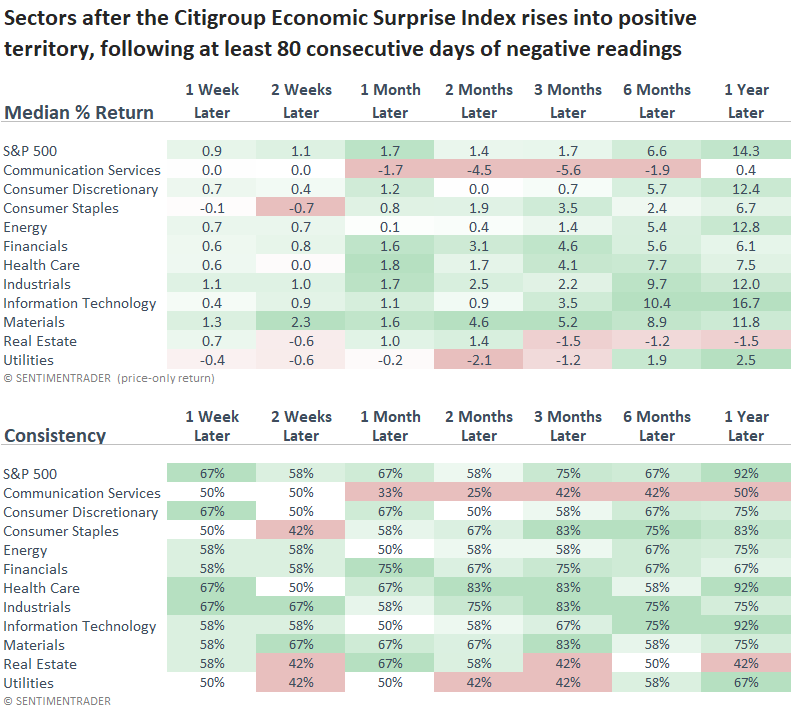
Given the stronger-than-expected economic reports, it's no surprise that cyclical sectors outperform while defensive ones lag. 

Although one day doesn't define a trend, after last Friday's stronger-than-expected NFP report, Real Estate and Utilities declined as the S&P 500 and cyclical sectors rallied sharply. 

The recent rally in the 10-year yield could persist for a while longer 

Fueled by better-than-expected economic data, the 10-year yield typically rises over short-and medium-term periods. With defensive sectors like utilities having been relative winners and exhibiting an overbought condition, a further increase in the 10-year yield could put pressure on these groups.

What the research tells us...

Economic reports have surpassed expectations over the past three months, driving an index that tracks the data series into positive territory. Historically, similar patterns have provided a tailwind to equities, particularly benefiting cyclical sectors. The 10-year Treasury yield typically climbs as stronger-than-expected data indicates a more robust economy than economists had forecast, placing pressure on higher-yielding defensive sectors as rising bond yields offer an attractive alternative. 

PRODUCTS
SentimenTrader
Trading Tools
Indicators & Data API
‍
Strategies & Scanner
‍
Research Reports
FREE
RESOUrCES
Simple Backtest
Calculator
Simple Seasonality
Calculator
The Kelly Criterion
Calculator
Sentiment Geo Map
‍
Public Research Reports
‍
Education
Sentiment Indicators
‍
Technical Indicators
‍
Pricing
Bundle pricing
‍
FAQ
‍
Announcements
‍
COMPANY
‍
About
‍
In the News
‍
Testimonials
‍
Client Success Stories
CONTACT
‍
General Inquiries
‍
Media Inquiries
‍
Financial Professionals Inquiries
‍
© 2026 Sundial Capital Research Inc. All rights reserved.
Setsail Marketing
TermsPrivacyAffiliate Program
Risk Disclosure: The information and tools provided are for research and analytical purposes only and are not intended as investment advice. Market analysis involves uncertainty, and outcomes may differ from expectations. Users should conduct their own due diligence and consider their individual circumstances before making any financial decisions. Past performance is not necessarily indicative of future results.

Hypothetical Performance Disclosure: Hypothetical performance results have many inherent limitations, some of which are described below. No representation is being made that any account will or is likely to achieve profits or losses similar to those shown; in fact, there are frequently sharp differences between hypothetical performance results and the actual results subsequently achieved by any particular trading program. One of the limitations of hypothetical performance results is that they are generally prepared with the benefit of hindsight. In addition, hypothetical trading does not involve financial risk, and no hypothetical trading record can completely account for the impact of financial risk of actual trading. for example, the ability to withstand losses or to adhere to a particular trading program in spite of trading losses are material points which can also adversely affect actual trading results. There are numerous other factors related to the markets in general or to the implementation of any specific trading program which cannot be fully accounted for in the preparation of hypothetical performance results and all which can adversely affect trading results.

Testimonial Disclosure: Testimonials appearing on this website may not be representative of other clients or customers and is not a guarantee of future performance or success.