
Dr. Copper is crashing

Key points:
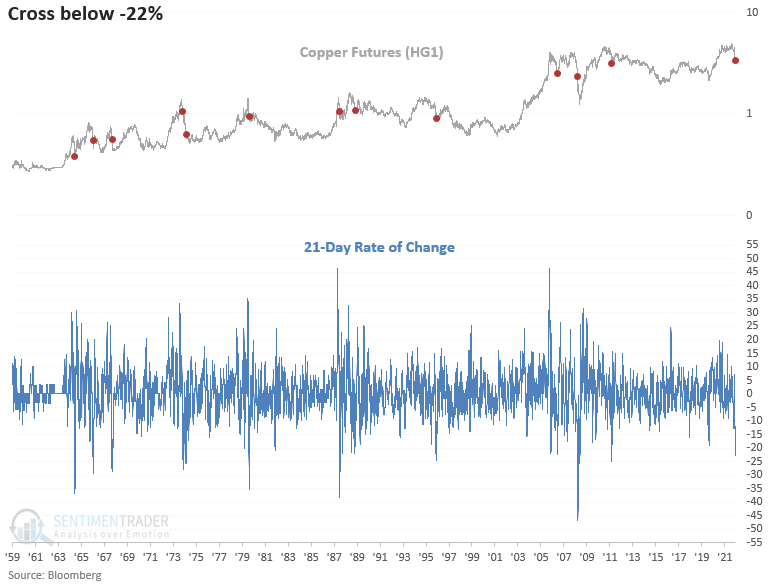
- Copper futures have fallen over 22% in a trailing 1-month period
- After similar signals, copper momentum remains unfavorable, and commodities show mixed results
- The S&P 500 appears slightly favorable in the near term and very constructive on a long-term basis
- Homebuilding and semiconductor stocks look somewhat troubling
The commodity with a Ph.D. in economics is crashing
In a note on April 26th and June 22nd, I shared a few copper studies with a cautious outlook for the commodity with a Ph.D. in economics. Copper has continued to decline and has now fallen over 22% in a trailing 1-month period.
Let's conduct a study to assess the outlook for copper, commodities, and stocks after copper futures fall 22% in a trailing 21-day period. I will use a reset that requires the ROC to cross above 0% to screen out repeats.
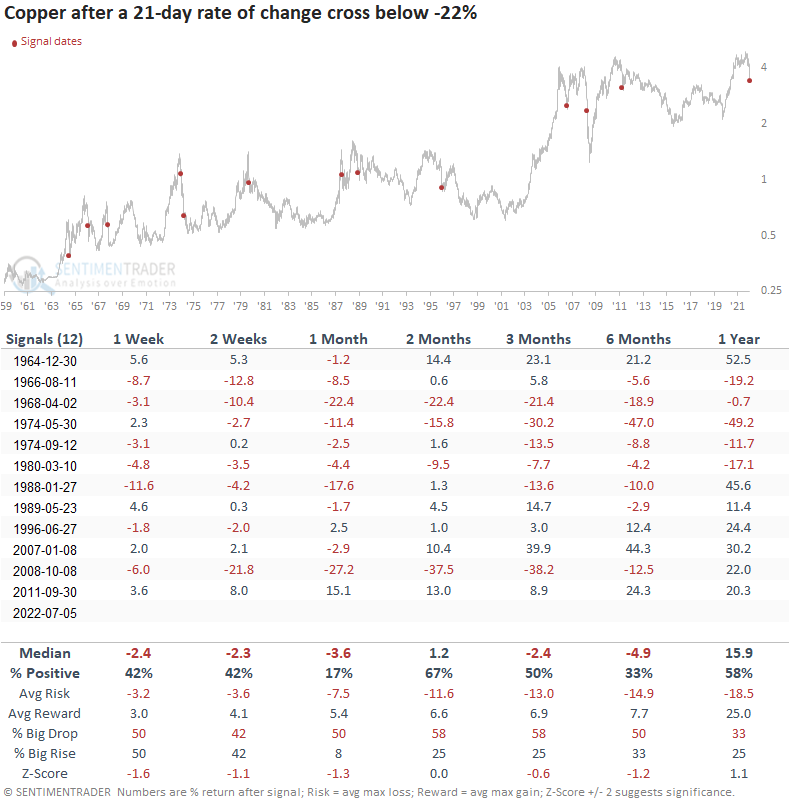
For the first time in a decade and the 13th time since 1959, copper futures have fallen by over 22% in 1-month. The previous instance in 2011 led to a multi-year bear market for the commodity.
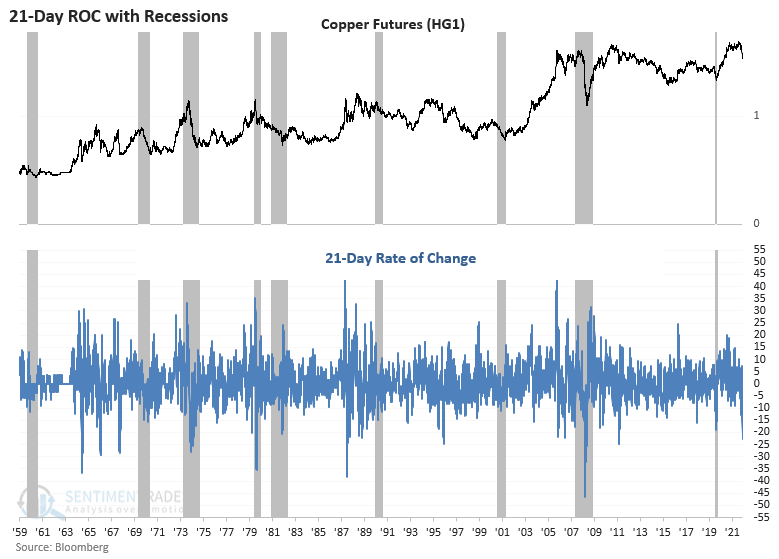
Copper crashes and recessions
Significant downward momentum shifts in copper similar to today show a mixed record at best when signaling a recession. And, in the cases where it did trigger around a recession, it was coincidental versus leading.
Similar signals preceded negative returns for copper futures
This study generated a signal 12 other times over the past 58 years. After the others, copper returns, win rates, and z-scores look unfavorable across almost all short and medium-term time frames. The first month shows a loss at some point in 11 out of 12 cases.
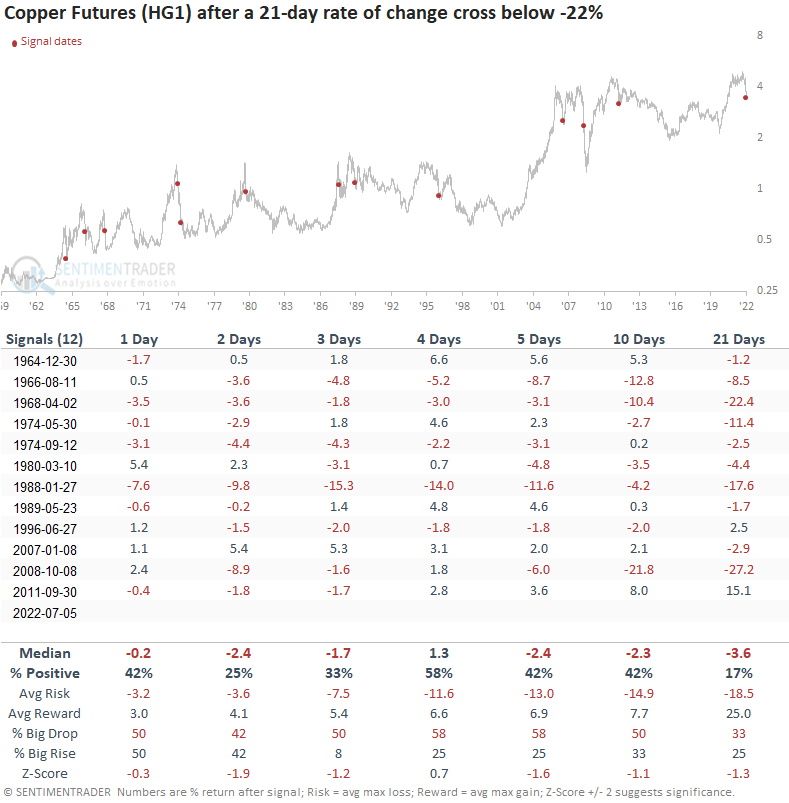
The short-term outlook table for copper doesn't bode well for a relief rally in the next few days.
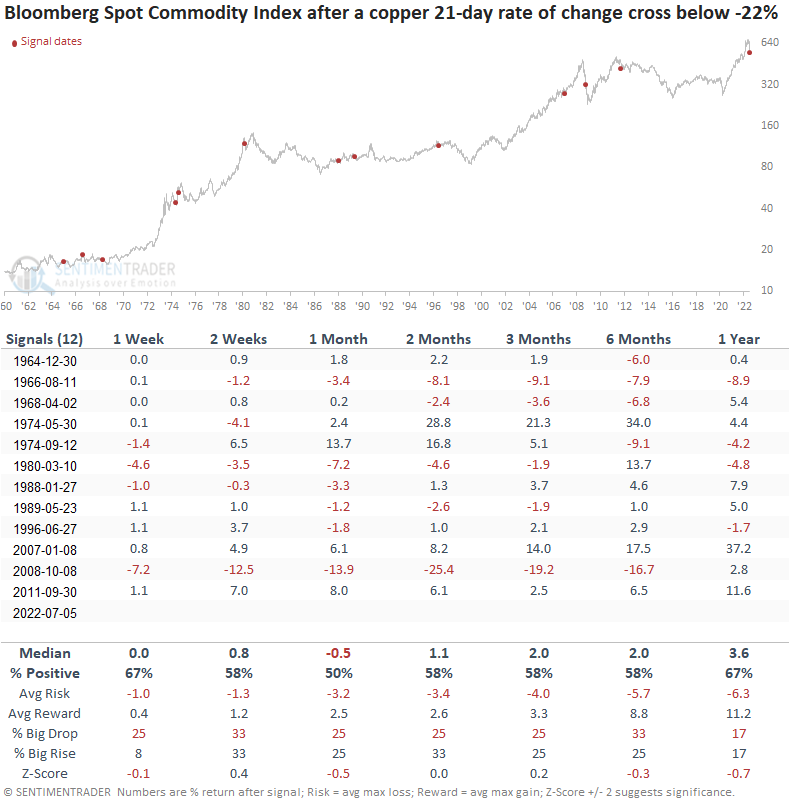
What happens to commodities after copper signals
Commodities show somewhat flat results in the next 6 months, with a loss in 10 out of 12 cases at some point.
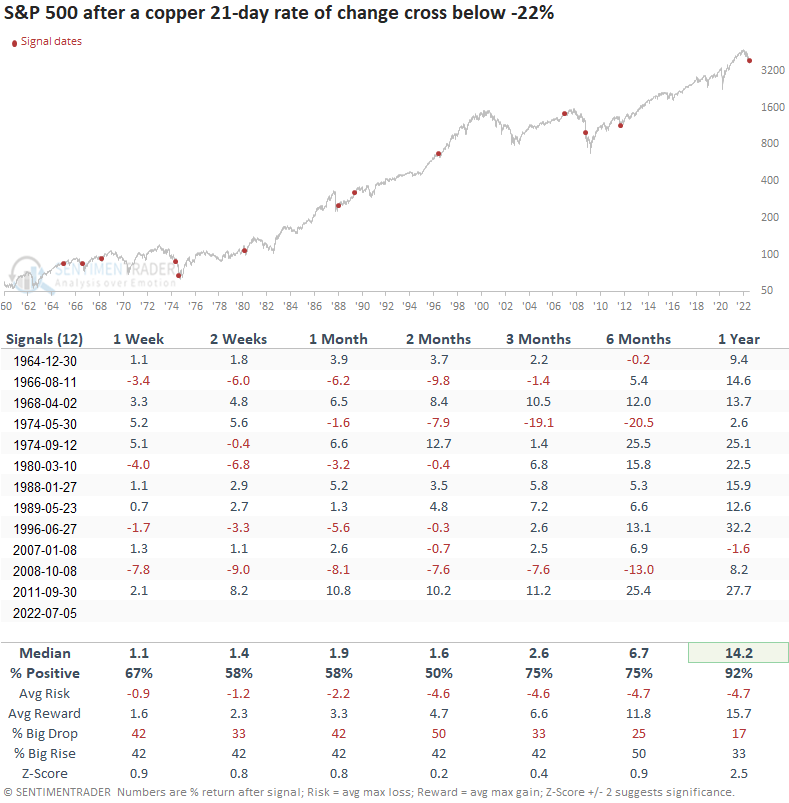
What happens to the S&P 500 after copper signals
The S&P 500 shows slightly favorable results across short and medium-term time frames. However, the 1-year return, win rate, and z-score suggest better days ahead. The 1974 and 2008 instances should act as a reminder that the path to a bullish long-term outlook can be rocky.
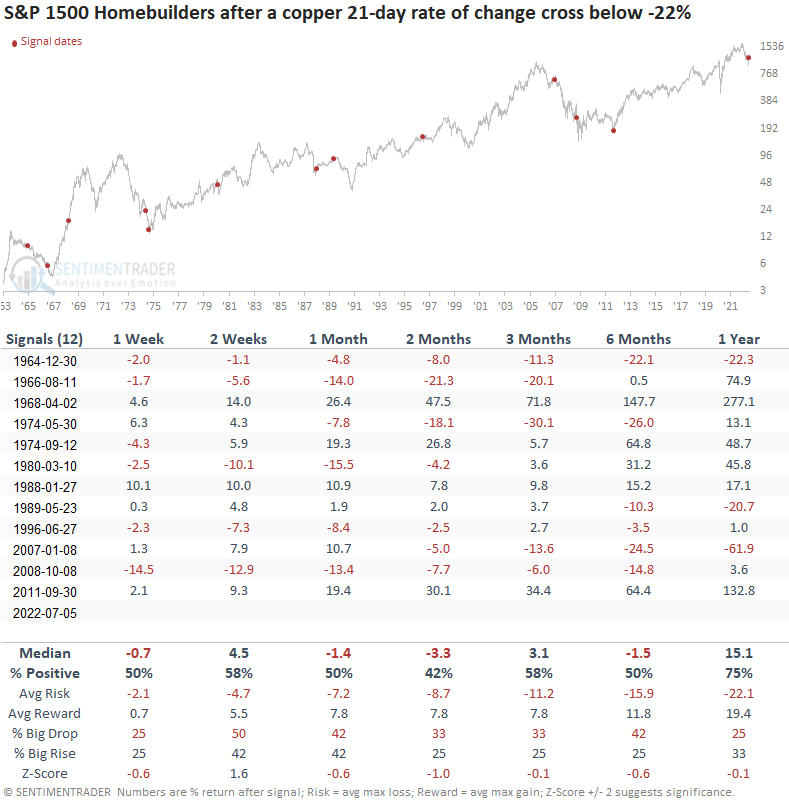
What happens to Homebuilding stocks after copper signals
Given coppers utilization in housing, let's look at the builders. The stocks and ETFs like ITB have had a nice relief rally as the 10-year bond yield has fallen 67 bps in a brief period. However, the downside momentum in copper shows a cautious outlook for homebuilding stocks across short and medium time frames.
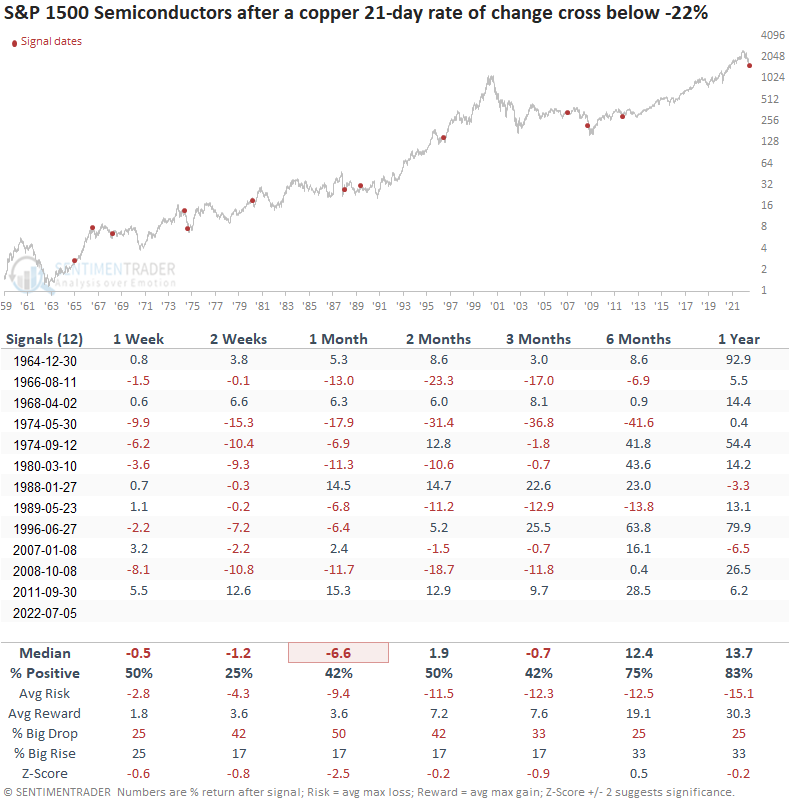
What happens to semiconductor stocks after copper signals
Semiconductor stocks, apparently the new transports, show weak results across short and medium-term time frames. The first month shows a loss at some point in 9 out of 12 cases.
What the research tells us...
When copper futures decline by 22% or more in a trailing 1-month period, the downward shift in momentum typically leads to more adverse price action for copper. Similar setups to what we're seeing now have preceded unfavorable copper performance, win rates, and z-scores across short and medium-term time frames. If I apply the signals to commodities, returns look somewhat flat over the next 6 months. While the S&P 500 shows favorable results, especially on a long-term basis, economically sensitive groups like homebuilders and semiconductors look unfavorable.