Products
SentimenTrader Trading Tools
‍
Backtest Engine
My Trading Toolkit
Correlation Analysis
Seasonality
Market Prediction
Indicators & Data API
‍
Proprietary Indicators & Charts
Market Data API
Strategies & Scanner
‍
50+ Trading Strategies
Smart Stock Scanner
Smart Option Scanner
Research Reports
‍
Research Solutions
Reports Library
Free Resources
Simple Backtest Calculator
Simple Seasonality Calculator
The Kelly Criterion Calculator
Sentiment Geo Map
Public Research Reports
Education
Sentiment Indicators
Technical Indicators
Pricing
Company
About
In the News
Testimonials
Client Success Stories
Contact
Log inLoginSign up
< BACK TO ALL REPORTS

Don't be taken by surprise by QQQ strength

Jay Kaeppel
2023-01-10
Many investors have turned away from the Nasdaq 100 Index following its massive loss in 2022. Still, history suggests this may be a mistake.

Key points

  • The Nasdaq 100 is off to a quick start in early 2023 on the heels of a massive -33% decline in 2022
  • Investors should not be taken by surprise
  • The Nasdaq 100 has a strong history during the first seven months of pre-election years

The Nasdaq 100 Index versus the calendar

I wrote about the tendency for strength in the early to middle part of a pre-election year in this article and this article. Here let's focus on the Nasdaq 100 Index ($NDX). For trading purposes, an investor can focus on the Invesco QQQ Trust (ticker QQQ), an ETF that tracks the Nasdaq 100 Index.

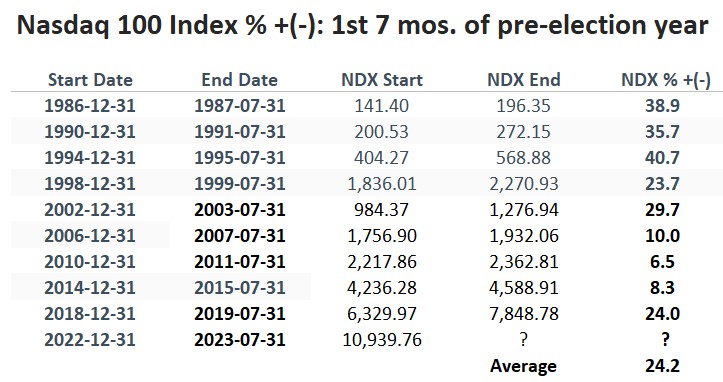
NDX was first calculated in 1985. Since then, nine pre-election years have been completed, plus the first few trading days of 2023. The table below displays the return for NDX during the first seven months of each pre-election year, starting in 1987.

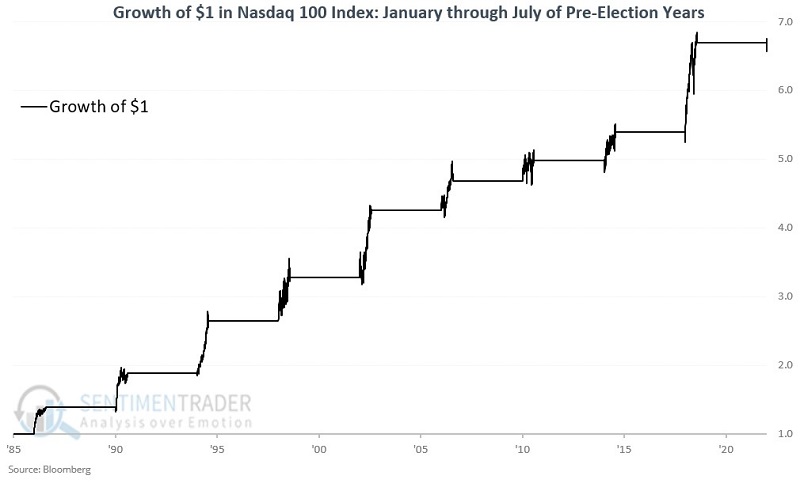
The chart below displays the cumulative growth of $1 invested in NDX only during January 1st through July 31st of each pre-election year - including the first few days of January 2023.

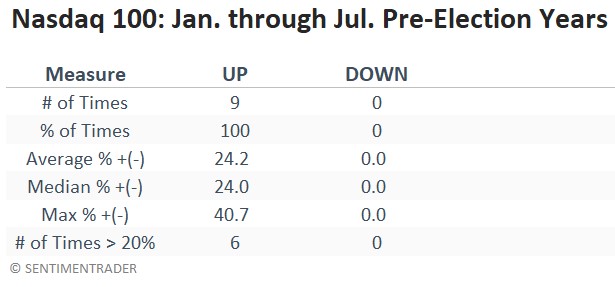
The table below displays a summary of NDX's performance during these times.

What the research tells us…

It is difficult to quibble with the historical performance of the Nasdaq 100 Index during the first seven months of a pre-election year. Some might raise the issue of a relatively small sample size - but remember that the S&P 500 Index has exhibited the same tendency to advance strongly during a pre-election year since the 1930s. 

On the one hand, NDX lost a staggering -33% in 2022, so many investors are hesitant to jump into the weakest of the major indexes. On the other hand, the indexes' historical performance during this current phase in the four-year election cycle is quite compelling. While not guaranteed, a strong bounce coming off the deeply oversold extremes of 2022 should not come as a surprise. 

PRODUCTS
SentimenTrader
Trading Tools
Indicators & Data API
‍
Strategies & Scanner
‍
Research Reports
FREE
RESOUrCES
Simple Backtest
Calculator
Simple Seasonality
Calculator
The Kelly Criterion
Calculator
Sentiment Geo Map
‍
Public Research Reports
‍
Education
Sentiment Indicators
‍
Technical Indicators
‍
Pricing
Bundle pricing
‍
FAQ
‍
Announcements
‍
COMPANY
‍
About
‍
In the News
‍
Testimonials
‍
Client Success Stories
CONTACT
‍
General Inquiries
‍
Media Inquiries
‍
Financial Professionals Inquiries
‍
© 2026 Sundial Capital Research Inc. All rights reserved.
Setsail Marketing
TermsPrivacyAffiliate Program
Risk Disclosure: The information and tools provided are for research and analytical purposes only and are not intended as investment advice. Market analysis involves uncertainty, and outcomes may differ from expectations. Users should conduct their own due diligence and consider their individual circumstances before making any financial decisions. Past performance is not necessarily indicative of future results.

Hypothetical Performance Disclosure: Hypothetical performance results have many inherent limitations, some of which are described below. No representation is being made that any account will or is likely to achieve profits or losses similar to those shown; in fact, there are frequently sharp differences between hypothetical performance results and the actual results subsequently achieved by any particular trading program. One of the limitations of hypothetical performance results is that they are generally prepared with the benefit of hindsight. In addition, hypothetical trading does not involve financial risk, and no hypothetical trading record can completely account for the impact of financial risk of actual trading. for example, the ability to withstand losses or to adhere to a particular trading program in spite of trading losses are material points which can also adversely affect actual trading results. There are numerous other factors related to the markets in general or to the implementation of any specific trading program which cannot be fully accounted for in the preparation of hypothetical performance results and all which can adversely affect trading results.

Testimonial Disclosure: Testimonials appearing on this website may not be representative of other clients or customers and is not a guarantee of future performance or success.