Products
SentimenTrader Trading Tools
‍
Backtest Engine
My Trading Toolkit
Correlation Analysis
Seasonality
Indicators & Data API
‍
Proprietary Indicators & Charts
Market Data API
Strategies & Scanner
‍
50+ Trading Strategies
Smart Stock Scanner
Research Reports
‍
Research Solutions
Reports Library
Free Resources
Simple Backtest Calculator
Simple Seasonality Calculator
The Kelly Criterion Calculator
Sentiment Geo Map
Public Research Reports
Education
Sentiment Indicators
Technical Indicators
Pricing
Company
About
In the News
Testimonials
Client Success Stories
Contact
Log inLoginSign up
< BACK TO ALL REPORTS

Does this indicator mean that smart money is selling?

Jason Goepfert
2021-03-30
Over the past 3 months, stocks have consistently sold off during the last hour of trading.

You wouldn't know it by the last couple of days, Friday in particular, but the past few months have been dominated by late-day selling pressure.

The Cumulative Last Hour indicator looks at the last hour of trading in the S&P 500 fund, SPY. If the fund rises during that hour, then the indicator adds 1 to the running total. If it drops, then it subtracts 1.

Recent months have seen a continual erosion in the indicator, to the point where it's at the lowest level in 6 years. When stocks have been persistent hitting new highs while the Last Hour indicator was plumbing new lows, it has been a warning sign.

Cumulative Last Hour smart money indicator

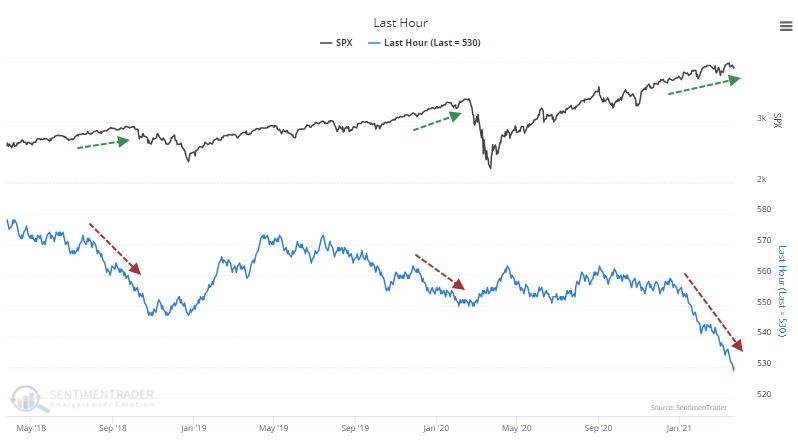
What may be especially notable about the current behavior is just how persistent the selling has been during the last hour. Over the past 3 months, the indicator has dropped 5%, which doesn't sound like a lot, but it's the biggest drop in 25 years. 

What else we're looking at

  • Detailed returns after other big drops in the Last Hour indicator
  • What happens when stocks hit a 52-week high and the Last Hour indicator a 52-week low
  • Why the last hour might have changed in recent years
  • Looking at a trading system using sector members above their short-term moving averages
  • A detailed look at sector returns during April - with one major standout sector

Stat Box

On Monday, the S&P 500 closed within 0.1% of its 52-week high, but fewer than 35% of NYSE issues advanced, and less than 35% of volume flowed into those issues. This is the weakest breadth in at least 60 years with the S&P so near its high.


Etcetera

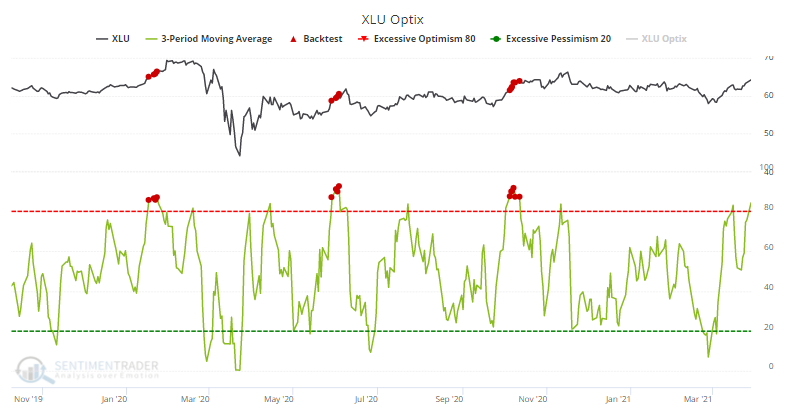
Not so boring now. The utilities sector doesn't usually get people's hearts racing, but over the past 3 days, the Optimism Index has averaged 85%. In the history of the XLU fund, there have been 66 other days with a reading this high according to our Backtest Engine.

utilities xlu sentiment

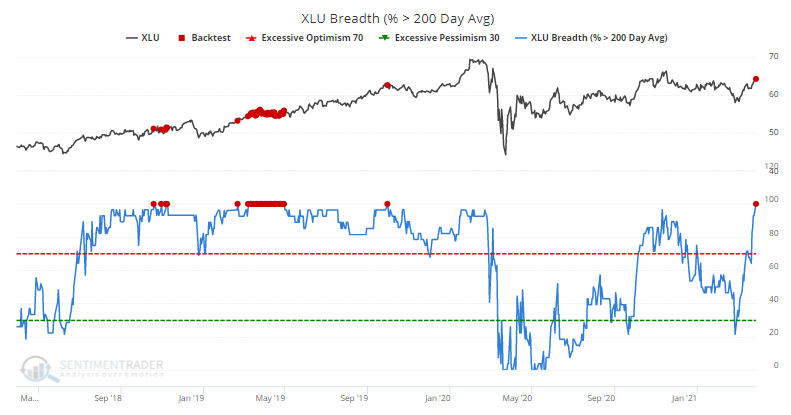
All aboard. It's pretty unusual to see every stock agreeing, but in the Utilities sector, every stock is currently enjoying an uptrend.

percent of utilities xlu above 200 day moving average

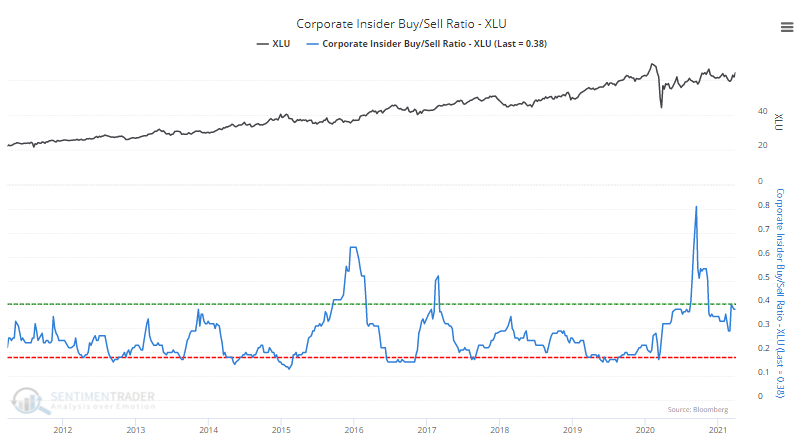
Insiders are believers. Among all sectors, corporate insiders have been among the most positive in Utilities stocks. The Insider Buy / Sell Ratio for the sector has jumped into positive territory.

utility corporate insiders

PRODUCTS
SentimenTrader
Trading Tools
Indicators & Data API
‍
Strategies & Scanner
‍
Research Reports
FREE
RESOUrCES
Simple Backtest
Calculator
Simple Seasonality
Calculator
The Kelly Criterion
Calculator
Sentiment Geo Map
‍
Public Research Reports
‍
Education
Sentiment Indicators
‍
Technical Indicators
‍
Pricing
Bundle pricing
‍
FAQ
‍
Announcements
‍
COMPANY
‍
About
‍
In the News
‍
Testimonials
‍
Client Success Stories
CONTACT
‍
General Inquiries
‍
Media Inquiries
‍
Financial Professionals Inquiries
‍
© 2026 Sundial Capital Research Inc. All rights reserved.
Setsail Marketing
TermsPrivacyAffiliate Program
Risk Disclosure: Futures and forex trading contains substantial risk and is not for every investor. An investor could potentially lose all or more than the initial investment. Risk capital is money that can be lost without jeopardizing ones’ financial security or life style. Only risk capital should be used for trading and only those with sufficient risk capital should consider trading. Past performance is not necessarily indicative of future results.

Hypothetical Performance Disclosure: Hypothetical performance results have many inherent limitations, some of which are described below. No representation is being made that any account will or is likely to achieve profits or losses similar to those shown; in fact, there are frequently sharp differences between hypothetical performance results and the actual results subsequently achieved by any particular trading program. One of the limitations of hypothetical performance results is that they are generally prepared with the benefit of hindsight. In addition, hypothetical trading does not involve financial risk, and no hypothetical trading record can completely account for the impact of financial risk of actual trading. for example, the ability to withstand losses or to adhere to a particular trading program in spite of trading losses are material points which can also adversely affect actual trading results. There are numerous other factors related to the markets in general or to the implementation of any specific trading program which cannot be fully accounted for in the preparation of hypothetical performance results and all which can adversely affect trading results.

Testimonial Disclosure: Testimonials appearing on this website may not be representative of other clients or customers and is not a guarantee of future performance or success.