
Does the narrow sector leadership matter

Key points:
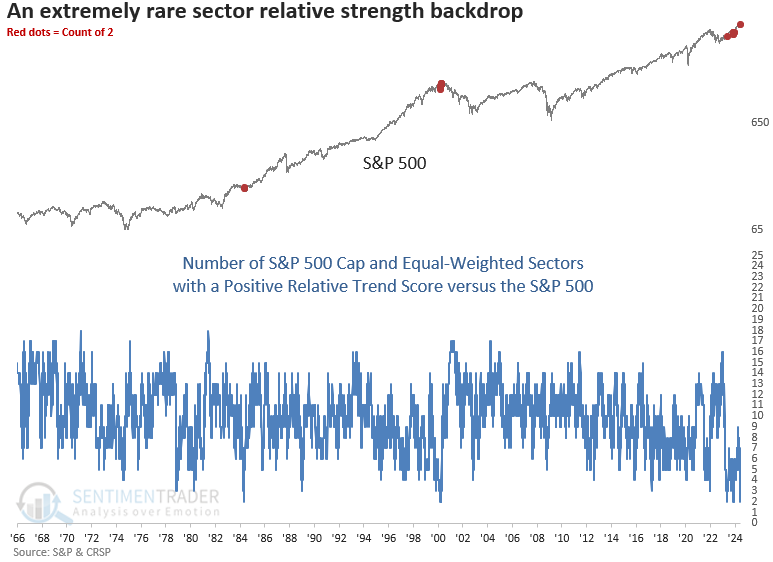
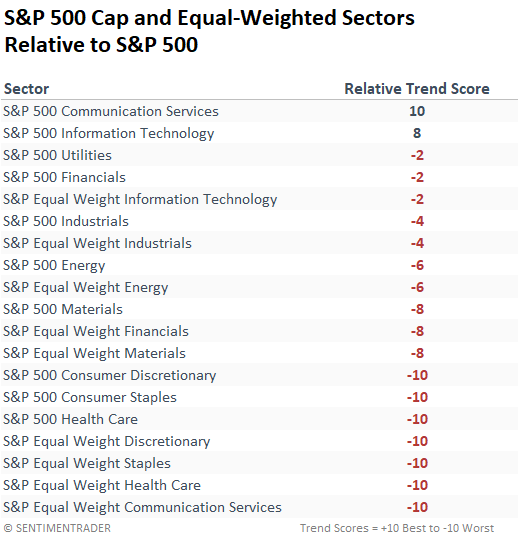
- Only 2 out of 20 cap and equal-weighted sectors display a positive relative trend score versus the S&P 500
- Similar periods with narrow-sector leadership resulted in bullish outcomes over the next six and twelve months
- The S&P 500 cap-weighted index tended to outperform the equal-weighted index over a medium-term horizon
Sector leadership narrows to a handful of groups
While analyzing relative trend scores this weekend using the composite indicator methodology frequently featured in my research notes, I observed that only two out of the twenty cap and equal-weighted sectors maintained a positive relative trend score compared to the S&P 500.
In case you were wondering, the sectors were Technology and Communication Services, groups dominated by mega-cap stocks.
As illustrated in the chart below, this rare phenomenon has occurred for the third time since the bear market low in 2022. Before this period, it triggered in 1984 and again in 2000.
In 1984, the Energy sector commanded a 20% share of the S&P 500's market capitalization, surpassing other sectors but not by a significant margin. However, the dot-com era presented a more relevant comparison to today, with Technology comprising a whopping 35% of the S&P 500, doubling the share of the second-highest sector, Financials, at 17%.
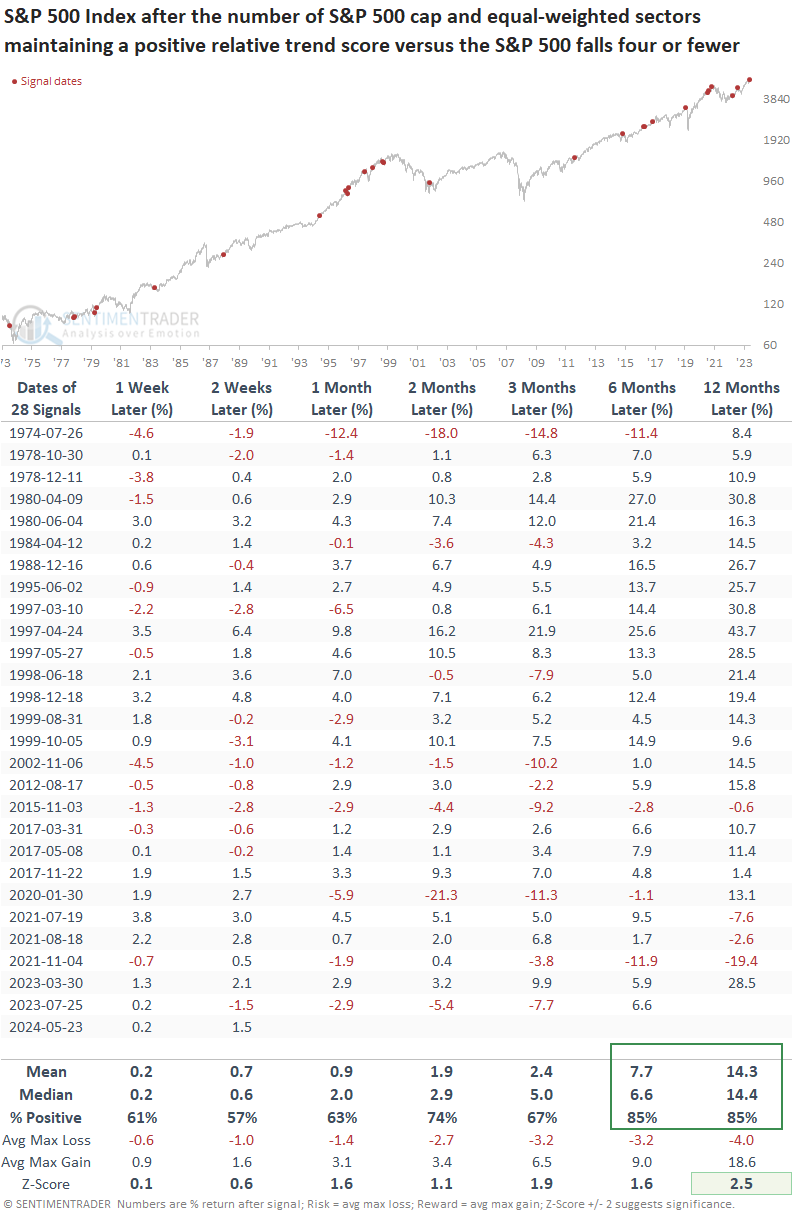
Given that a larger sample size is advantageous, let's examine other historical instances where the number of cap and equal-weighted sectors with a positive relative trend score versus the S&P 500 dropped to four or fewer.
The influence of mega-cap stocks on index trends is most evident in the communications services sector, where the market-cap-weighted index holds a score of 10, the exact opposite of the equal-weighted version.
I excluded Real Estate from the study because it has a limited history.
Similar periods of narrow leadership displayed positive returns
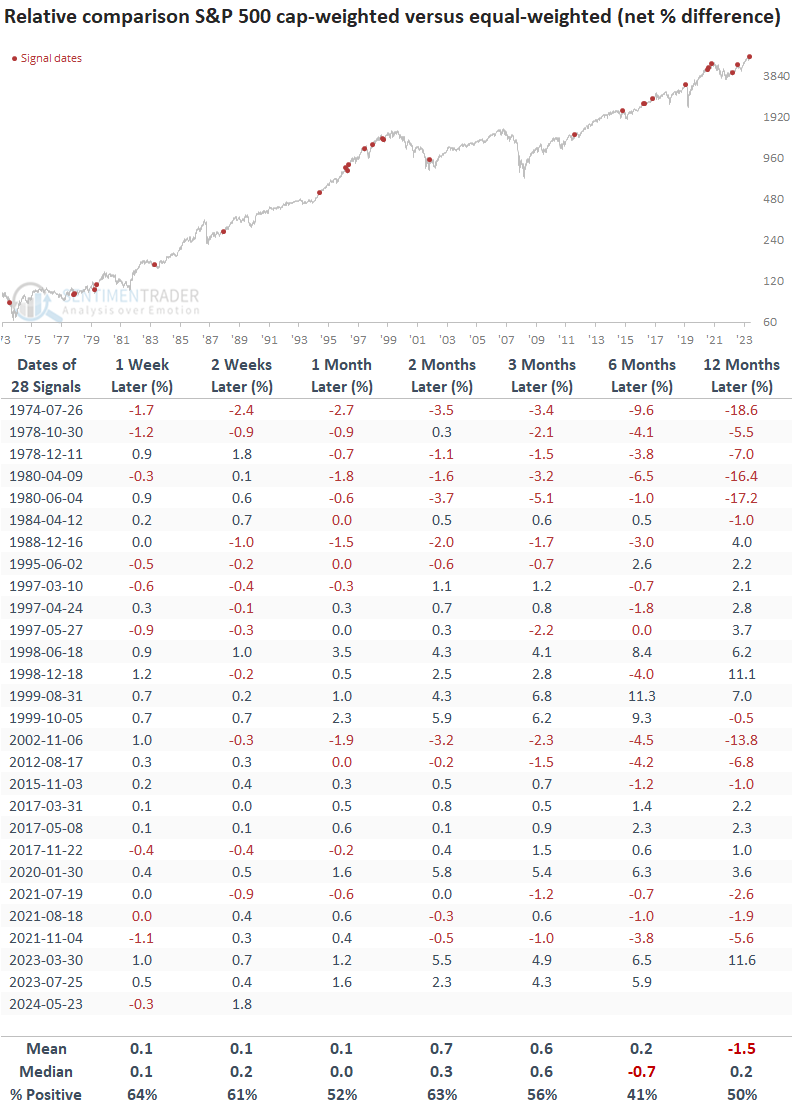
Whenever the number of cap and equal-weighted sectors with a positive relative trend score versus the S&P 500 dropped to four or fewer, the world's most benchmarked index displayed positive returns and favorable win rates, especially over the subsequent six and twelve months.
It's not uncommon for episodes of narrow-sector leadership to occur in clusters. Other than 2021, the S&P 500 generally brushed them off, potentially highlighting periods of sector rotation.
When I apply the signals to the S&P 500 equal-weighted index, which eliminates the influence of mega-cap stocks on index performance by weighing each member equally, the outlook maintains a bullish upward bias over the following year, notwithstanding the 2021 period.
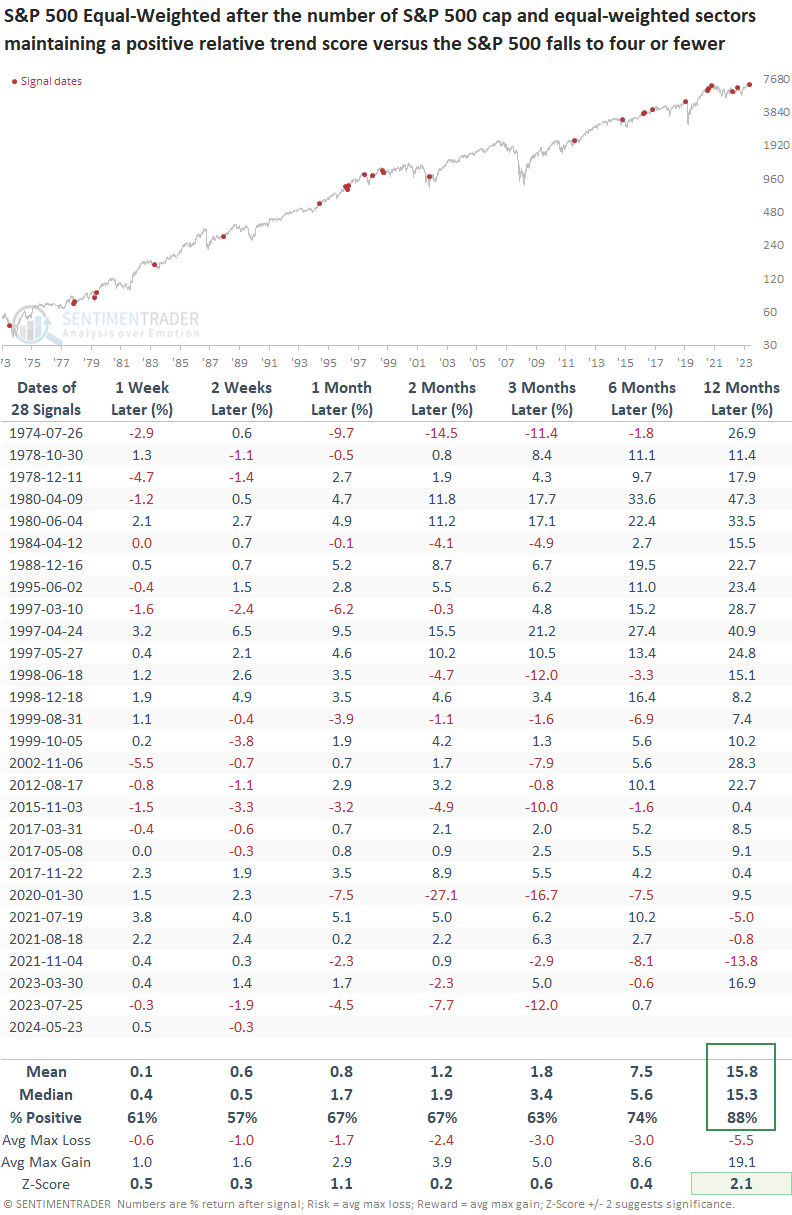
A relative comparison between the two index-weighting methodologies suggests that the cap-weighted index's current outperformance could persist over a medium-term horizon. Over the subsequent year, there was no clear-cut winner between the two indexes.
Sector rotation
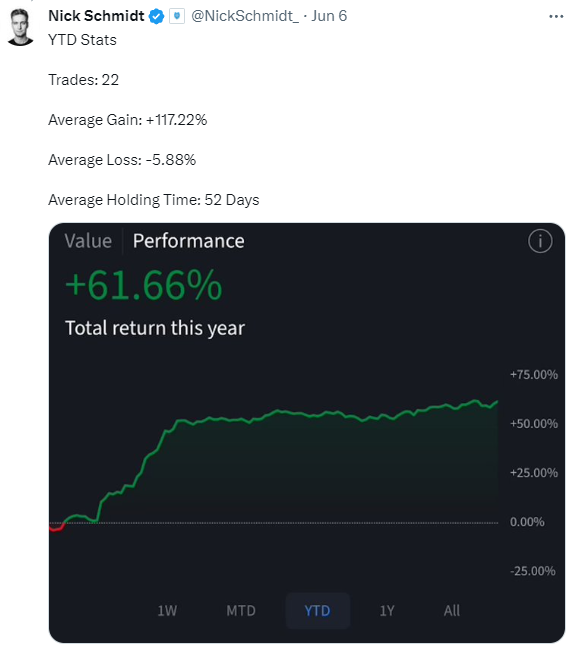
Over the weekend, I stumbled across this tweet from Nick Schmidt. I share it because the trajectory of his equity curve caught my eye the most. After ramping higher early in the year, it has somewhat gone flat. One plausible reason is that swing or break-out trading strategies have struggled as stocks fail to extend to the upside, resulting in more and more consolidations.
Consolidations are common in bull markets. However, they can result in unfavorable-looking short-and medium-term market breadth indicators, something we've highlighted several times in the last month. It's imperative to grasp the difference between internal rotation/consolidations and something more systemic that typically coincides with major market peaks.
What the research tells us...
There's a noticeable decline in sectors exhibiting positive relative trend scores compared to the S&P 500. While this phenomenon more often than not suggests sector rotation under the surface of an index, one must acknowledge that valuations and concentration are reminiscent of the unsettling times leading up to the 2000 Dotcom peak. Following periods when four or fewer cap or equal-weighted sectors maintained a positive relative trend score versus the S&P 500, the world's most benchmarked index and the equal-weighted version steadily rose over the following year. If you've favored the cap-weighted S&P 500 over the equal-weighted version, history suggests to stick with the former.