
Does January matter?

Key Points
- The original January Barometer suggests that stock market performance during January tends to foreshadow performance for the rest of the year - the historical track record is compelling
- In this piece, we present our own version called the January Model and the January Model Signal
- Overall, the action in January 2025 was favorable for stocks
The venerable January Barometer
The "January Barometer" was first introduced by the legendary Yale Hirsch, founder of the Stock Trader's Almanac. Per the Almanac, the theory is that "as January goes, so goes the year." In other words, a favorable January should be followed by higher stock prices from the end of January through the end of December. The track record is compelling. Hirsch and STA also introduced the "First Five Days" indicator, which suggests that the first five trading days of the year offer a clue regarding the rest of the year.
In this piece, I will introduce our own version of interpreting stock market action during January. Based on January's action, we take STA's original work and add a few "tweaks" to form a mechanical strategy to designate the stock market trend as favorable or unfavorable on any given day based solely on stock market action during January. We refer to these as the January Model (which can be defined as "Favorable" or "Unfavorable" on any given day) and the January Model Signal (which will be rated as +1 or 0 depending on whether the January Model is favorable or unfavorable.
NOTE: The January Model and January Model Signal are not currently available on the Sentimentrader.com website. I do plan to coordinate with our programming team to have them added soon.
The January Model and January Model Signal
If the S&P 500:
- closes the month of January with a gain for the month, then A = +4 else A = 0 UNTIL the end of January the following year
- closes the first five trading days of January with a net gain, then B = +2 else B = 0 UNTIL the close of the fifth trading day of the following year
- closes the last five trading days of January with a net gain, then C = +1 else C = 0 UNTIL the end of January the following year
Variable D = A + B + C
Variable D can equal 0, +1, +2, +3, +4, +5, +6, or +7
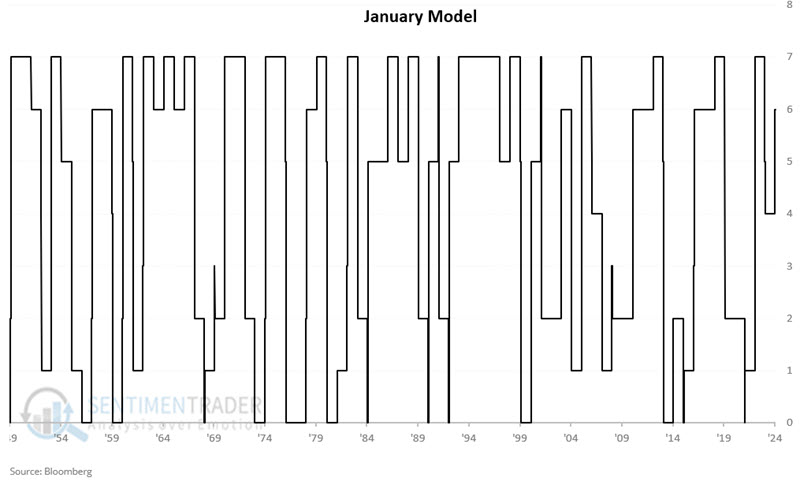
The January Model = Variable D
The January Model is considered to be:
- "Favorable" if D = 0, 1, or 3. Hold cash if D = 0, 1, or 3
- "On a Buy Signal" If D = 2, 4, 5, 6, or 7. Hold stocks if D = 2, 4, 5, 6, or 7
The chart below displays historical readings for our January Model. Note that because the first five days, the last five days, and the month of January 2025 all showed a gain, the January Model now reads +7.
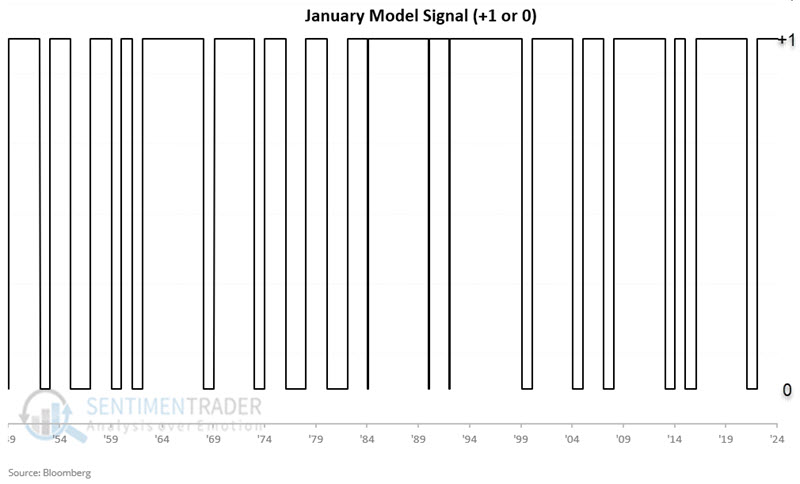
The January Model Signal:
- Will read +1 if the January Model is "Favorable"
- Will read zero if the January Model is "Unfavorable"
The chart below displays historical readings for our January Model Signal.
Now that we know how the January Model is constructed and how the January Model Signal is generated, let's look at historical results.
The test:
- We will use daily price-only data for the S&P 500 Index starting on 1949-12-31.
- We will hold a long position in SPX if the model is "Favorable" (January Model Signal = +1)
- We will hold a flat position if the model is "Unfavorable" (January Model Signal = 0)
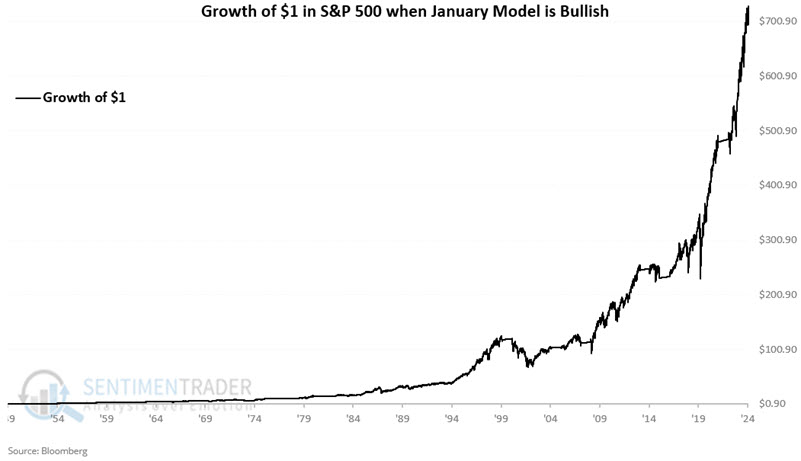
Summarizing results
The chart below displays the hypothetical growth of $1 invested in the S&P 500 Index only when the model is "Favorable." A hypothetical initial $1 grew to $719, a gain of +71,826%.
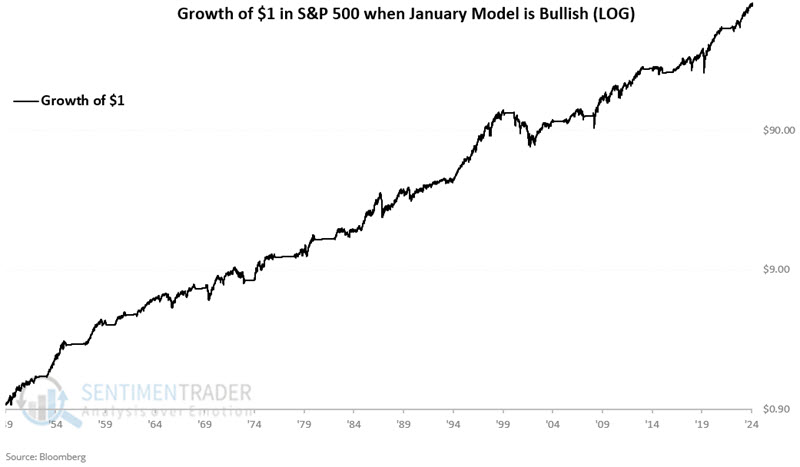
The chart below displays the same results on a logarithmic scale.
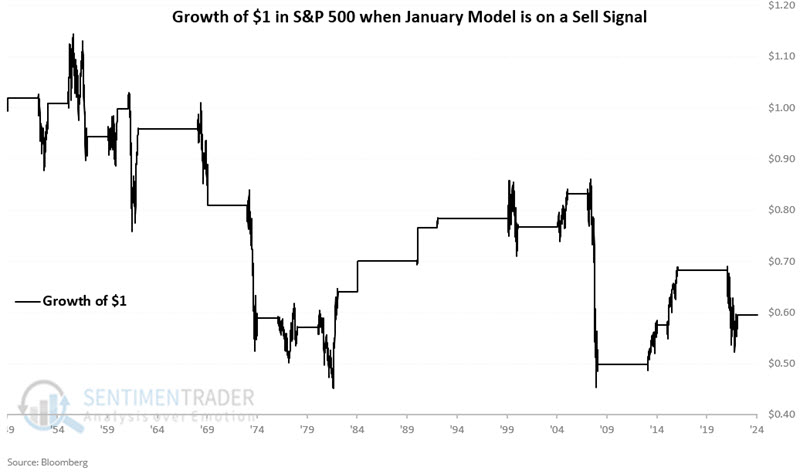
The table below displays the hypothetical growth of $1 invested in the S&P 500 Index only when the model is "Unfavorable." A hypothetical initial $1 decreases to $0.595, a loss of -40.5%.
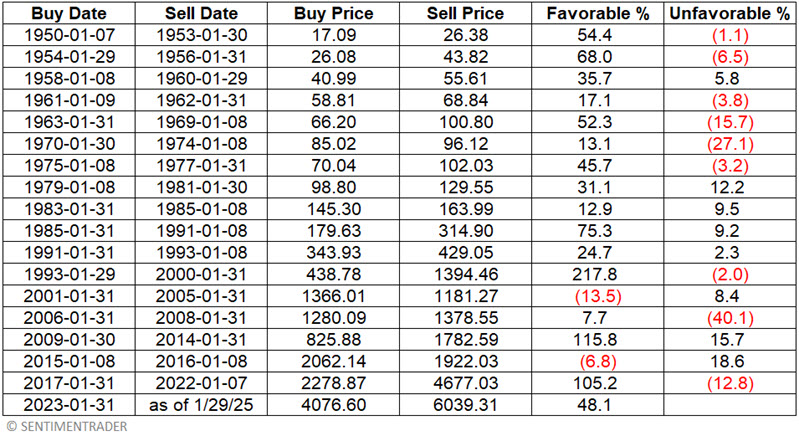
The table below displays Buy and Sell Dates and SPX performance during each Buy Signal or Sell Signal period.
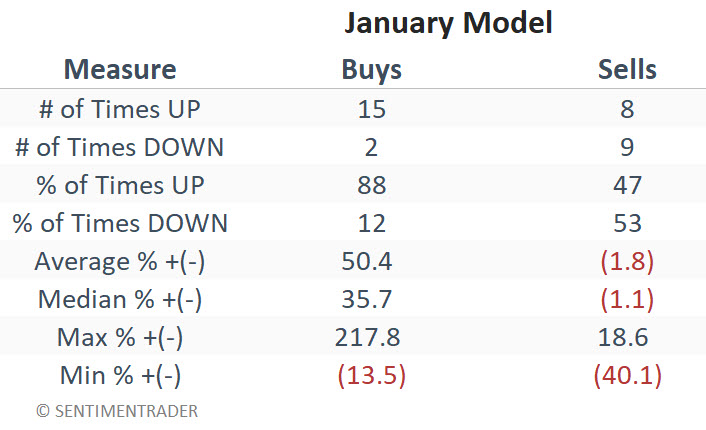
The table below summarizes results during Buy Signal periods versus Sell Signal periods
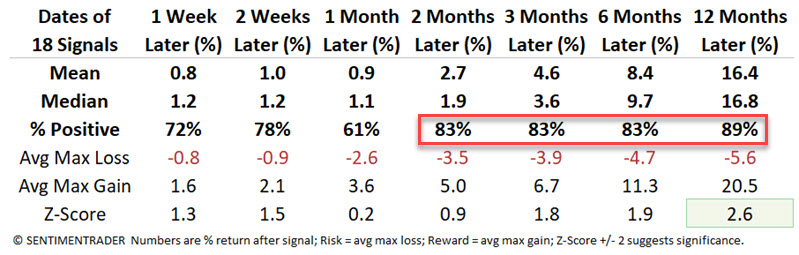
Finally, the table below summarizes first-year results following each to Buy Signal.
Where are we in 2025?
The last five trading days of January 2025 failed to show a gain, so our January Model did not "hit the trifecta," so to speak. However, the month as a whole showed a gain for the S&P 500, as did the first five trading days of the year. As a result:
- Our January Model reads +6 and will continue to do so through at least the first five trading days of 2026
- Our January Model Signal will read +1 (i.e., "favorable") during the same period
- Likewise, since January 2025 showed a gain for the S&P 500, both the January Model and January Model Signal will remain favorable through at least the end of January 2026
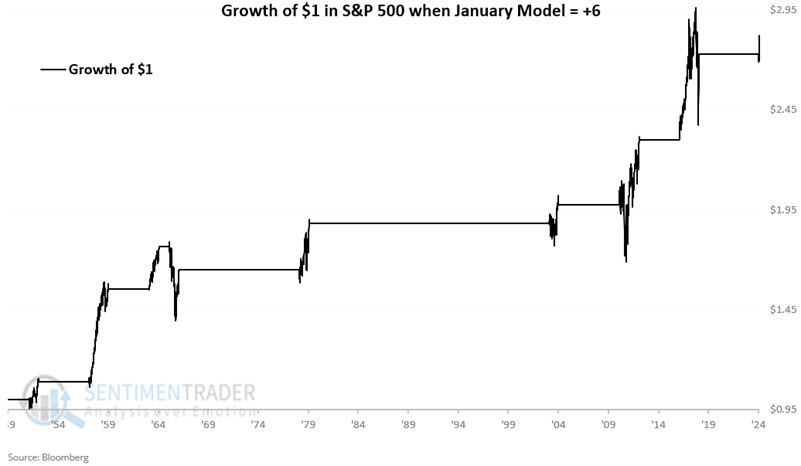
The chart below displays the hypothetical growth of $1 invested in the S&P 500 only when the model = +6.
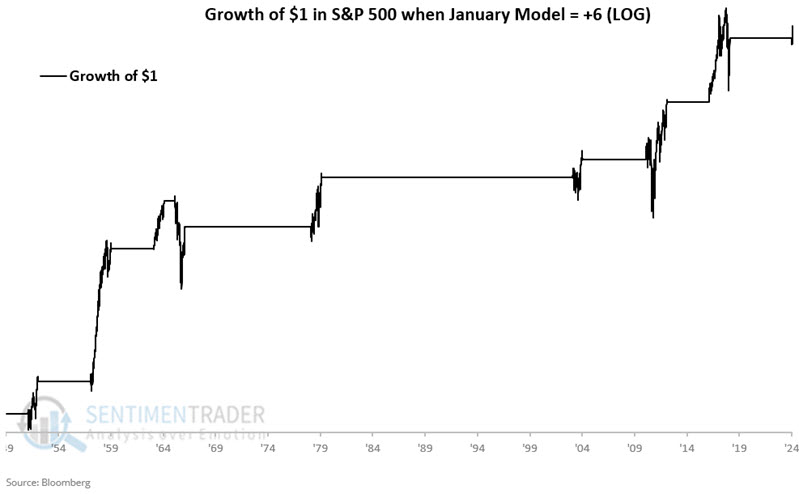
The chart below displays the same results on a logarithmic scale.
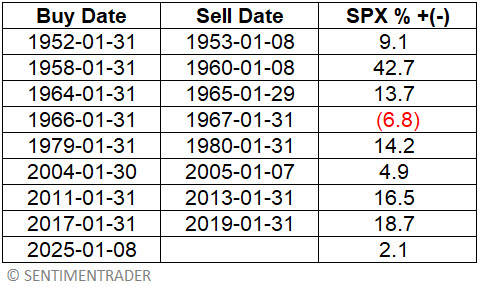
A new +6 period began at the close of 2025-01-08. The table below displays S&P 500 results during the previous +6 periods.
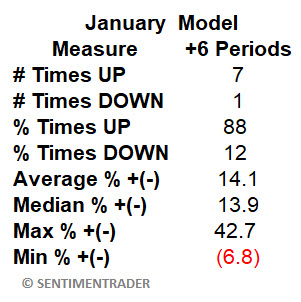
The table below summarizes S&P 500 results for all +6 periods.
Finally, the table below summarizes first-year results following each new +6 reading.
Under the category of "what might have been"
For your information, if the S&P 500 had gained over the last five trading days of January, our January Model would have read +7. The data below shows the history of S&P 500 performance during the +7 January Model reading periods.
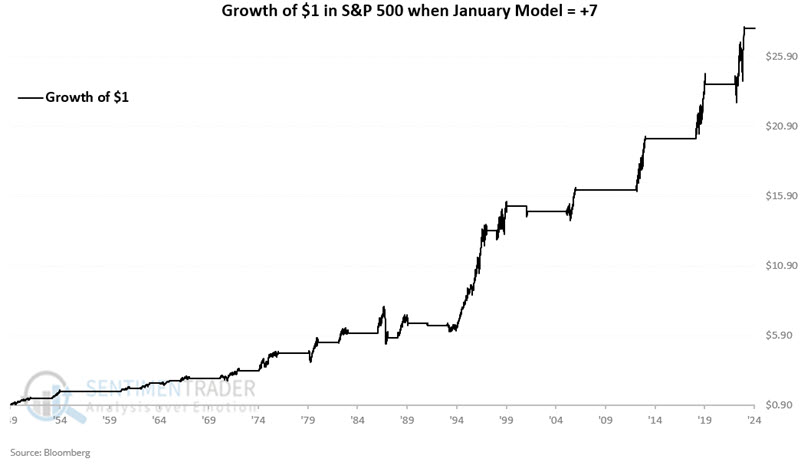
The chart below displays the hypothetical growth of $1 invested in the S&P 500 only when the model = +7.
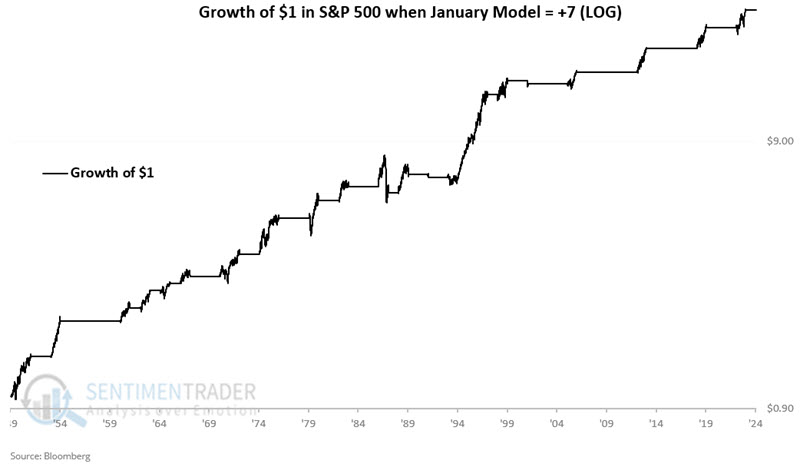
The chart below displays the same results on a logarithmic scale.
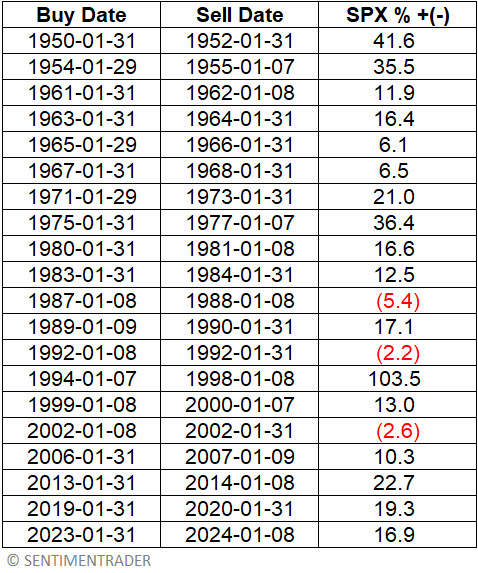
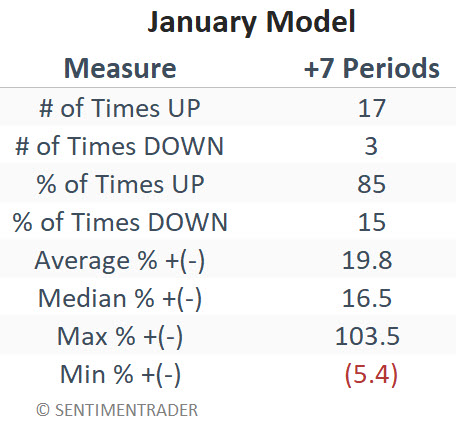
The table below displays S&P 500 results during the previous +7 periods.
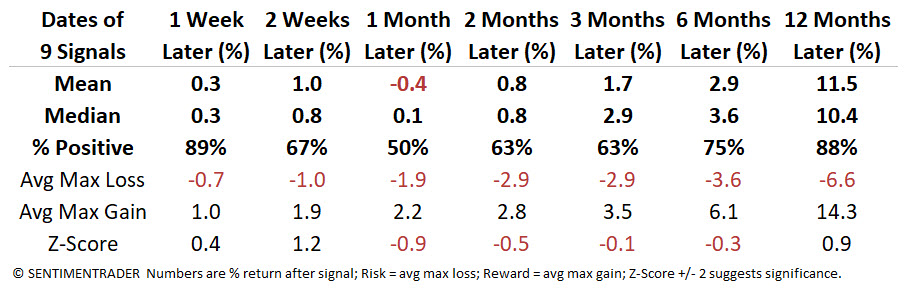
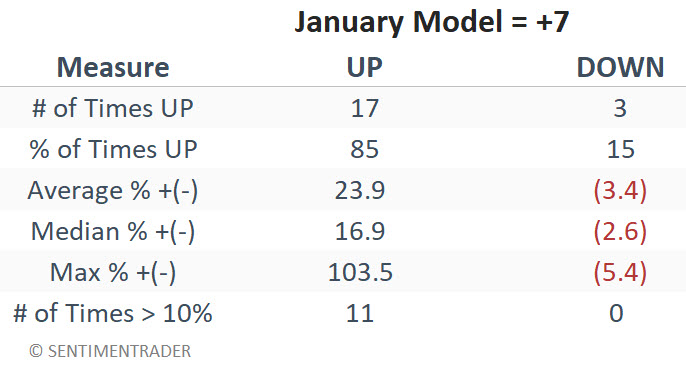
The table below summarizes S&P 500 results for all +7 periods.
The table below looks separately at winning and losing +7 periods.
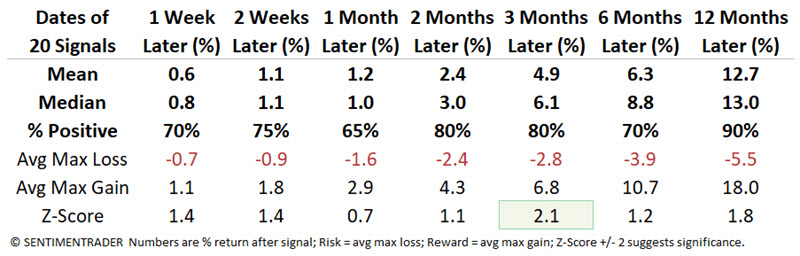
Finally, the table below summarizes first-year results following each new +7 reading.
What the research tells us...
The January Model is on a Buy Signal through at least the end of January 2026. Likewise, the model will be at a reading of +6 through at least the first five trading days of 2026. Higher stock prices have typically followed +6 readings from the model in the year ahead. However, as with any indicator or model, there are no guarantees, and the current favorable reading should be viewed as "weight of the evidence" and not as a standalone trading model nor as a signal of "smooth sailing" ahead.