
Do rising rates matter for stocks? Part II

Key points:
- Rising interest rates can be a negative for stocks in the long run
- In the short-term, stock market results can vary significantly during periods of rising interest rates
- Combining the trend in interest rates with a simple stock market filter can help avert unfavorable stock market returns
Measuring interest rates and stock prices
As in Part I, to designate the current trend for interest rates, we will track a 7-month exponential moving average of month-end 10-year treasury yields. For this test:
- The interest rate trend is favorable if the current 10-year yield is below the 7-month EMA
- The interest rate trend is unfavorable if the current 10-year yield is above the 7-month EMA
We will also use the monthly closing price for the Dow Jones Industrials Average since 1900. For this test, we will also compare the Dow at the end of each month to its 10-month moving average.
- The stock market trend is favorable if the Dow closes a month above its 10-month moving average
- The stock market trend is unfavorable if the Dow closes a month below its 10-month moving average
Now let's combine the stock market and interest rate trends to build a simple model. There are only two rules:
- If the stock market trend OR the interest rate trend is favorable, we will call that Risk-on
- If the stock market trend AND the interest rate trend are both unfavorable, we will call that Risk-off
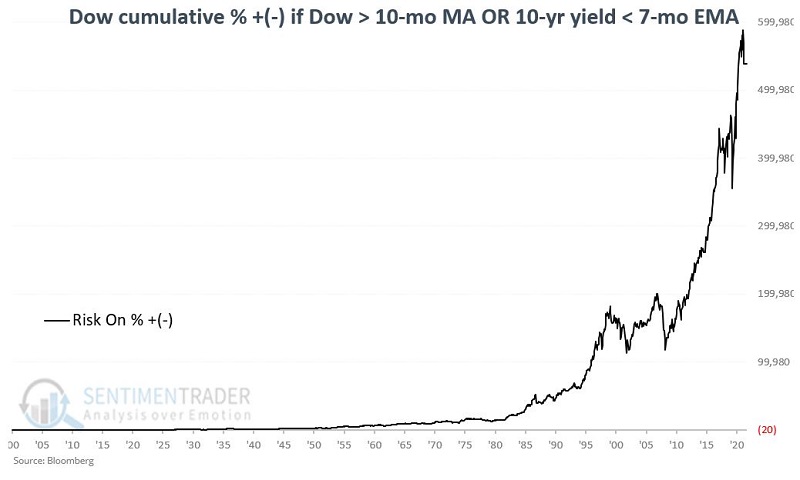
Risk-on environments showed massive gains
The chart below shows the cumulative price return for the Dow if held only when either the stock market trend or the interest rate trend is favorable. The cumulative return since 1900 is +538,304%.
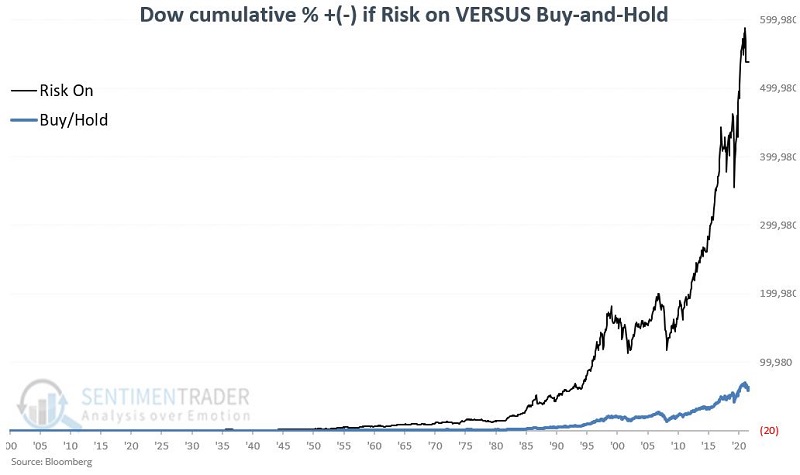
The chart below compares this return (black line) to the cumulative buy-and-hold return of +60,731%.
Risk-off environments suffered persistent losses
The chart below displays the cumulative price return for the Dow if held only when both the stock market and the interest rate trends are unfavorable. The cumulative return over the past 122 years is a decline of -89%.
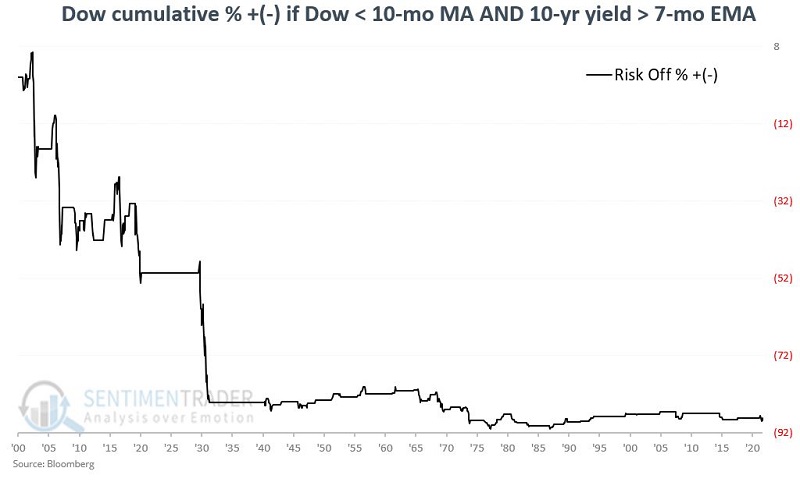
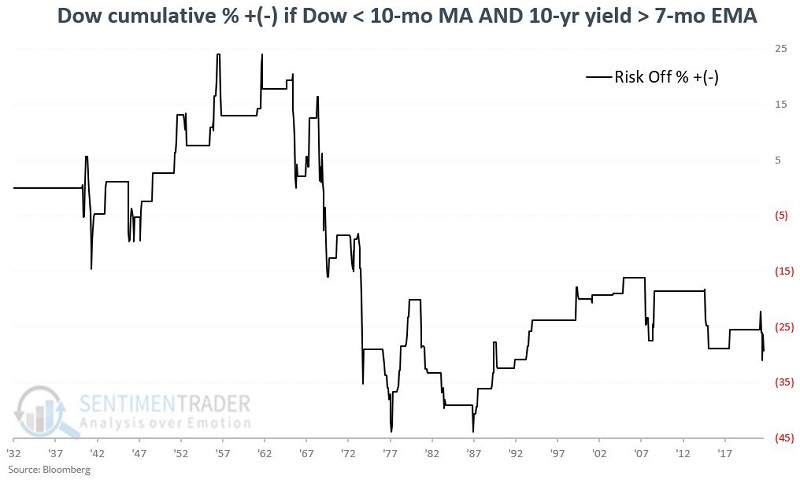
The results in the chart above reveal that the bulk of the damage occurred way back in the 1930s. The chart below shows the cumulative return starting in 1933. Even since then, the cumulative return during Risk-off periods is -29% versus +74,322% during Risk-on periods (not shown).
The table below summarizes the performance of the Dow during Risk-off periods since 1900.
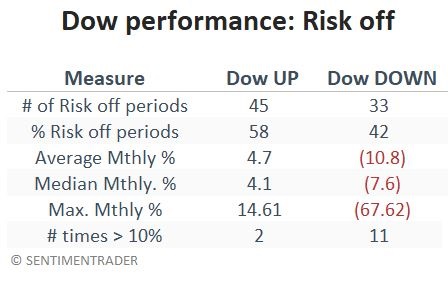
This Risk-on/Risk-off model is susceptible to whipsaws because 58% of the Risk-off periods saw the Dow register a price gain. Nevertheless, there is a propensity for significant declines during Risk-off periods, with eleven declines greater than -10% versus only two advances over +10%.
At the end of August 2022, the Dow was below its 10-month moving average, and the 10-year yield was above its 7-month EMA. Thus, this simple model is currently deemed as Risk-off. Barring a significant turn of events between now and the end of September, the model will remain in Risk-off mode in October.
What the research tells us…
In the early 1980s, Marty Zweig coined the phrases "don't fight the trend" and "don't fight the Fed." This simple Risk-on/Risk-off model somewhat crudely encompasses both adages. When the Dow drops below its 10-month moving average, it is reasonable to deem the trend unfavorable. Likewise, if interest rates are rising in the modern era, it is almost invariably a byproduct of Fed action. The model above cannot be categorized as precision market timing. Still, a simple once-a-month model that avoided declines of -88% over the past 120 years may have some value to longer-term investors.