Products
SentimenTrader Trading Tools
‍
Backtest Engine
My Trading Toolkit
Correlation Analysis
Seasonality
Market Prediction
Indicators & Data API
‍
Proprietary Indicators & Charts
Market Data API
Strategies & Scanner
‍
50+ Trading Strategies
Smart Stock Scanner
Smart Option Scanner
Research Reports
‍
Research Solutions
Reports Library
Free Resources
Simple Backtest Calculator
Simple Seasonality Calculator
The Kelly Criterion Calculator
Sentiment Geo Map
Public Research Reports
Education
Sentiment Indicators
Technical Indicators
Pricing
Company
About
In the News
Testimonials
Client Success Stories
Contact
Log inLoginSign up
< BACK TO ALL REPORTS

Do rising interest rates matter for stocks?

Jay Kaeppel
2022-09-26
The long-held theory is that falling interest rates benefit stocks, and rising rates do not. The historical record proves that out, with the Dow Industrials performing much better when the trend in rates is down.

Key points:

  • Interest rates are in a rising trend
  • Stocks can advance during rising rate periods and decline during falling rate periods
  • However, DJIA performance has been vastly better when interest rates are falling than when rising

Measuring interest rates and stock prices

Interest rates are stuck in a solid uptrend, and that has meant headwinds for stocks.

To create the most extended test possible, we will use the monthly closing price for the Dow Jones Industrials Average (DJIA) and month-end yield data for the 10-year treasury note beginning in 1901. 

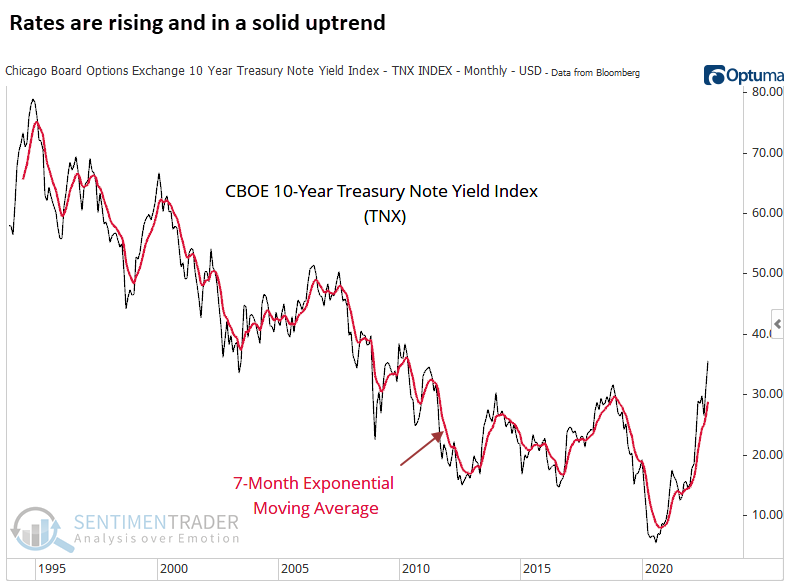
To designate the current trend for interest rates, we will track a 7-month exponential moving average of month-end 10-year treasury yields. 

  • If the current 10-year yield is below the 7-month EMA, the interest rate trend is falling
  • If the current 10-year yield is above the 7-month EMA, the interest rate trend is rising

The chart below shows a monthly chart for the CBOE 10-Year US Treasury Index (TNX) along with its 7-month EMA (red line).

Dow performance during falling rates versus rising rates

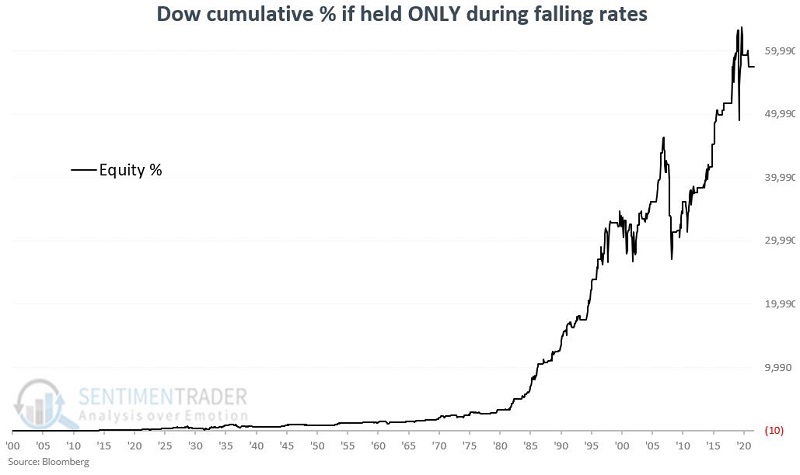
The chart below displays the cumulative price performance for the DJIA if held only when the 10-year yield was below its 7-month EMA at the end of the previous month. The cumulative return since 1900 is +57,582%.

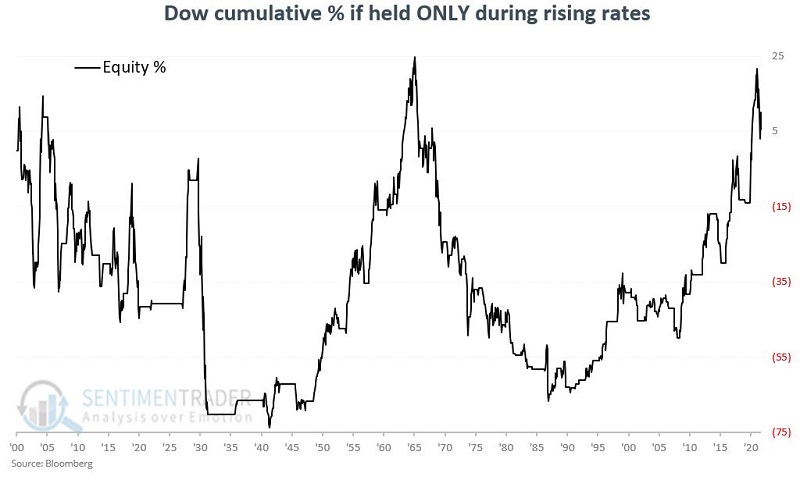
To put this performance into perspective, the chart below displays the cumulative price performance if held only when the 10-year yield was above its 7-month EMA at the end of the previous month. The cumulative return since 1900 is only +5.6% - barely breakeven.

The table below summarizes monthly performance data for the Dow based on whether interest rates were falling or rising at the end of the previous month.

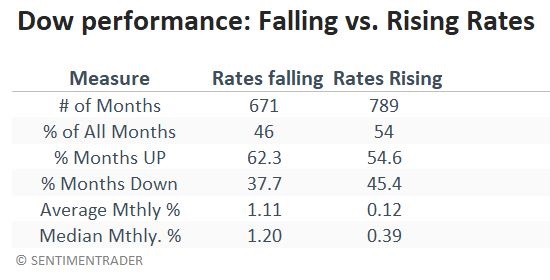
Rates were falling only 46% of the time but the percentage return in the DJIA during those months accounted for nearly all of the gains over the whole study period. The percentage of months that showed a gain was significantly higher when rates were falling, and the average monthly return was considerably higher as well.

What the research tells us…

The good news is that we can state with certainty that falling interest rates are much more favorable for stocks in the long run than rising interest rates. The caveat is that this information should likely not be used as a standalone model.

The charts above showed several instances when stocks declined sharply even while interest rates were falling. Likewise, the Dow staged significant multi-year rallies during the 1950s, 1990, and post-Great Financial Crisis, even when rates were rising. Nevertheless, as a weight-of-the-evidence indicator, the current rising rate environment falls squarely on the unfavorable side of the ledger.

PRODUCTS
SentimenTrader
Trading Tools
Indicators & Data API
‍
Strategies & Scanner
‍
Research Reports
FREE
RESOUrCES
Simple Backtest
Calculator
Simple Seasonality
Calculator
The Kelly Criterion
Calculator
Sentiment Geo Map
‍
Public Research Reports
‍
Education
Sentiment Indicators
‍
Technical Indicators
‍
Pricing
Bundle pricing
‍
FAQ
‍
Announcements
‍
COMPANY
‍
About
‍
In the News
‍
Testimonials
‍
Client Success Stories
CONTACT
‍
General Inquiries
‍
Media Inquiries
‍
Financial Professionals Inquiries
‍
© 2026 Sundial Capital Research Inc. All rights reserved.
Setsail Marketing
TermsPrivacyAffiliate Program
Risk Disclosure: The information and tools provided are for research and analytical purposes only and are not intended as investment advice. Market analysis involves uncertainty, and outcomes may differ from expectations. Users should conduct their own due diligence and consider their individual circumstances before making any financial decisions. Past performance is not necessarily indicative of future results.

Hypothetical Performance Disclosure: Hypothetical performance results have many inherent limitations, some of which are described below. No representation is being made that any account will or is likely to achieve profits or losses similar to those shown; in fact, there are frequently sharp differences between hypothetical performance results and the actual results subsequently achieved by any particular trading program. One of the limitations of hypothetical performance results is that they are generally prepared with the benefit of hindsight. In addition, hypothetical trading does not involve financial risk, and no hypothetical trading record can completely account for the impact of financial risk of actual trading. for example, the ability to withstand losses or to adhere to a particular trading program in spite of trading losses are material points which can also adversely affect actual trading results. There are numerous other factors related to the markets in general or to the implementation of any specific trading program which cannot be fully accounted for in the preparation of hypothetical performance results and all which can adversely affect trading results.

Testimonial Disclosure: Testimonials appearing on this website may not be representative of other clients or customers and is not a guarantee of future performance or success.