Products
SentimenTrader Trading Tools
‍
Backtest Engine
My Trading Toolkit
Correlation Analysis
Seasonality
Market Prediction
Indicators & Data API
‍
Proprietary Indicators & Charts
Market Data API
Strategies & Scanner
‍
50+ Trading Strategies
Smart Stock Scanner
Smart Option Scanner
Research Reports
‍
Research Solutions
Reports Library
Free Resources
Simple Backtest Calculator
Simple Seasonality Calculator
The Kelly Criterion Calculator
Sentiment Geo Map
Public Research Reports
Education
Sentiment Indicators
Technical Indicators
Pricing
Company
About
In the News
Testimonials
Client Success Stories
Contact
Log inLoginSign up
< BACK TO ALL REPORTS

Divergences among indices have been brewing for weeks

Jason Goepfert
2025-03-05
Stocks have pulled back in recent weeks, which is in keeping with trouble signs with the S&P 500's last 52-week high. At the time, it was disguising many divergences across the market, such as in the advance/decline line, small cap stocks, and other Dow indices. Similar extended divergences tended to precede months of weak action.

Key points:

  • When the S&P 500 made its last 52-week high, it was disguising significant deterioration
  • Many stocks and indices, covering a broad cross-section of the market, were failing to keep up
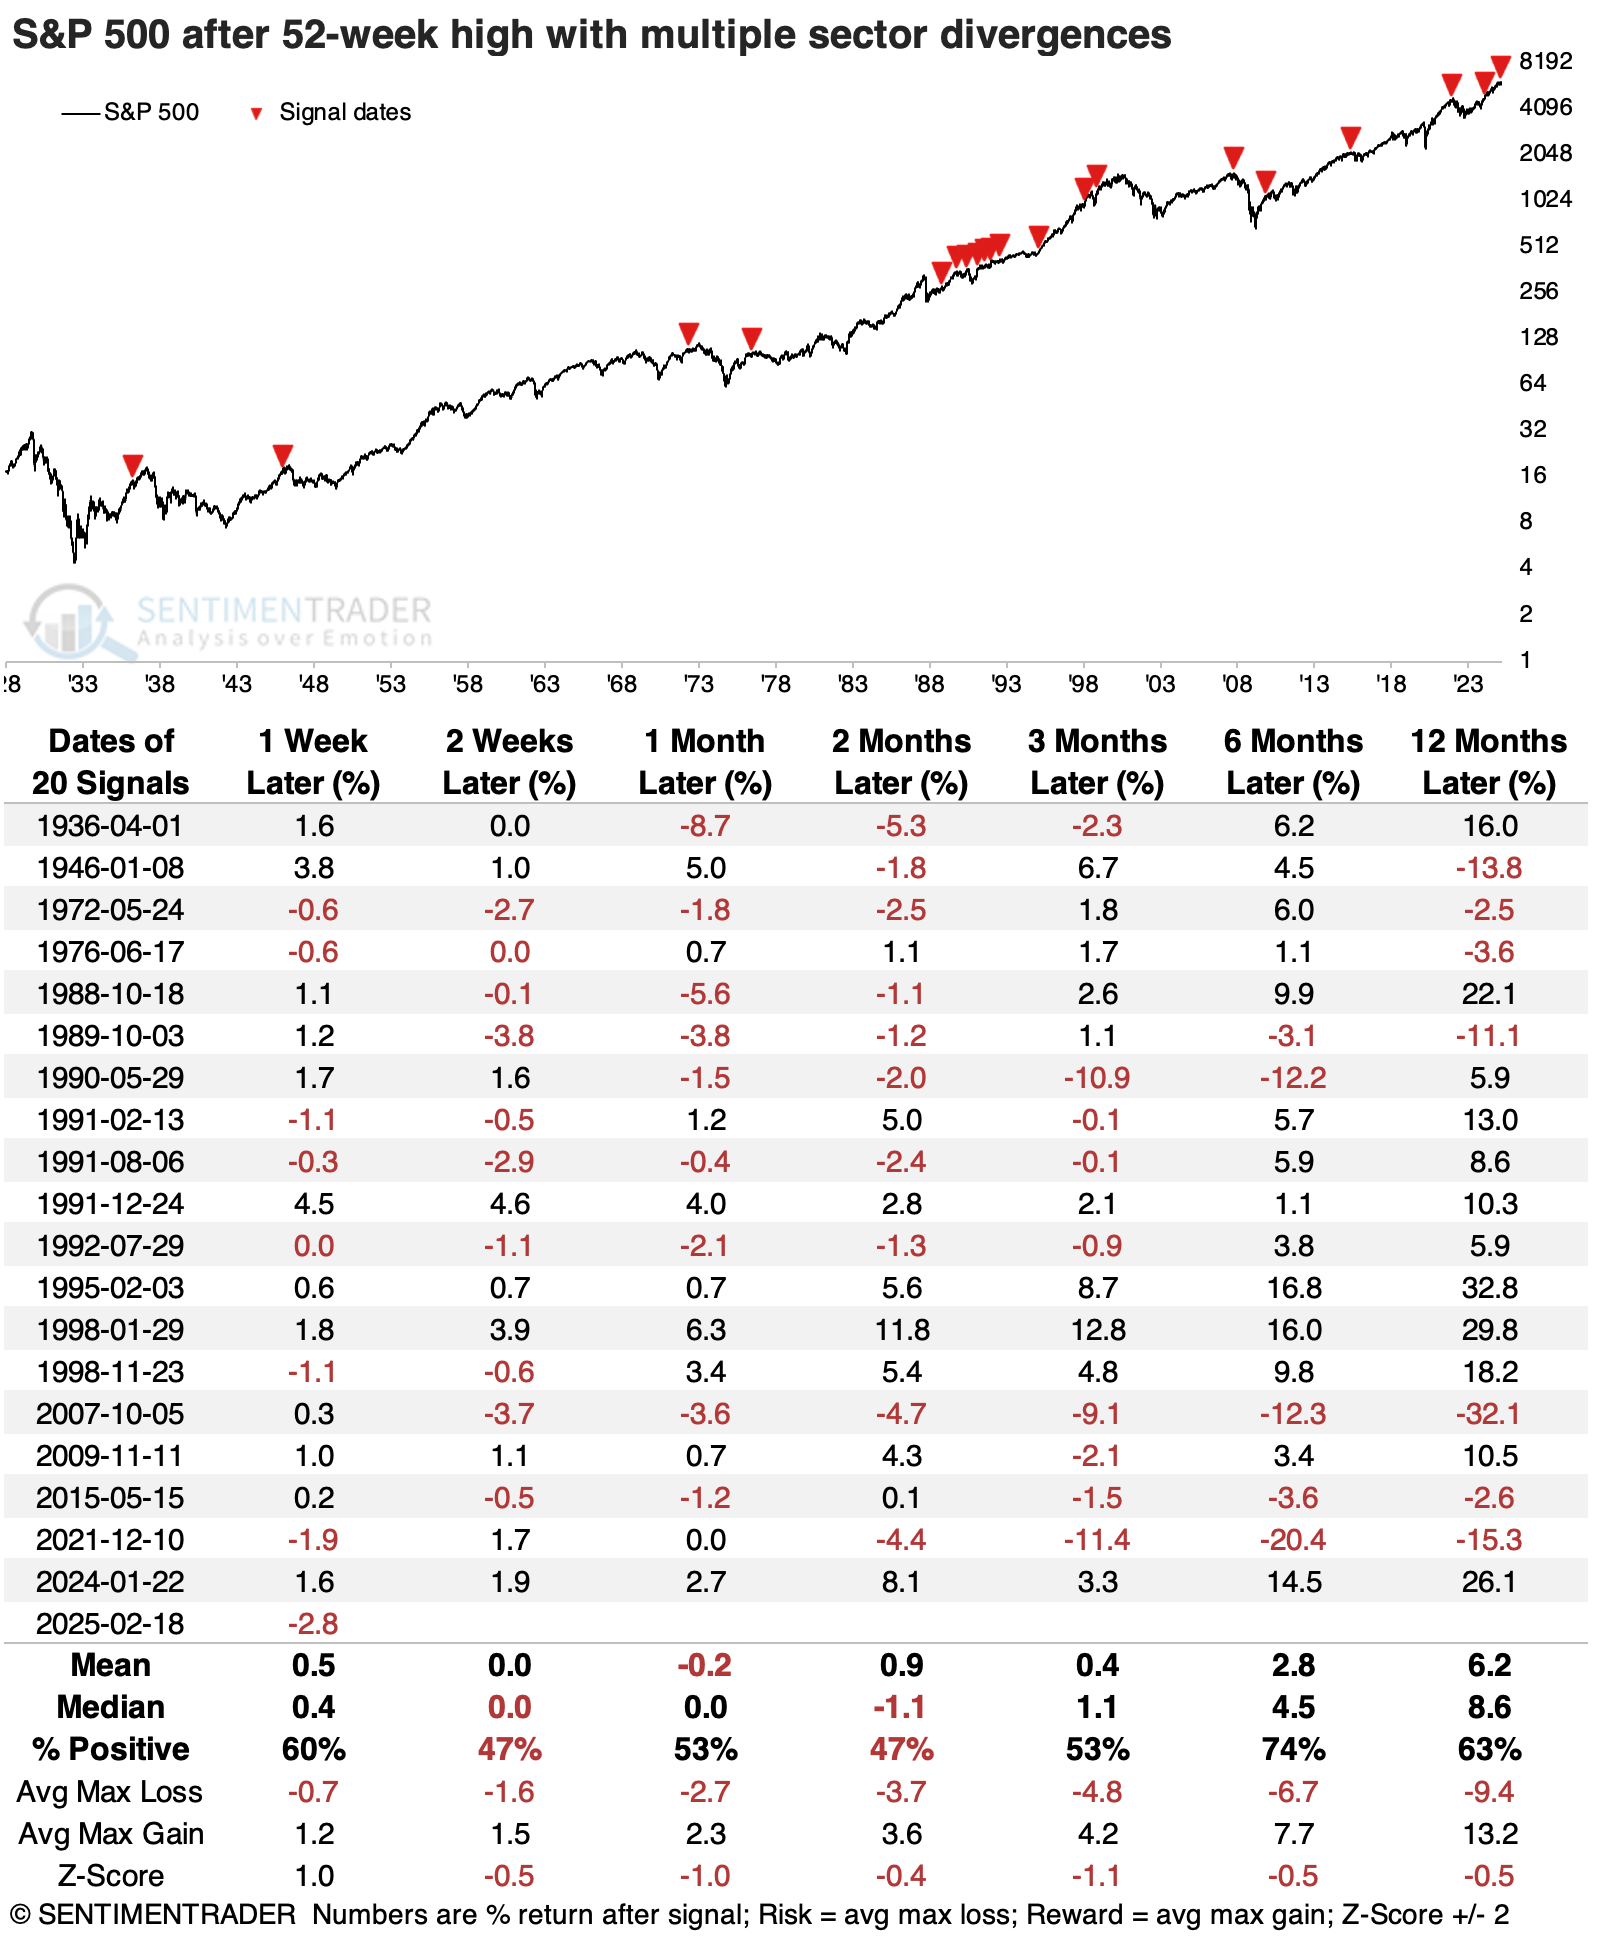
  • Similar divergences since 1928 have preceded mostly weak returns over medium time frames

The S&P 500 has been hiding a lot

We've noted multiple times in recent weeks (and even months) that under the surface of the market - mostly meaning the S&P 500 - there have been some issues with participation among stocks or entire sectors.

The fine folks at Leuthold Group noted something related when the S&P 500 made its last push to new highs in February.

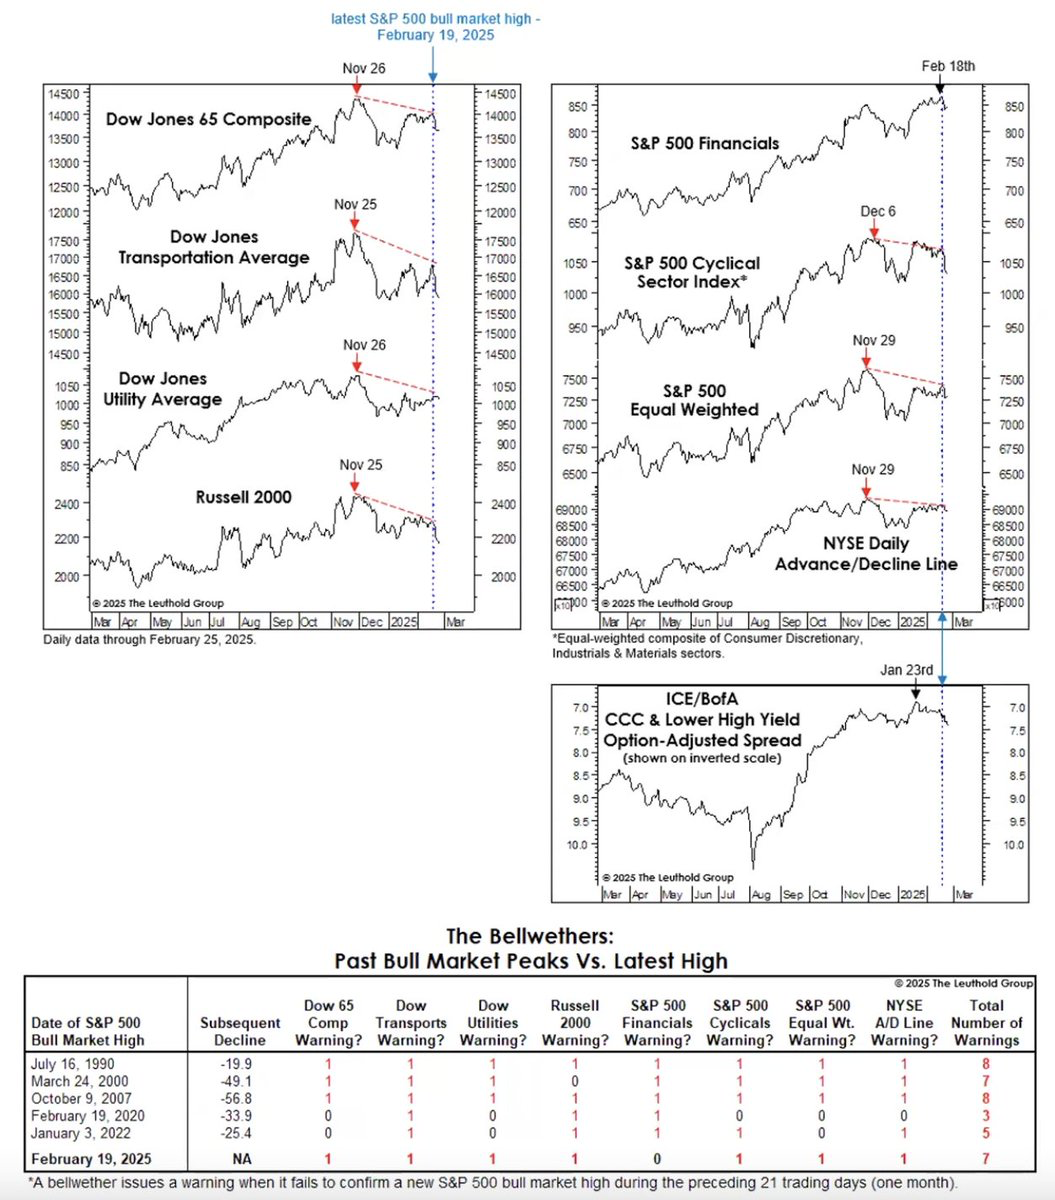
We've been asked how reliable a signal this has been. We don't have the same or as extensive a data set as Leuthold. However, we can approximate some of the indices with the most history and look for times there were extended divergences from them on any day the S&P 500 made a 52-week high.

The indices we will use below clearly show their deterioration even as the S&P pushed higher into late February.

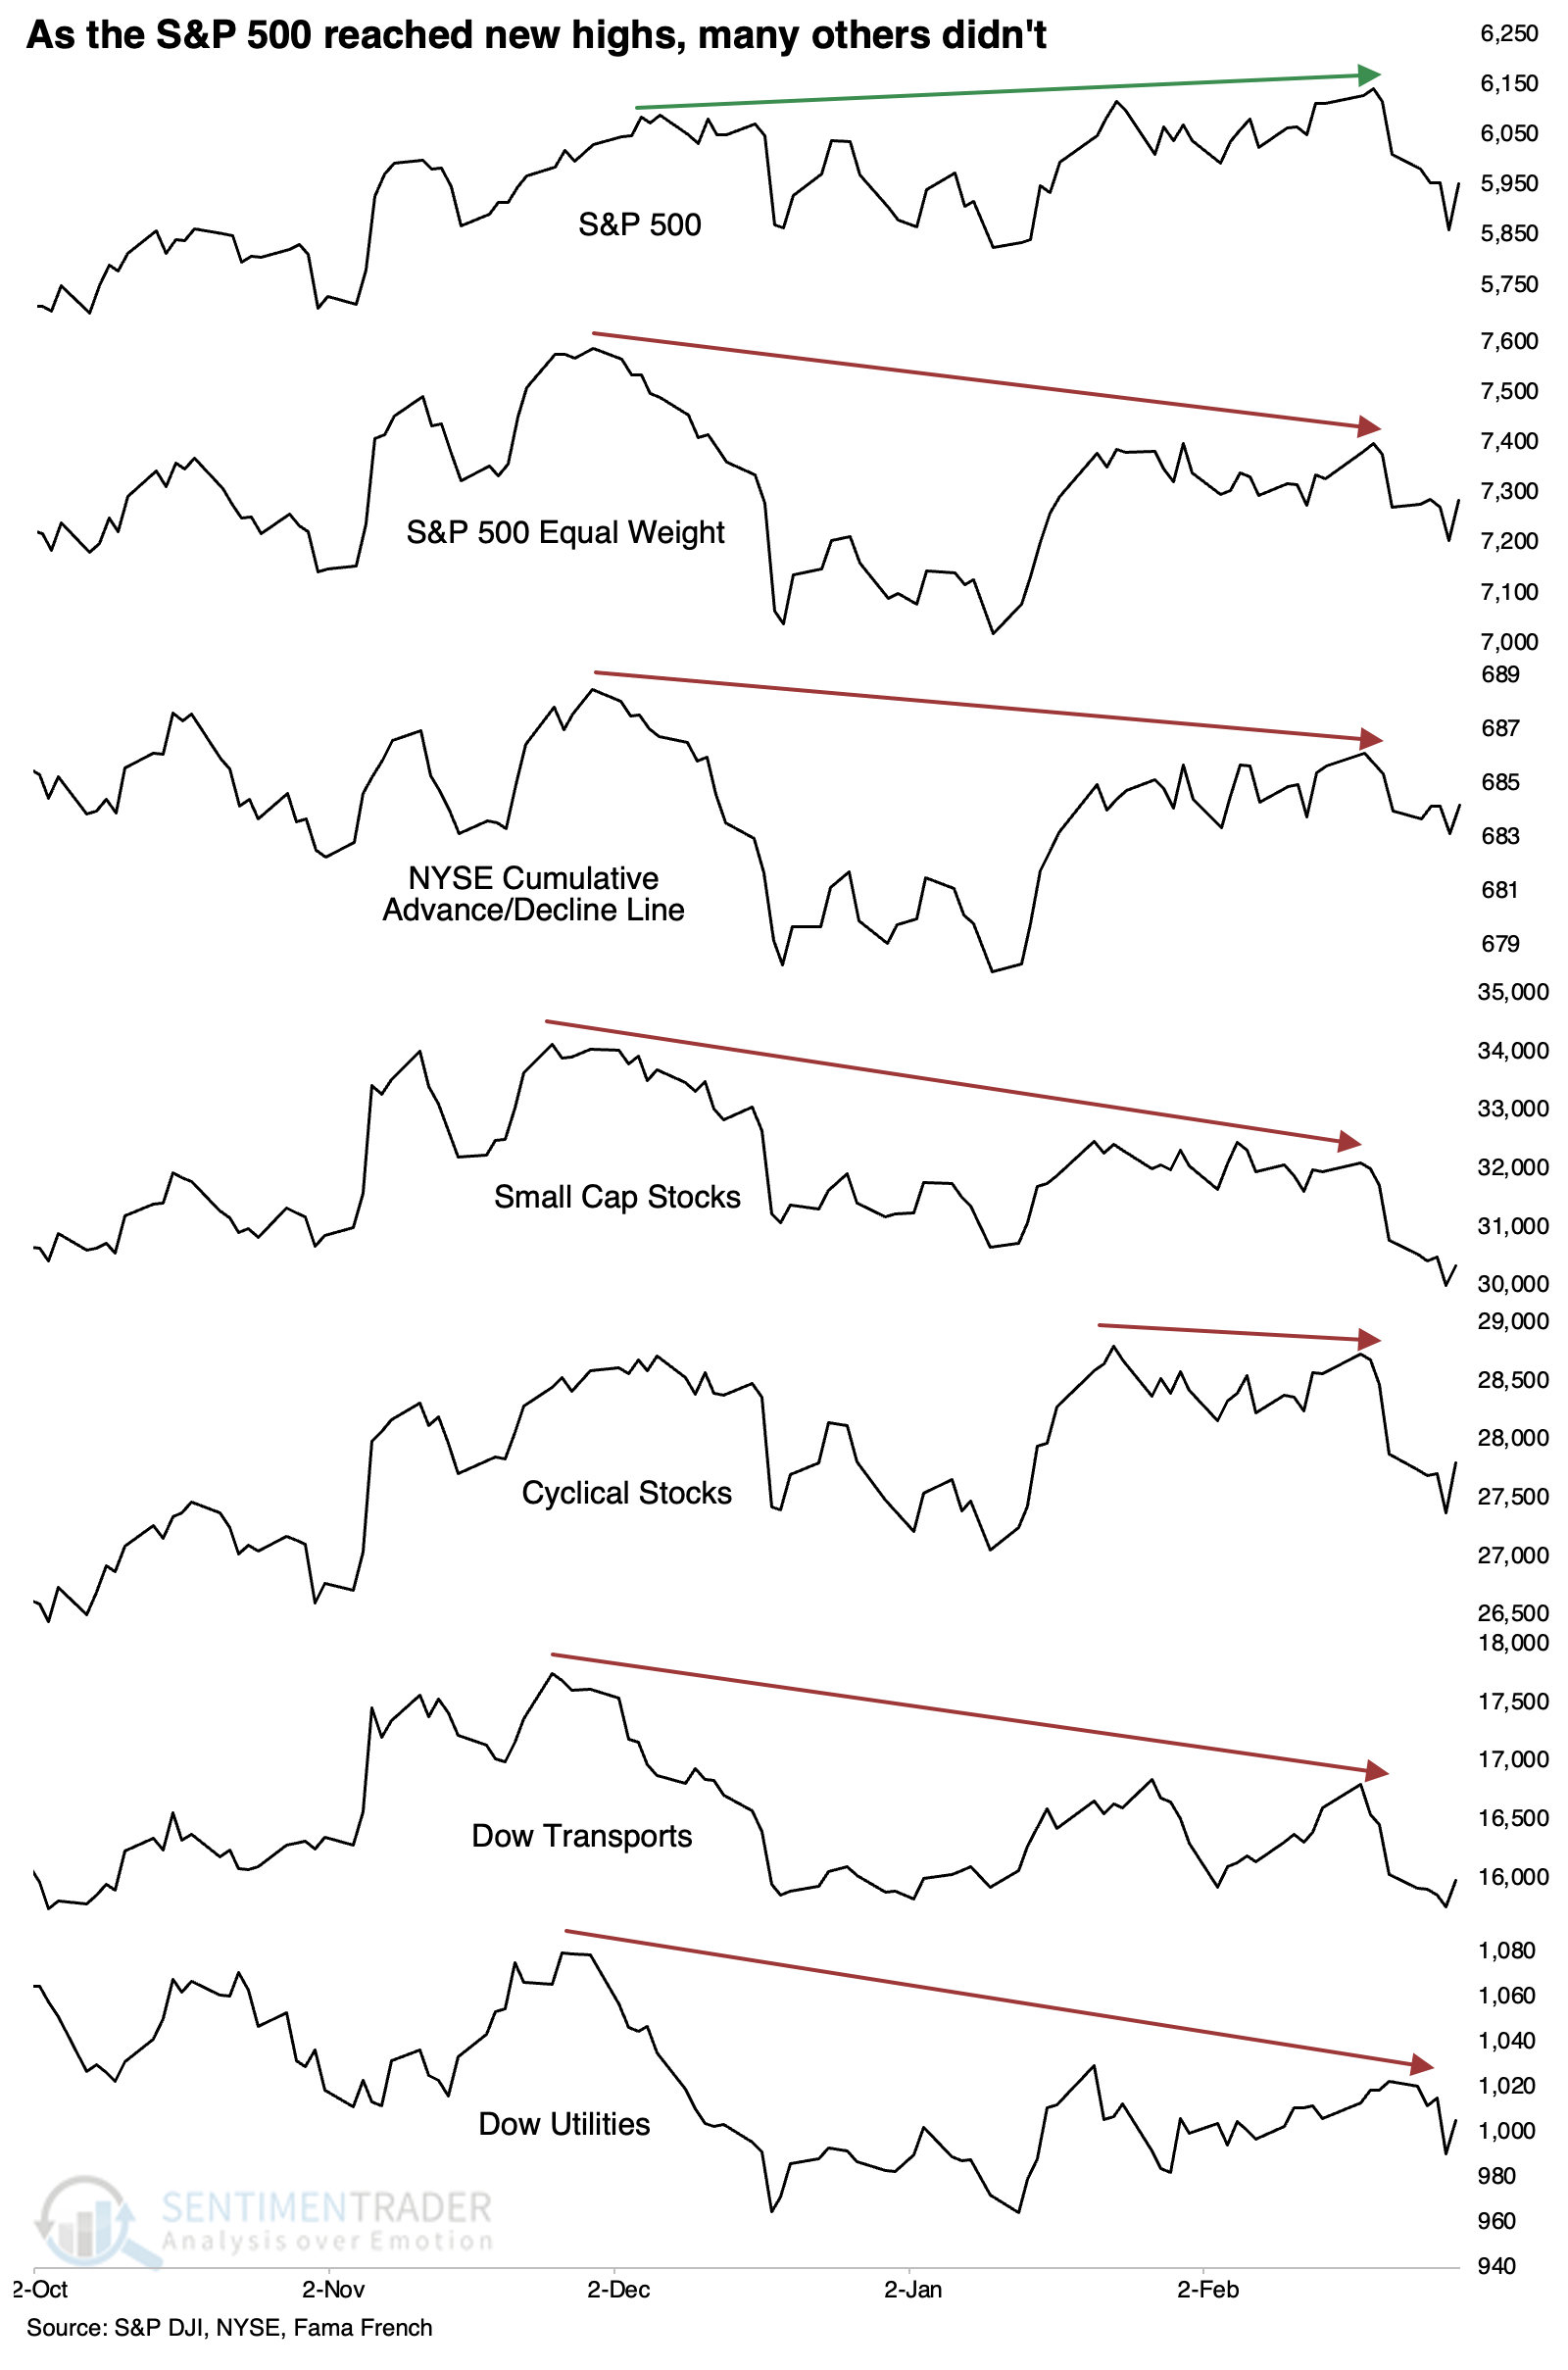
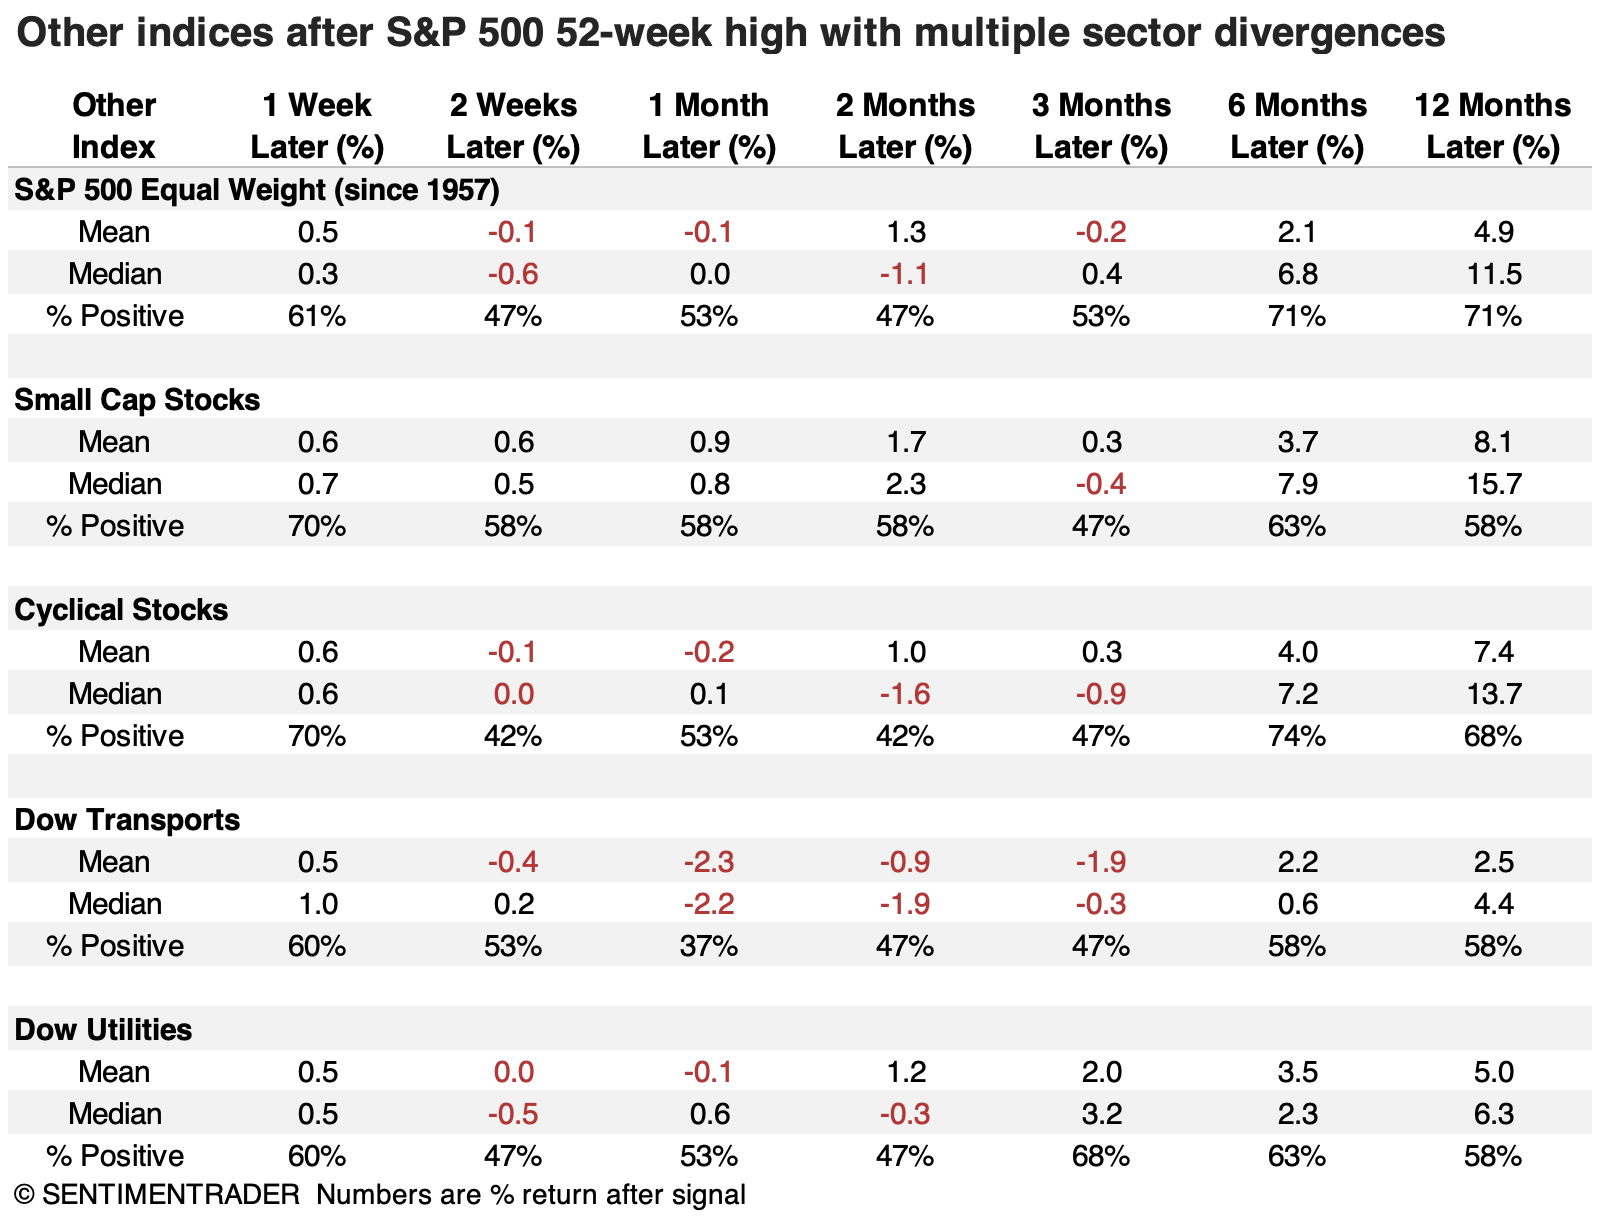
The table below shows all dates when the S&P was at a 52-week high, but each of the indices above hadn't set a 52-week high for at least the prior three weeks.

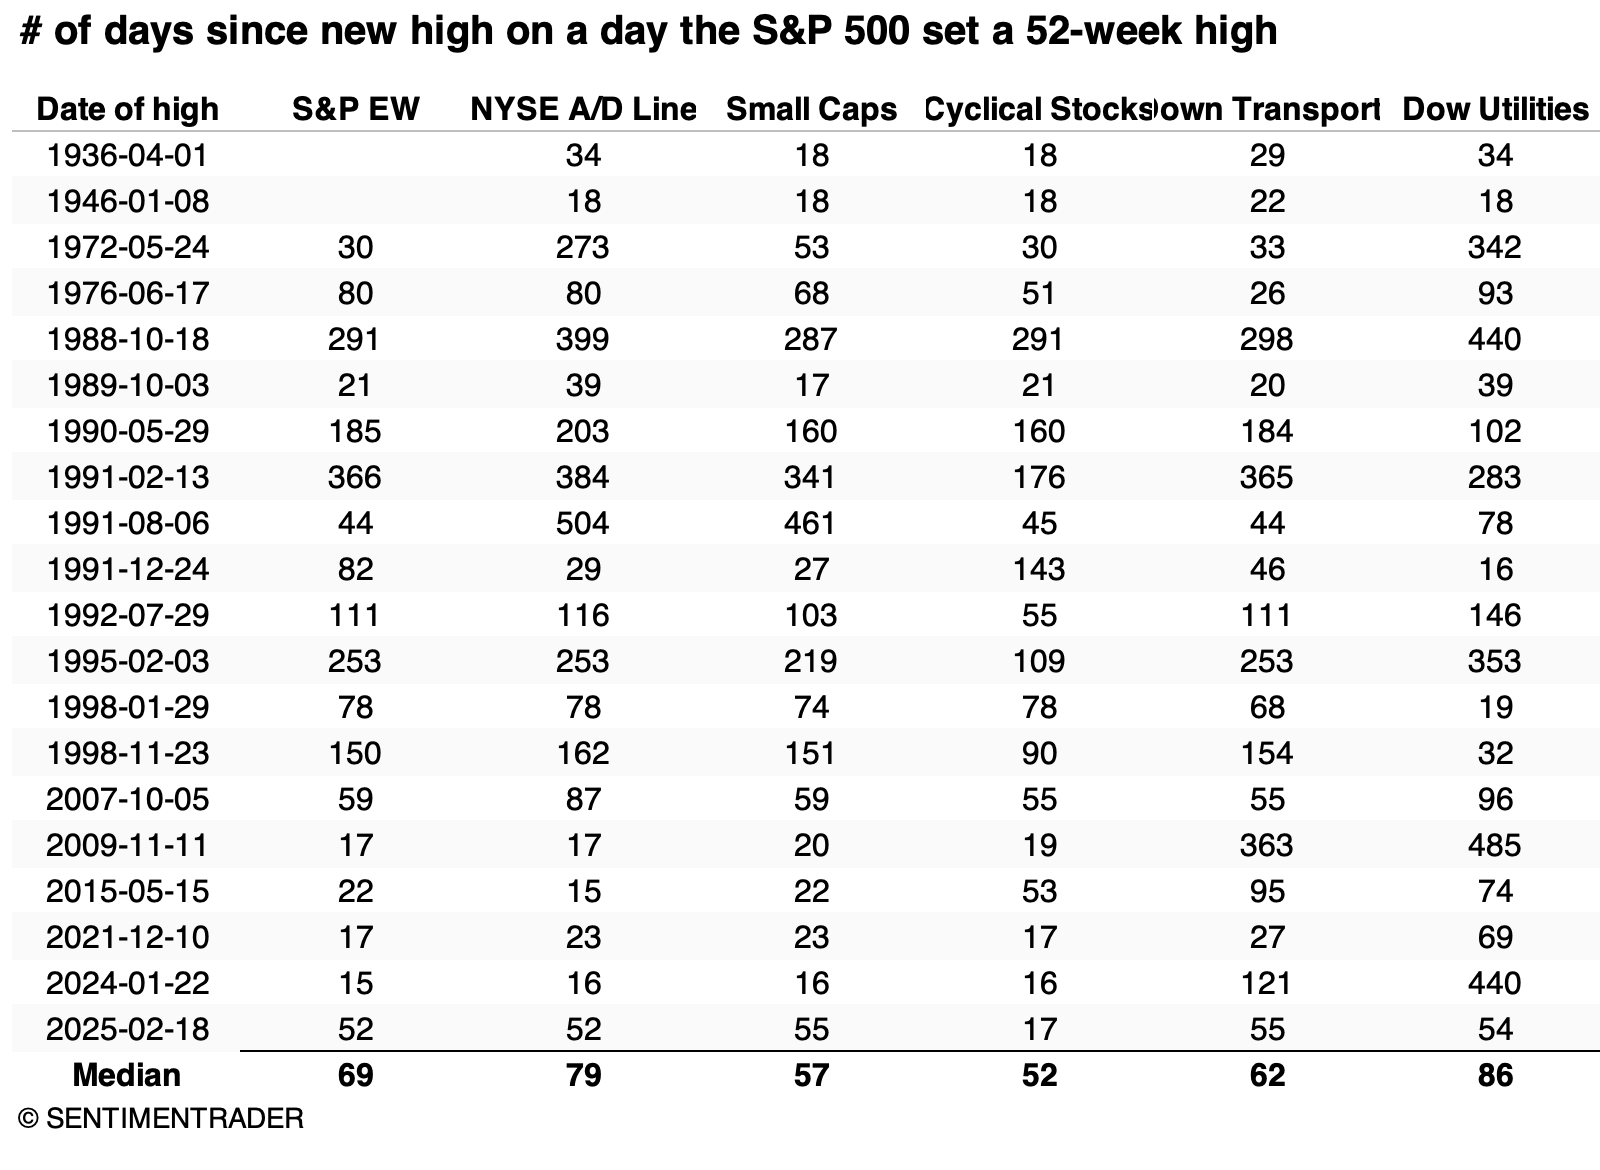
This was a rare and bad omen before the 1990s, with each signal preceding little upside in the S&P 500 in the months ahead. It was triggered multiple times in the early 1990s, again mostly preceding weak returns for months afterward. The late 1990s signals preceded the last gasp of the internet bubble. Since then, returns have been weak again, with the only real exception being one from about a year ago. It should be noted that that exception from 2024 met the criteria of this test, but the current divergence is significantly more extended than that one was.

The peak in 2020 did exhibit divergences in all of the indices we used. However, those divergences hadn't been as extended (lasting at least three weeks) as the one last month. The peak in 2000 came close, but cyclical stocks were an exception, briefly making a new high along with the S&P 500, so that instance didn't count in our study, either.

Another nod toward defensive stocks

Among the other indices, the Dow Transports suffered the worst returns in the months ahead, with cyclical stocks also struggling. None of them sported very good returns, really.

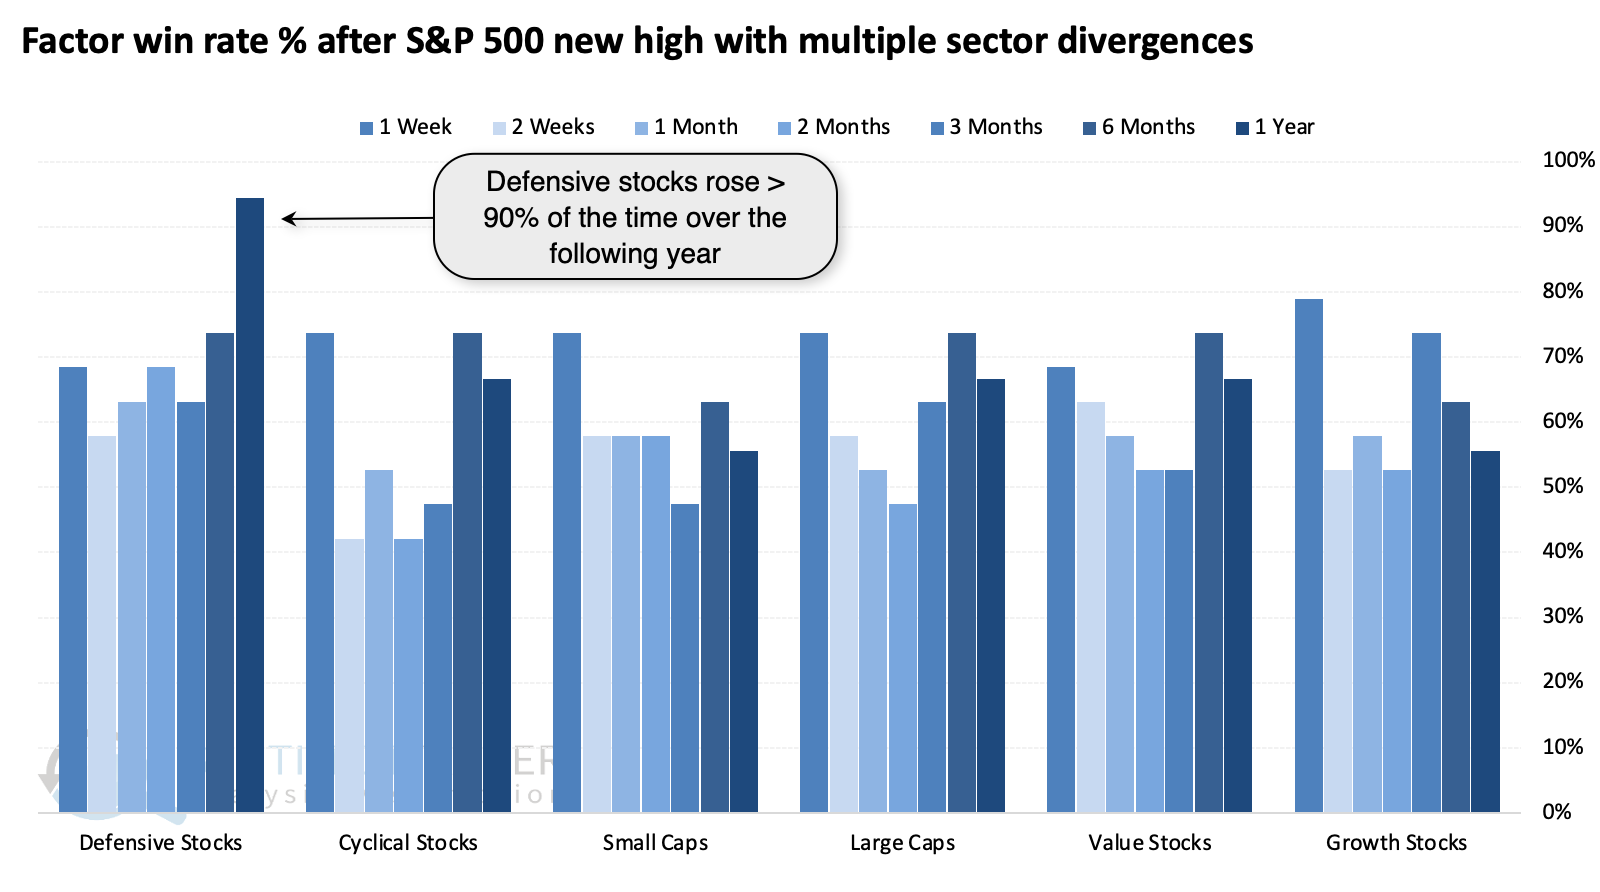
Looking at win rates across factors, defensive stocks were the most consistent winners, rising more than 90% of the time over the following year. Growth stocks were the least consistent, with barely a 55% win rate a year later.

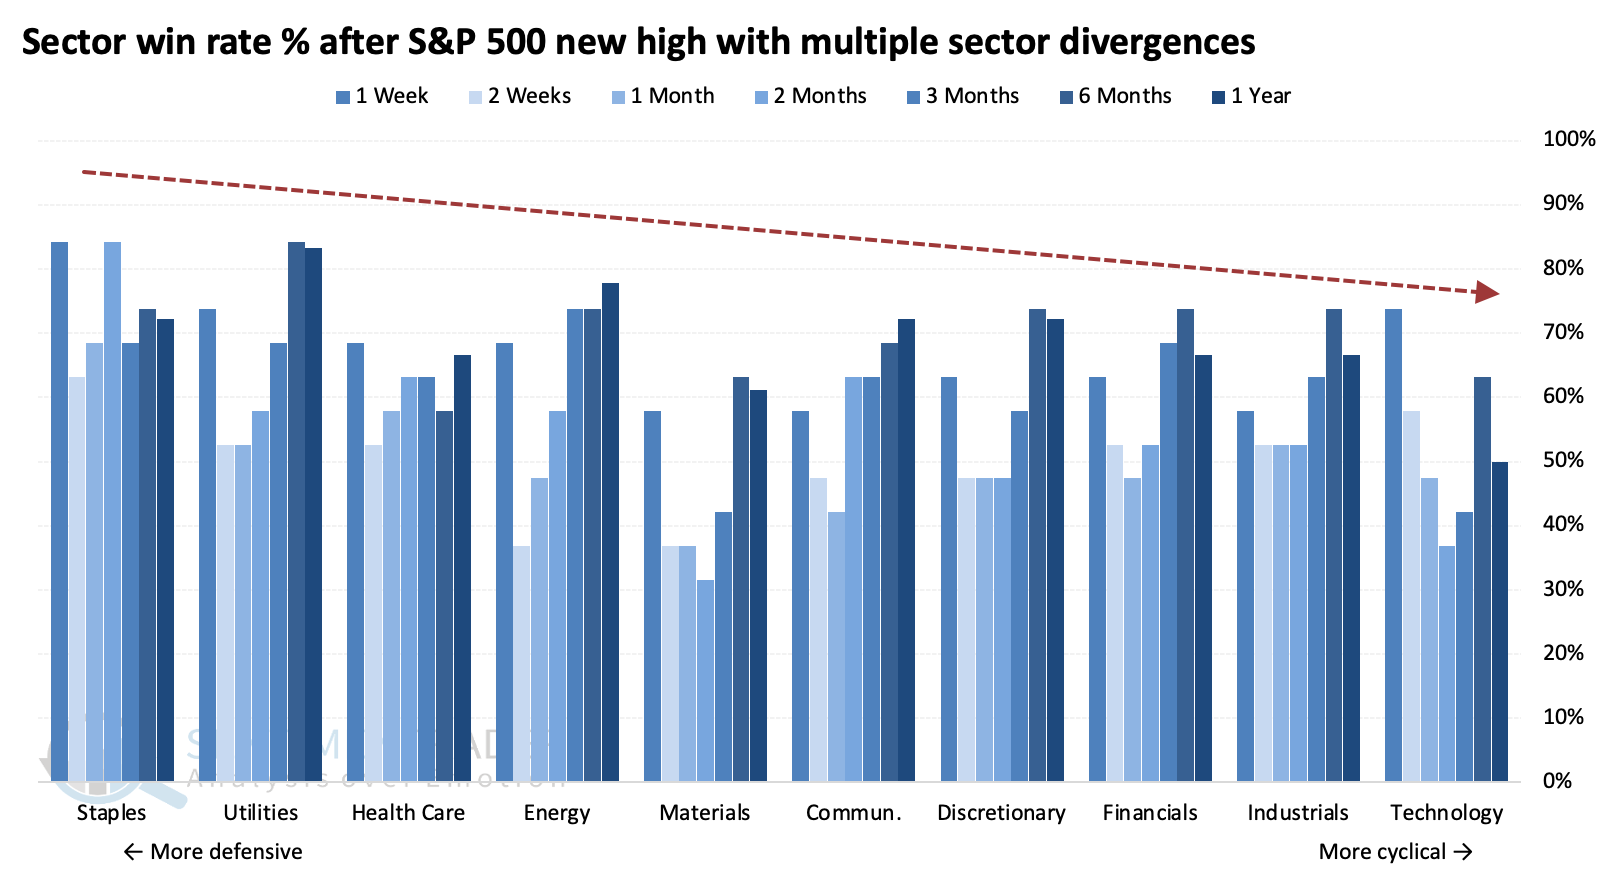
We can see this among sectors, as well. The most defensive sectors enjoyed the highest win rates; the most cyclical, the lowest.

What the research tells us...

Stocks have already pulled back a modest degree since the S&P 500's last high a couple of weeks ago. However, the divergences taking place at the time across a wide swath of the market are a sign of perhaps deeper issues than just a small hiccup in the uptrend.

There isn't enough evidence in the prior divergences noted above to suggest it's a raging sell signal for stocks. It is enough to suggest caution, especially over short to medium time frames, no longer than six months or so. This is another development that has shown an investor had better odds with defensive stocks as opposed to cyclical or growth.

PRODUCTS
SentimenTrader
Trading Tools
Indicators & Data API
‍
Strategies & Scanner
‍
Research Reports
FREE
RESOUrCES
Simple Backtest
Calculator
Simple Seasonality
Calculator
The Kelly Criterion
Calculator
Sentiment Geo Map
‍
Public Research Reports
‍
Education
Sentiment Indicators
‍
Technical Indicators
‍
Pricing
Bundle pricing
‍
FAQ
‍
Announcements
‍
COMPANY
‍
About
‍
In the News
‍
Testimonials
‍
Client Success Stories
CONTACT
‍
General Inquiries
‍
Media Inquiries
‍
Financial Professionals Inquiries
‍
© 2026 Sundial Capital Research Inc. All rights reserved.
Setsail Marketing
TermsPrivacyAffiliate Program
Risk Disclosure: The information and tools provided are for research and analytical purposes only and are not intended as investment advice. Market analysis involves uncertainty, and outcomes may differ from expectations. Users should conduct their own due diligence and consider their individual circumstances before making any financial decisions. Past performance is not necessarily indicative of future results.

Hypothetical Performance Disclosure: Hypothetical performance results have many inherent limitations, some of which are described below. No representation is being made that any account will or is likely to achieve profits or losses similar to those shown; in fact, there are frequently sharp differences between hypothetical performance results and the actual results subsequently achieved by any particular trading program. One of the limitations of hypothetical performance results is that they are generally prepared with the benefit of hindsight. In addition, hypothetical trading does not involve financial risk, and no hypothetical trading record can completely account for the impact of financial risk of actual trading. for example, the ability to withstand losses or to adhere to a particular trading program in spite of trading losses are material points which can also adversely affect actual trading results. There are numerous other factors related to the markets in general or to the implementation of any specific trading program which cannot be fully accounted for in the preparation of hypothetical performance results and all which can adversely affect trading results.

Testimonial Disclosure: Testimonials appearing on this website may not be representative of other clients or customers and is not a guarantee of future performance or success.