
Divergence Between Sentiment, Capital and Data

Key Points:
- The Equity Risk Premium, a measure of stocks' relative value compared to bonds, is in negative territory, yet the NAAIM Index stands at a lofty 98.
- The Soft Vs Hard Economic Surprises Index has fallen below -1.6.
- The University of Michigan Consumer Confidence Index has hit a three-year low.
Soft Vs Hard Economic Surprises
As the saying goes, "Confidence is more valuable than gold." We use the gap between the Soft Vs Hard Economic Surprises Index to quantify this disconnect-soft data reflects people's perceptions (surveys, confidence), while hard data represents actual economic output (employment, GDP). Recently, this indicator has fallen below -1.6, and the chart below shows market performance when the index hit this level historically.
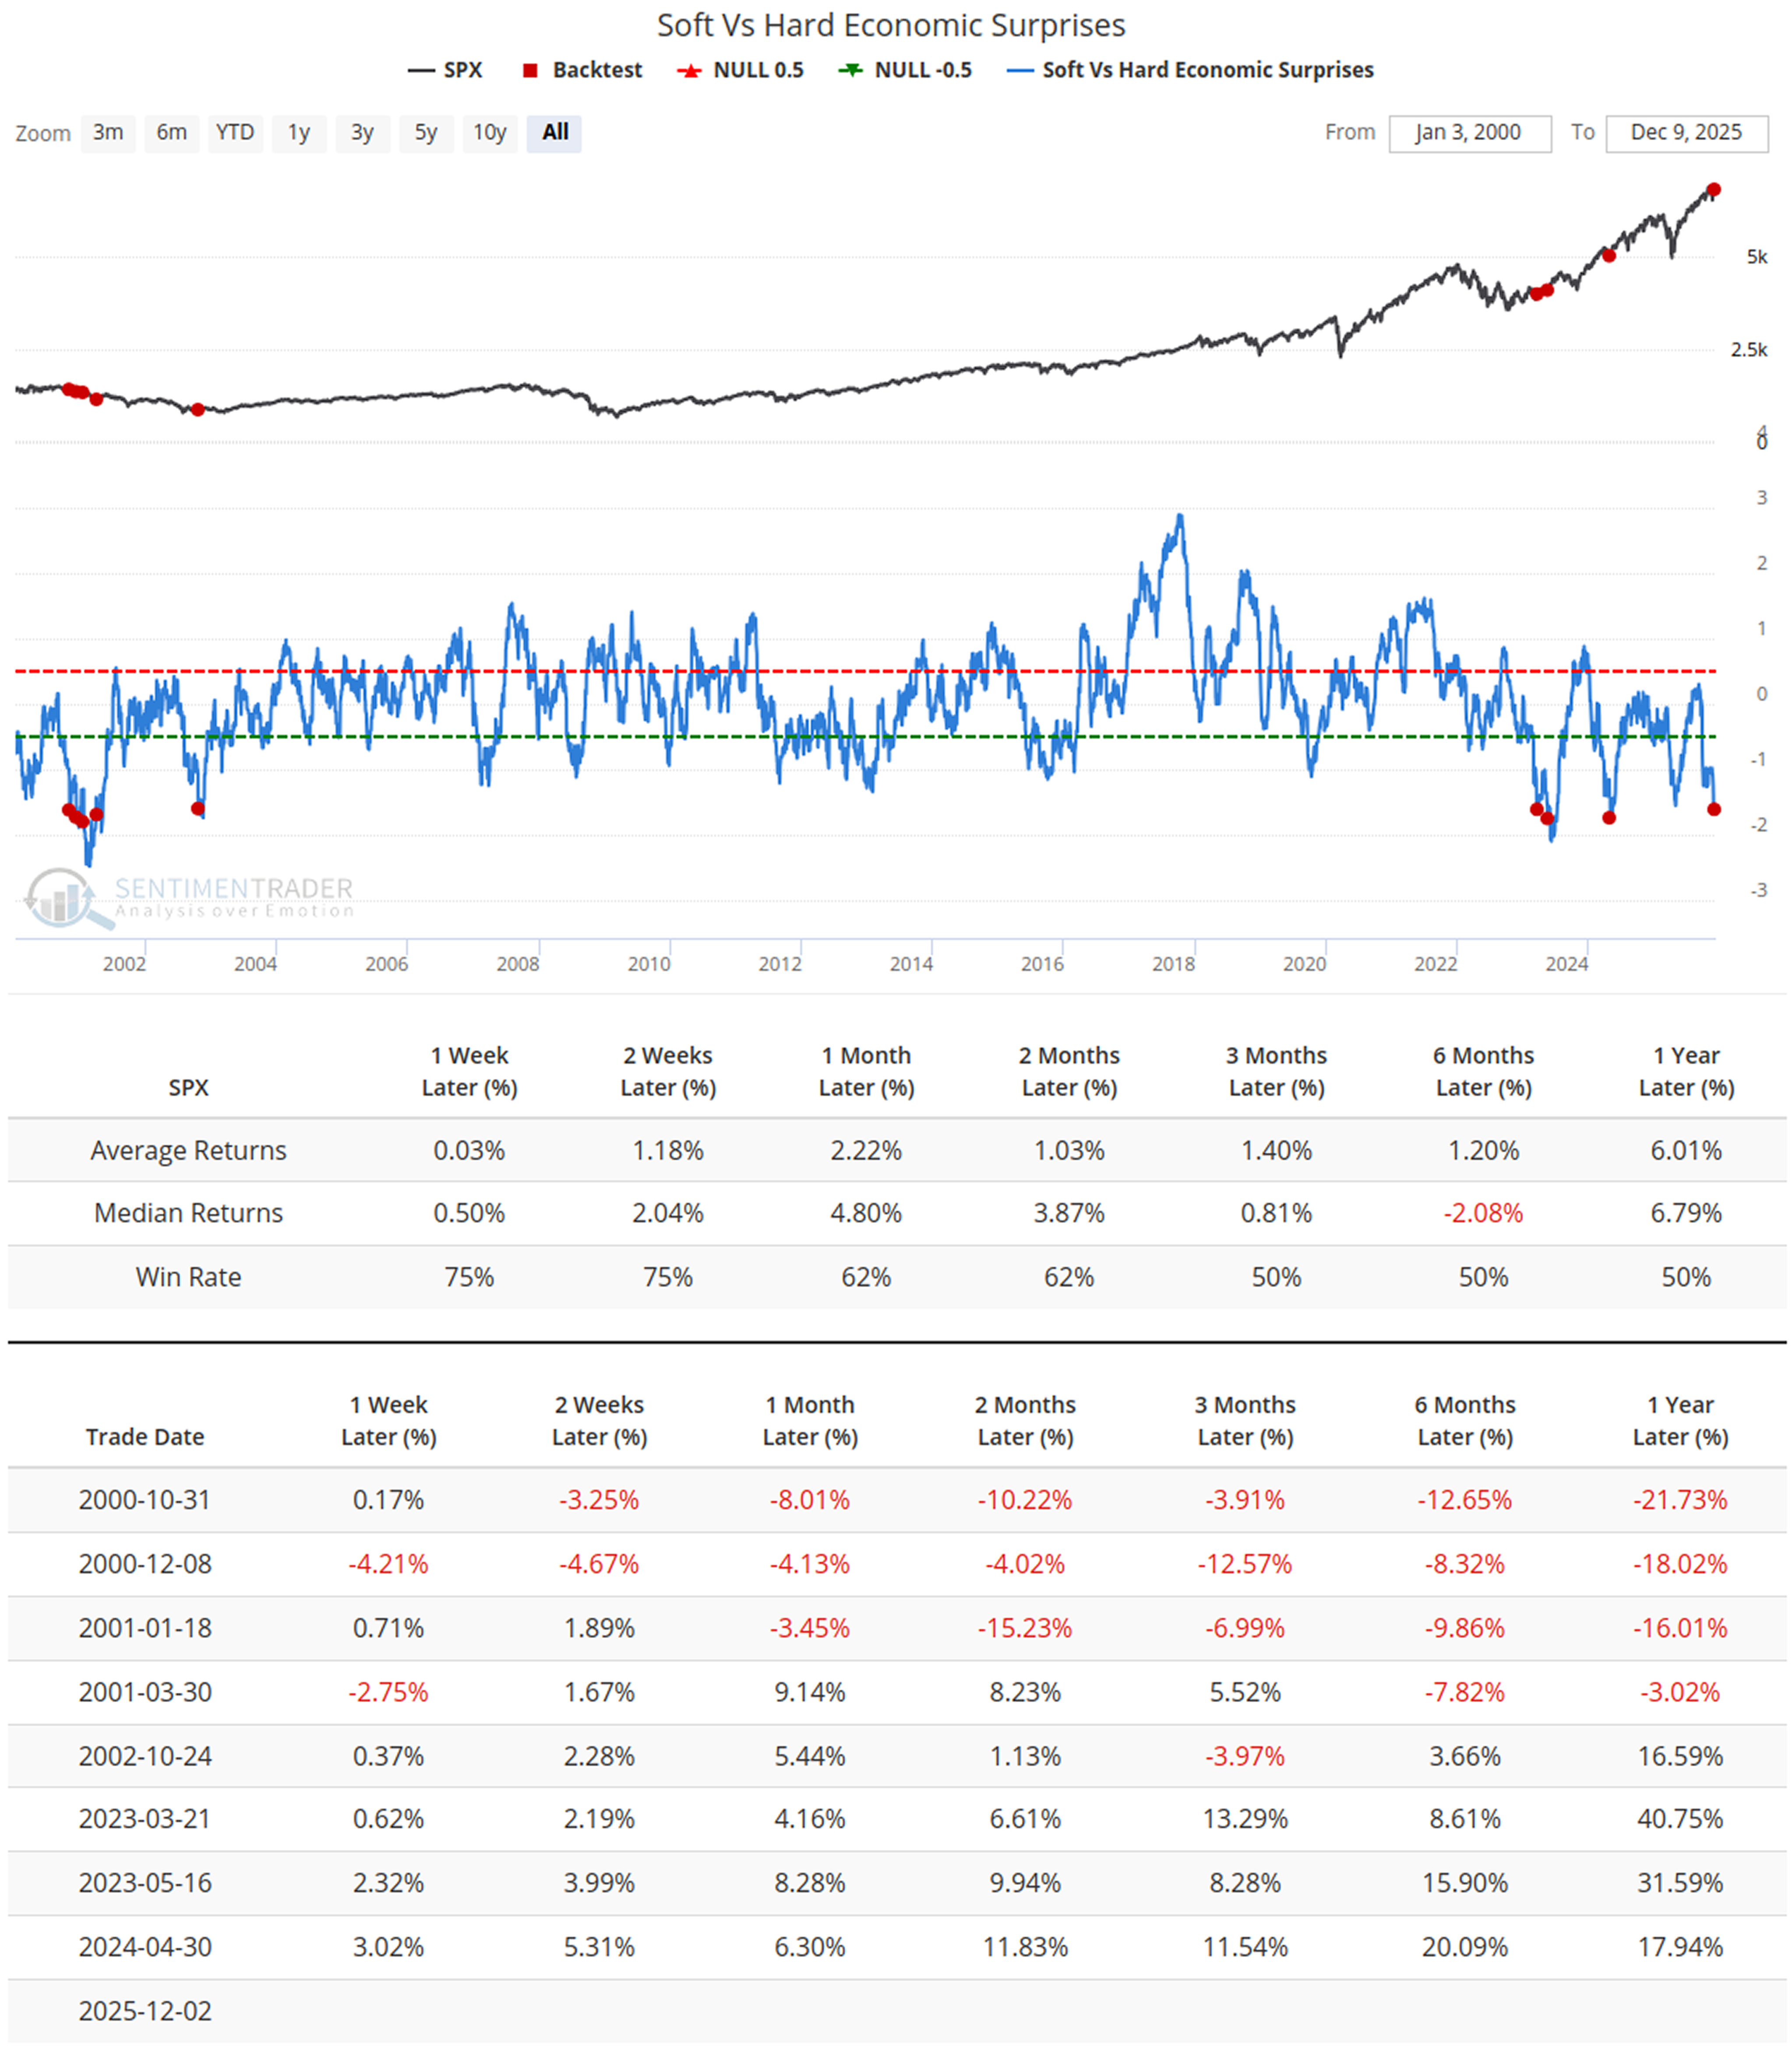
This signal has been triggered 9 times in history. It first emerged at the end of 2000: people's perceptions were extremely negative, and subsequent events validated these feelings-hard data collapsed, and the stock market plummeted by approximately 18%-21% over the following year. The signal reappeared in early 2023: despite widespread fears of an imminent crisis, hard data remained resilient, eventually disproving the pessimism, and the stock market surged by around 30% in the subsequent year.
The index has now fallen below -1.6 once again. If future hard data (nonfarm payrolls, GDP) can maintain even mediocre performance, this pessimism will instead present a trading opportunity; conversely, a weakening in hard indicators will open up downside potential for the market.
Capital Dynamics
In normal market logic, the more expensive an asset is, the fewer buyers there should be. We typically use the Equity Risk Premium (ERP) to measure this relative value-the excess return expected from holding stocks over risk-free U.S. Treasury bonds. When the ERP falls below 0, it means stocks are mathematically less attractive than Treasury bonds in terms of expected returns.
Today's market presents a paradox: the ERP is negative, yet the NAAIM Exposure Index (which tracks the positions of active fund managers) stands at an exceptionally high 98.57 (near full positioning). Backtesting results reveal the following data: Related Backtest Click Here.
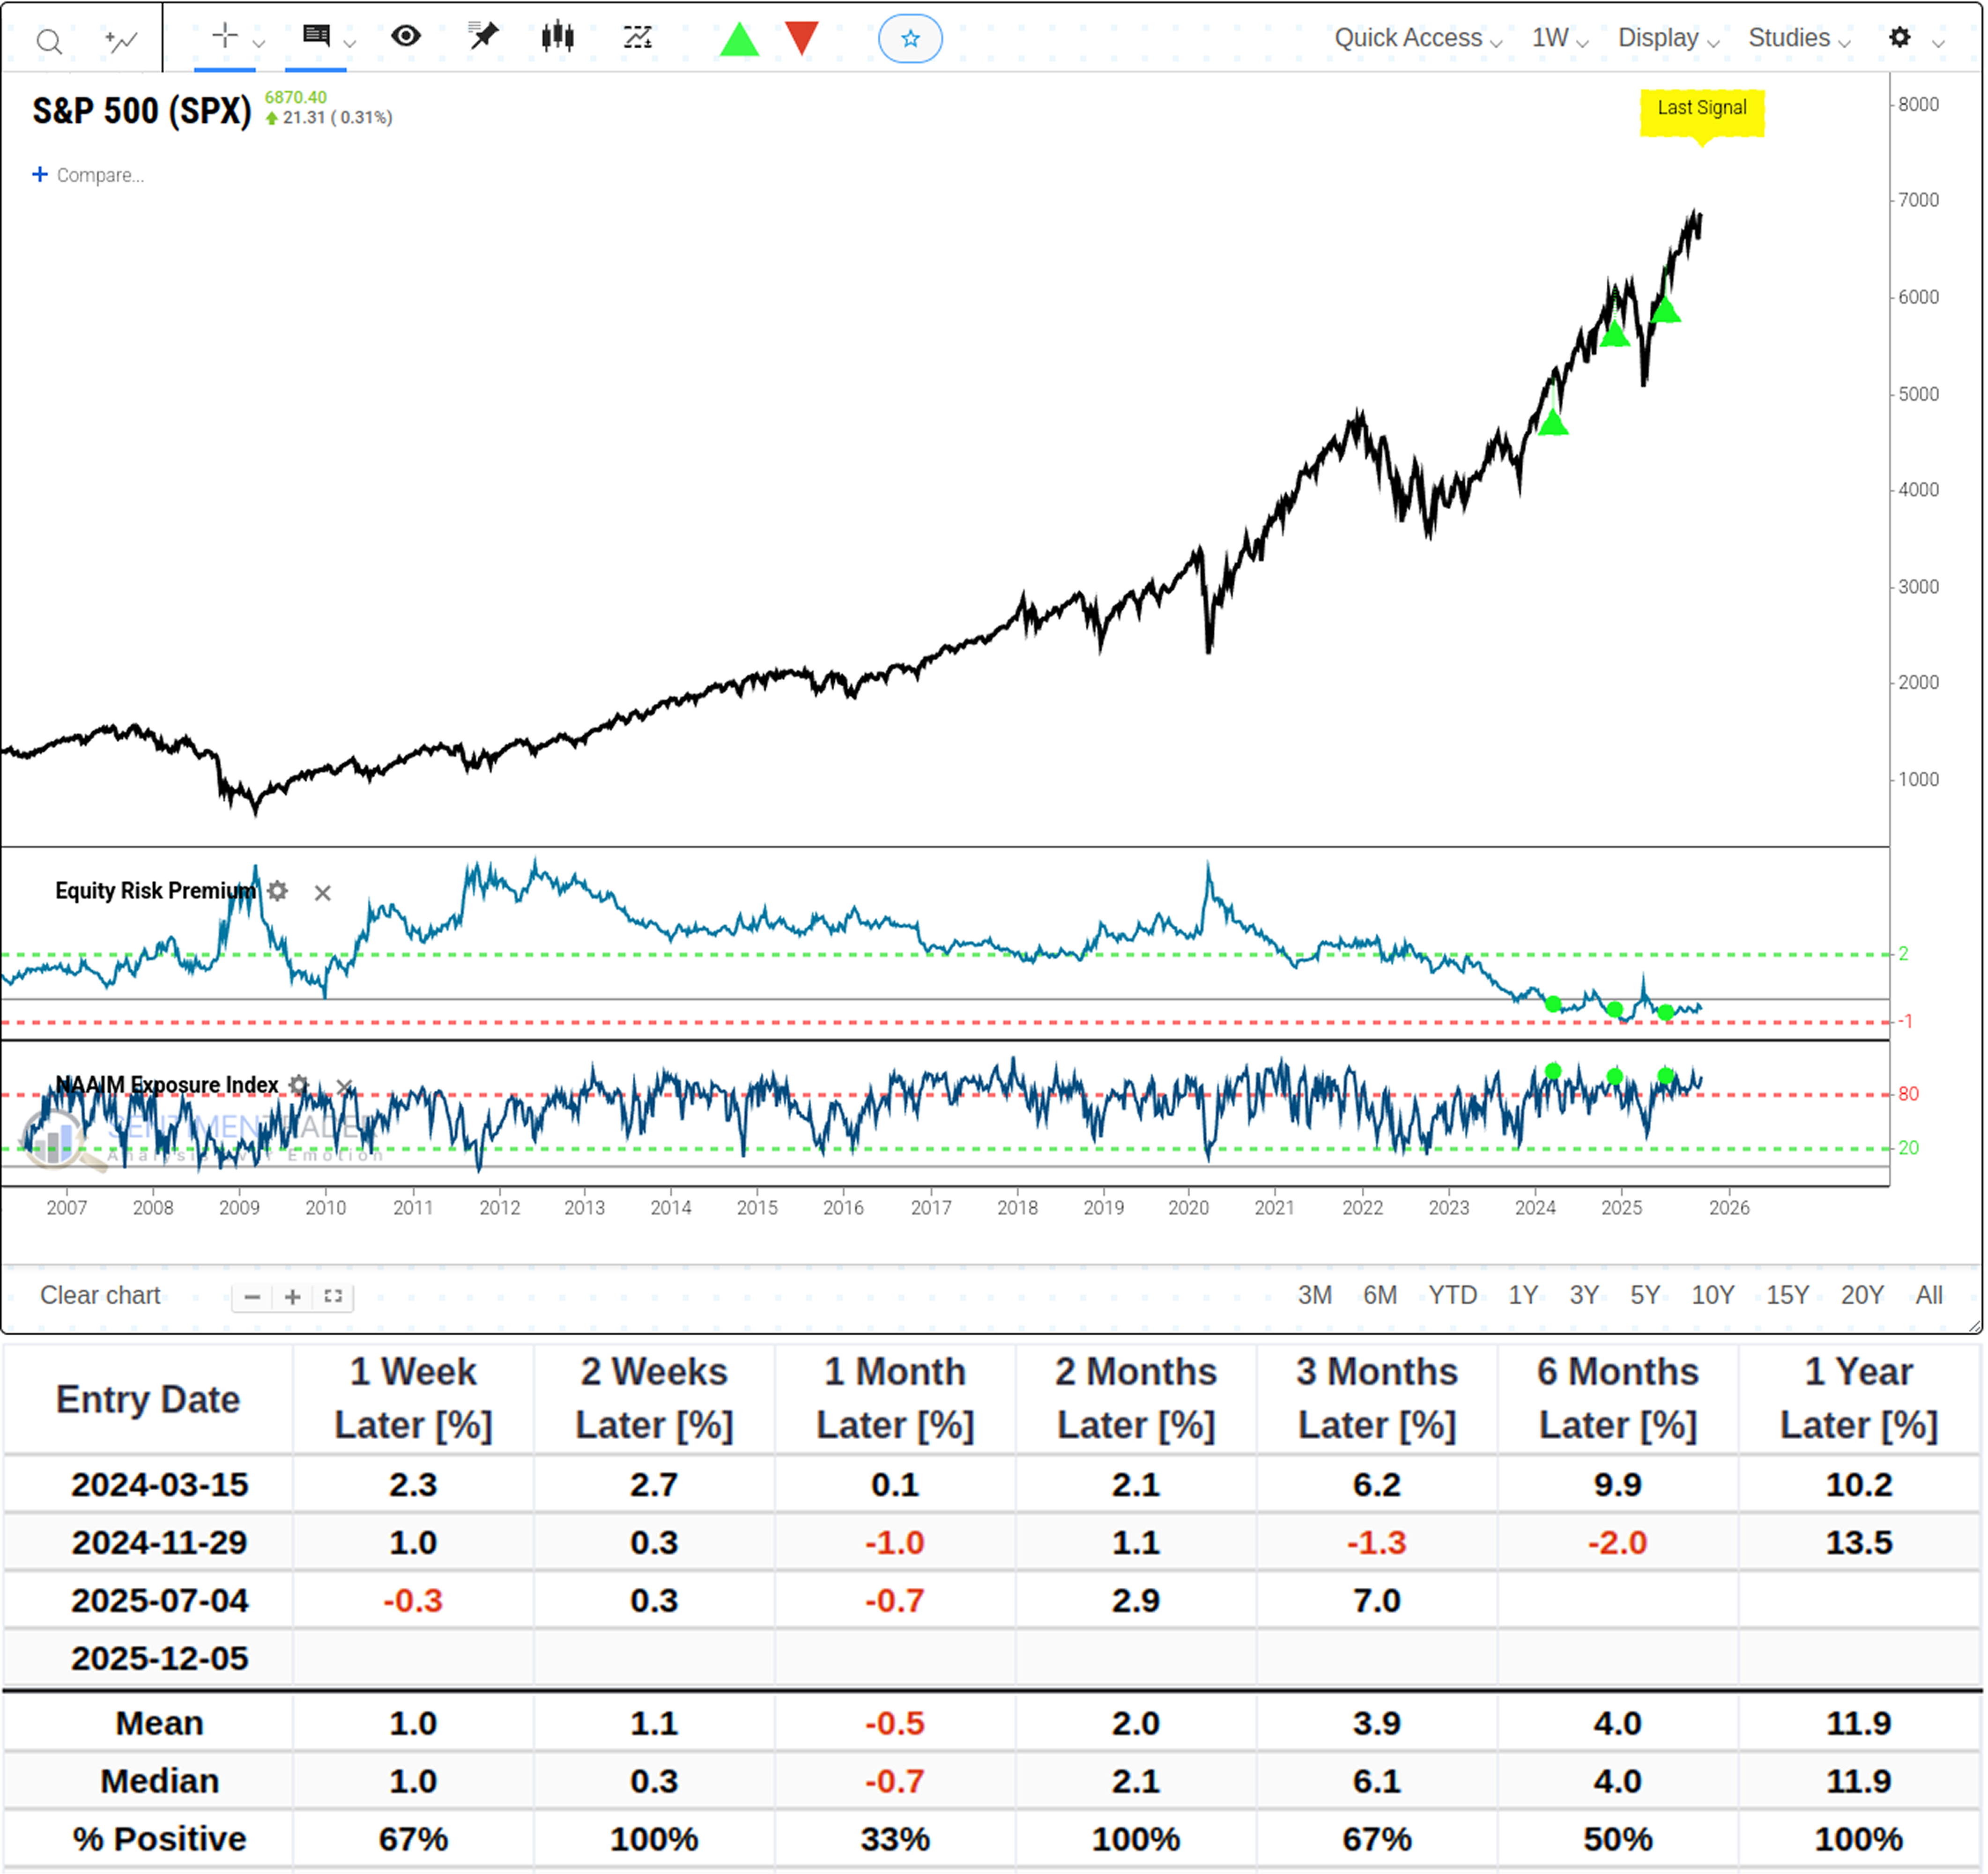
Data shows this scenario has never occurred historically, with only 3 recorded instances-all concentrated in recent periods. As always, we must exercise caution with such a small sample size. In essence, this phenomenon is unique to the current cycle. It is not a trading strategy, but rather a reflection that the market is currently in a liquidity-driven "momentum mode," where valuation constraints have temporarily ceased to function.
University of Michigan Consumer Confidence Index
Turning to the University of Michigan Consumer Confidence Index (UMich Consumer Confidence), the current reading is around 51, hitting a three-year low.
For a consumer-driven U.S. economy, this sounds like a disaster. However, in stock market dynamics, extreme pessimism often acts as a contrarian indicator-when everyone is bearish, selling pressure may have already been exhausted.Related Backtest Click Here.
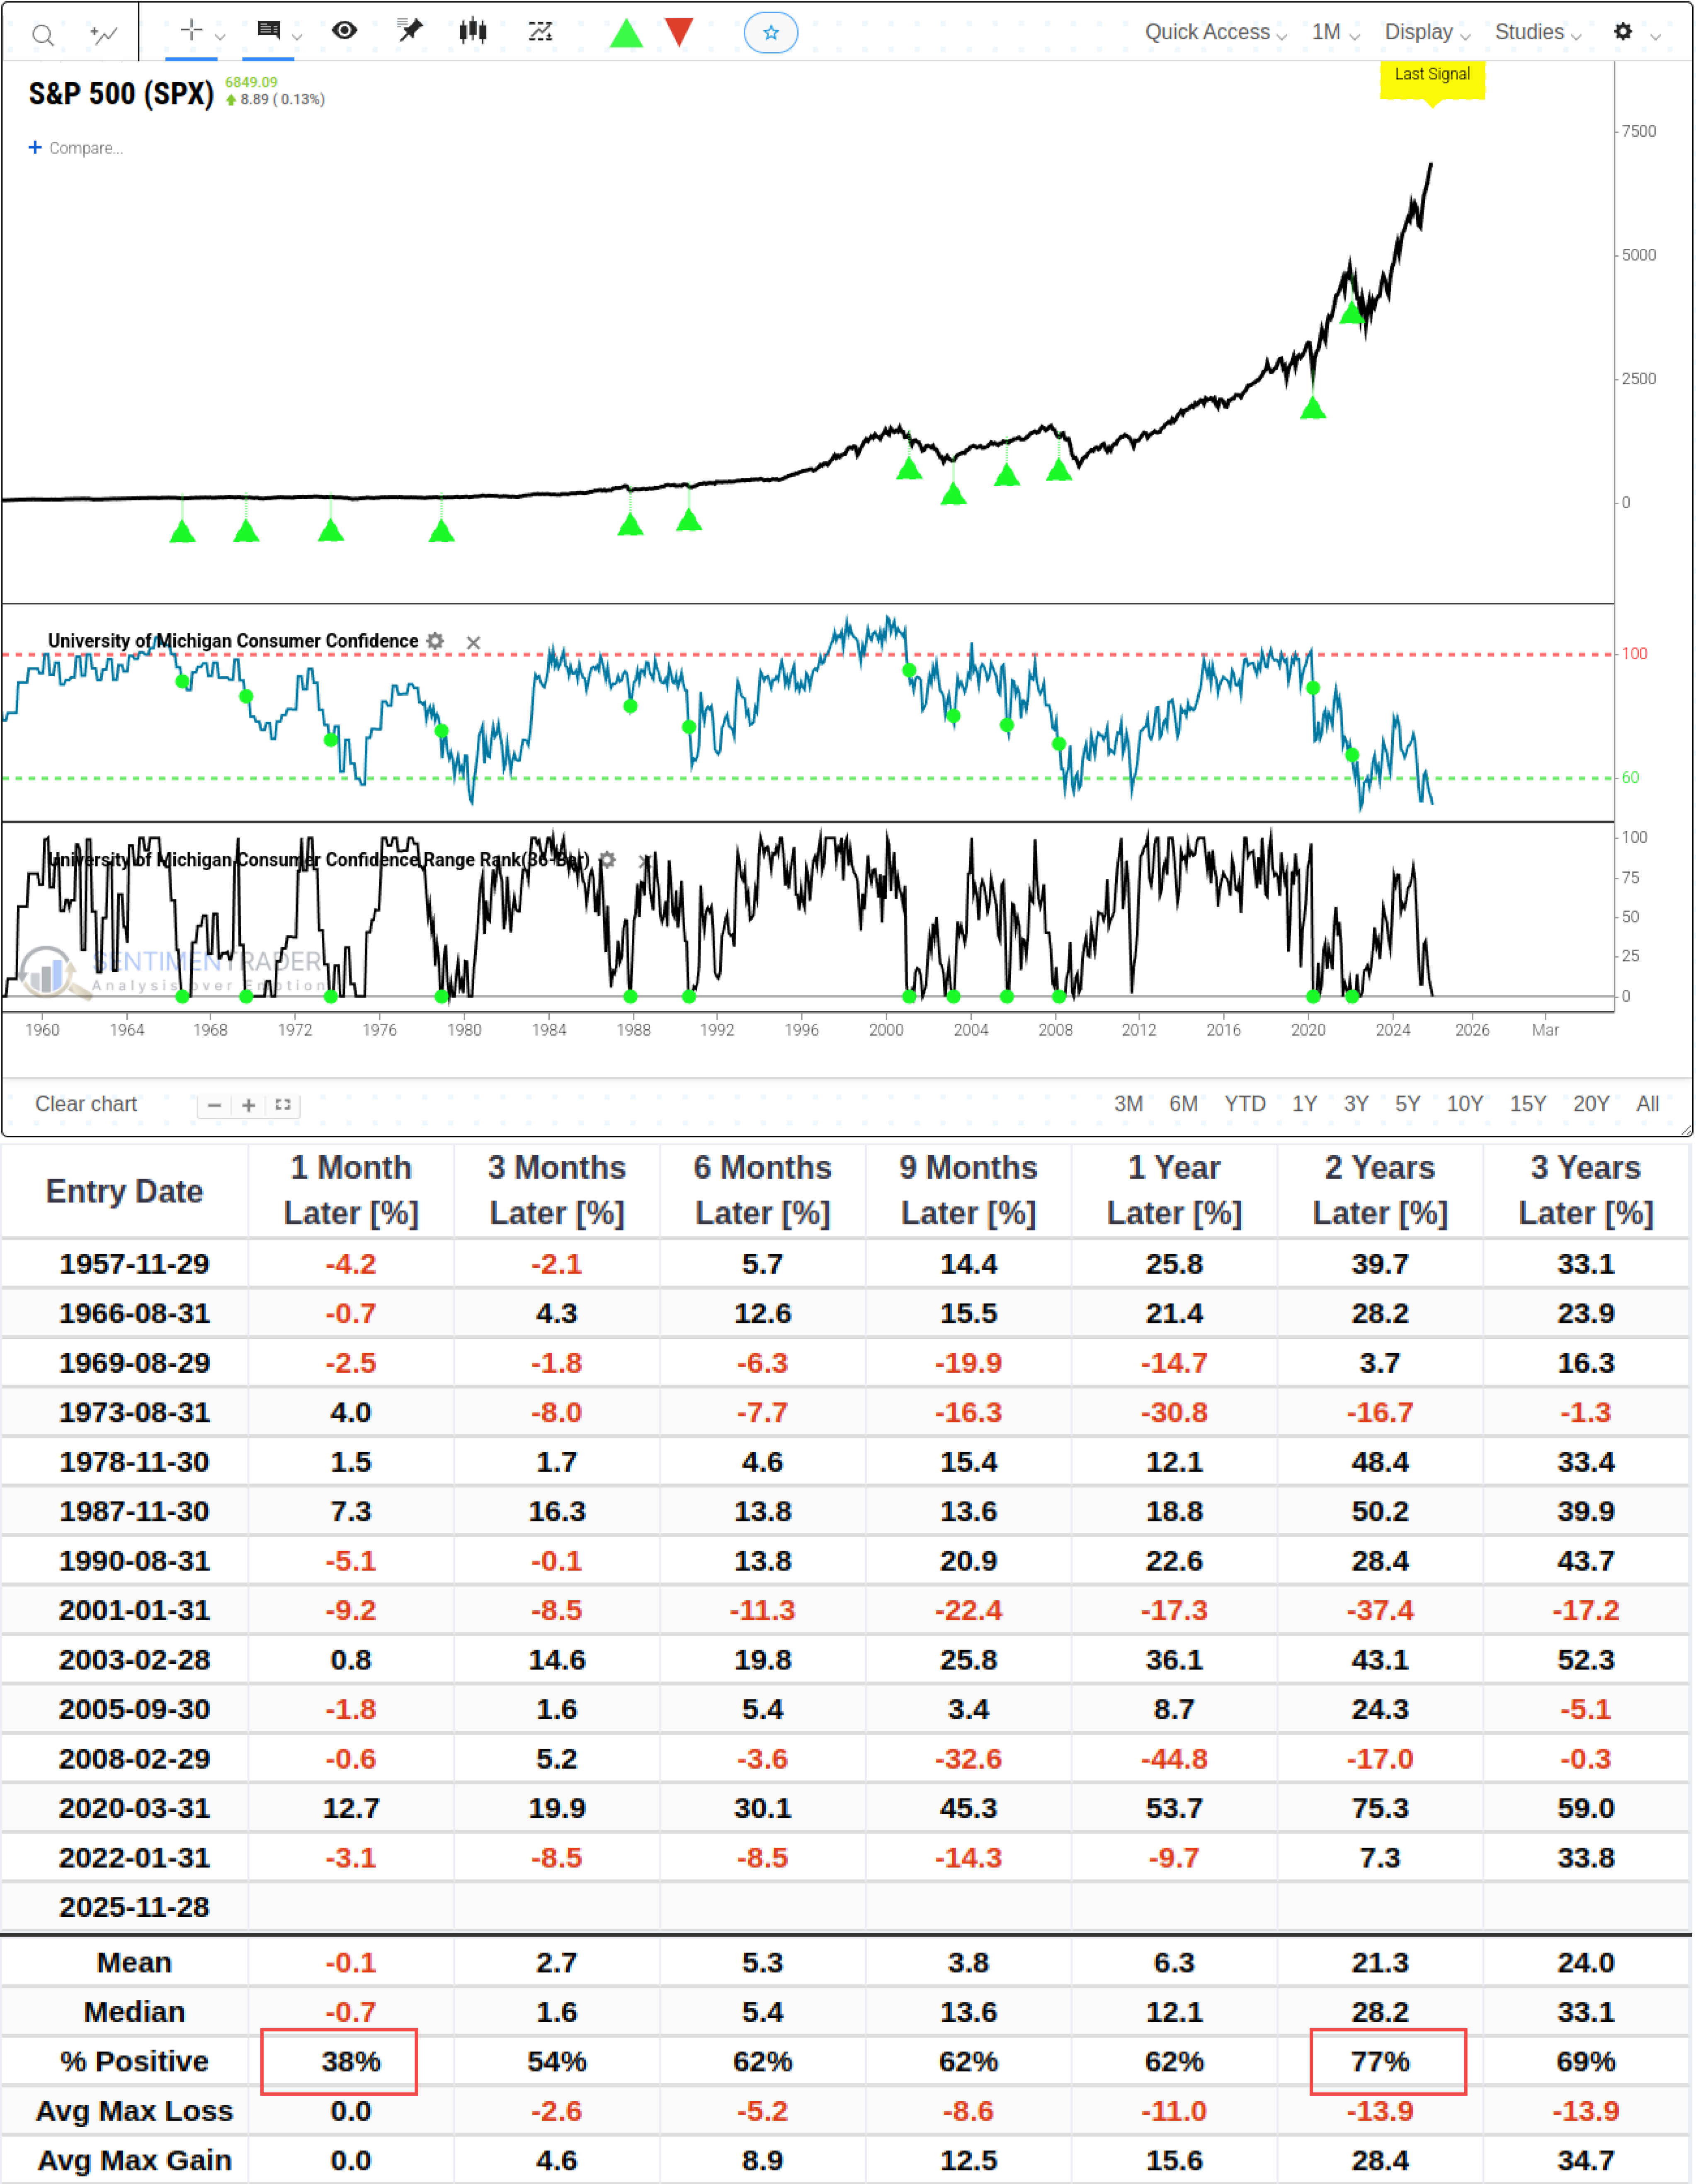
Historical data shows this signal (a three-year low) has occurred 13 times in history. In most cases, short-term win rates are low when confidence hits rock bottom, but the median return over the subsequent two years reaches as high as 28.2%, with a positive return rate (win rate) of 77%. The only two fatal misjudgments occurred in 2001 and 2008. This means the effectiveness of this indicator is predicated on the absence of systemic collapse in the financial system.
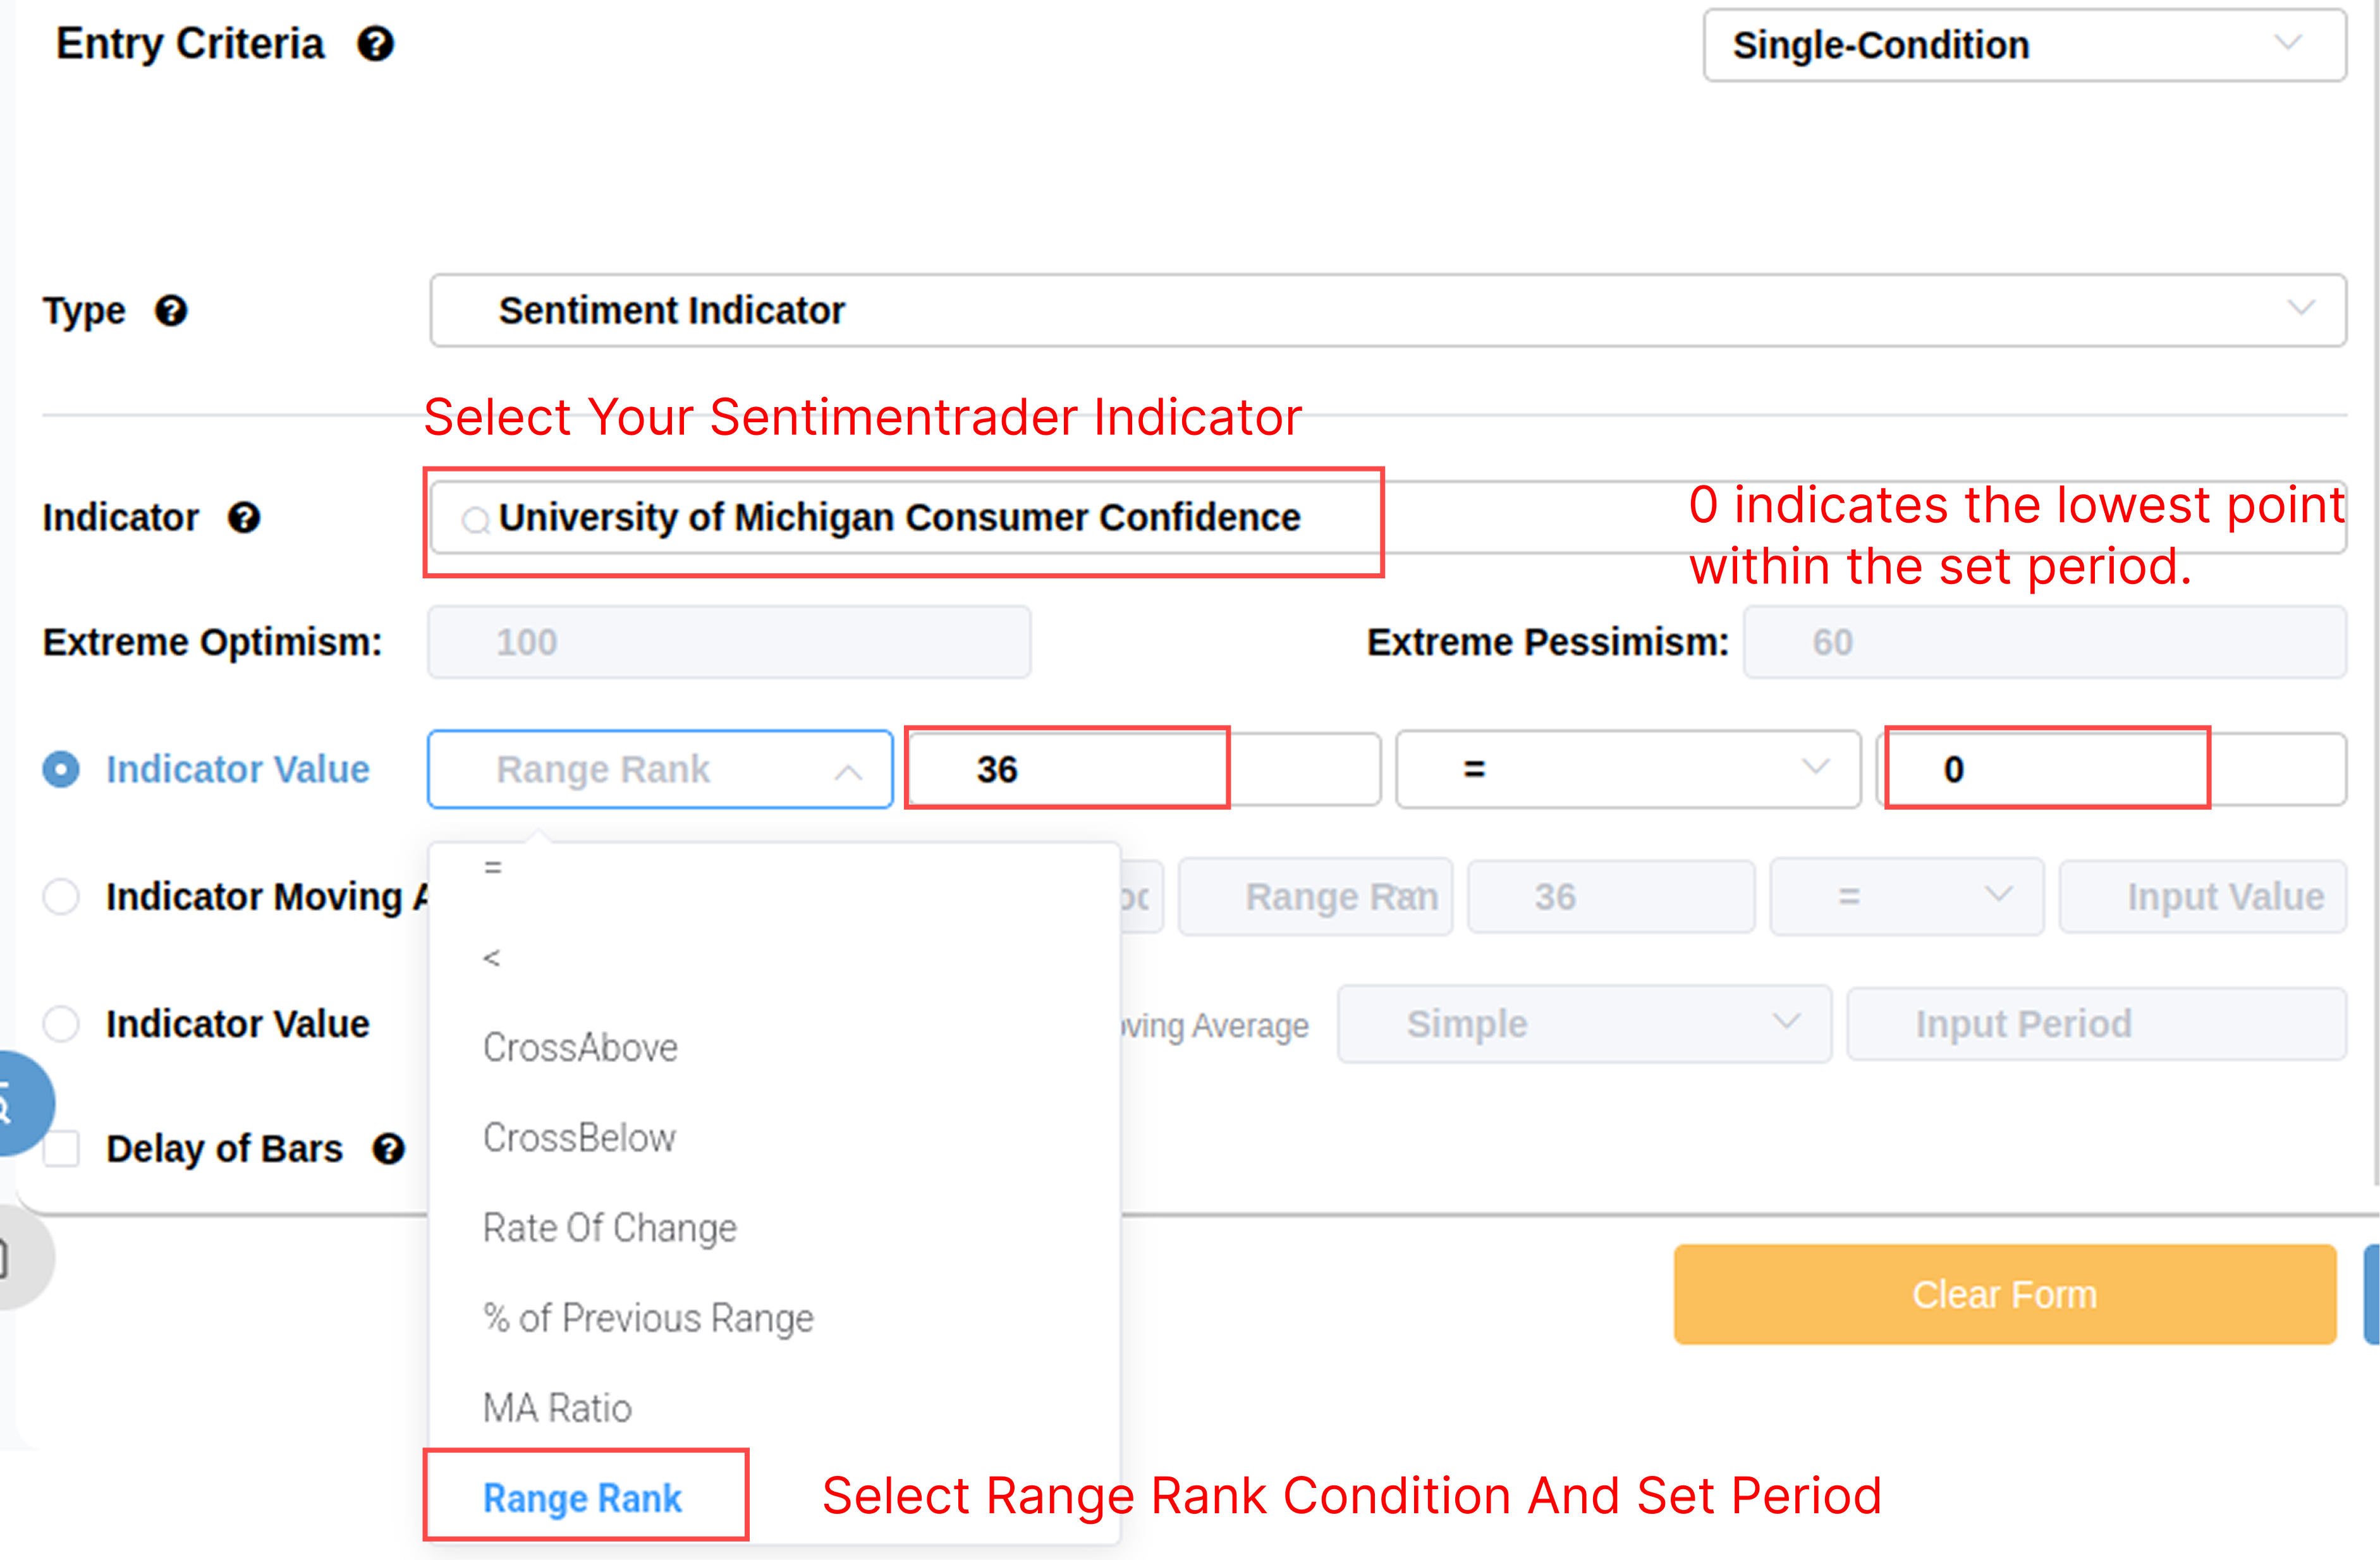
Follow these steps to build a backtest for this ranking type condition:
Options Market
Finally, we shift our focus back to short-term sentiment. The LOBO Put/Call Ratio has fallen below 0.65. This indicator filters out market makers' hedging orders, providing a purer reflection of speculators' bullish/bearish preferences. A lower reading indicates a higher concentration of investors buying call options.
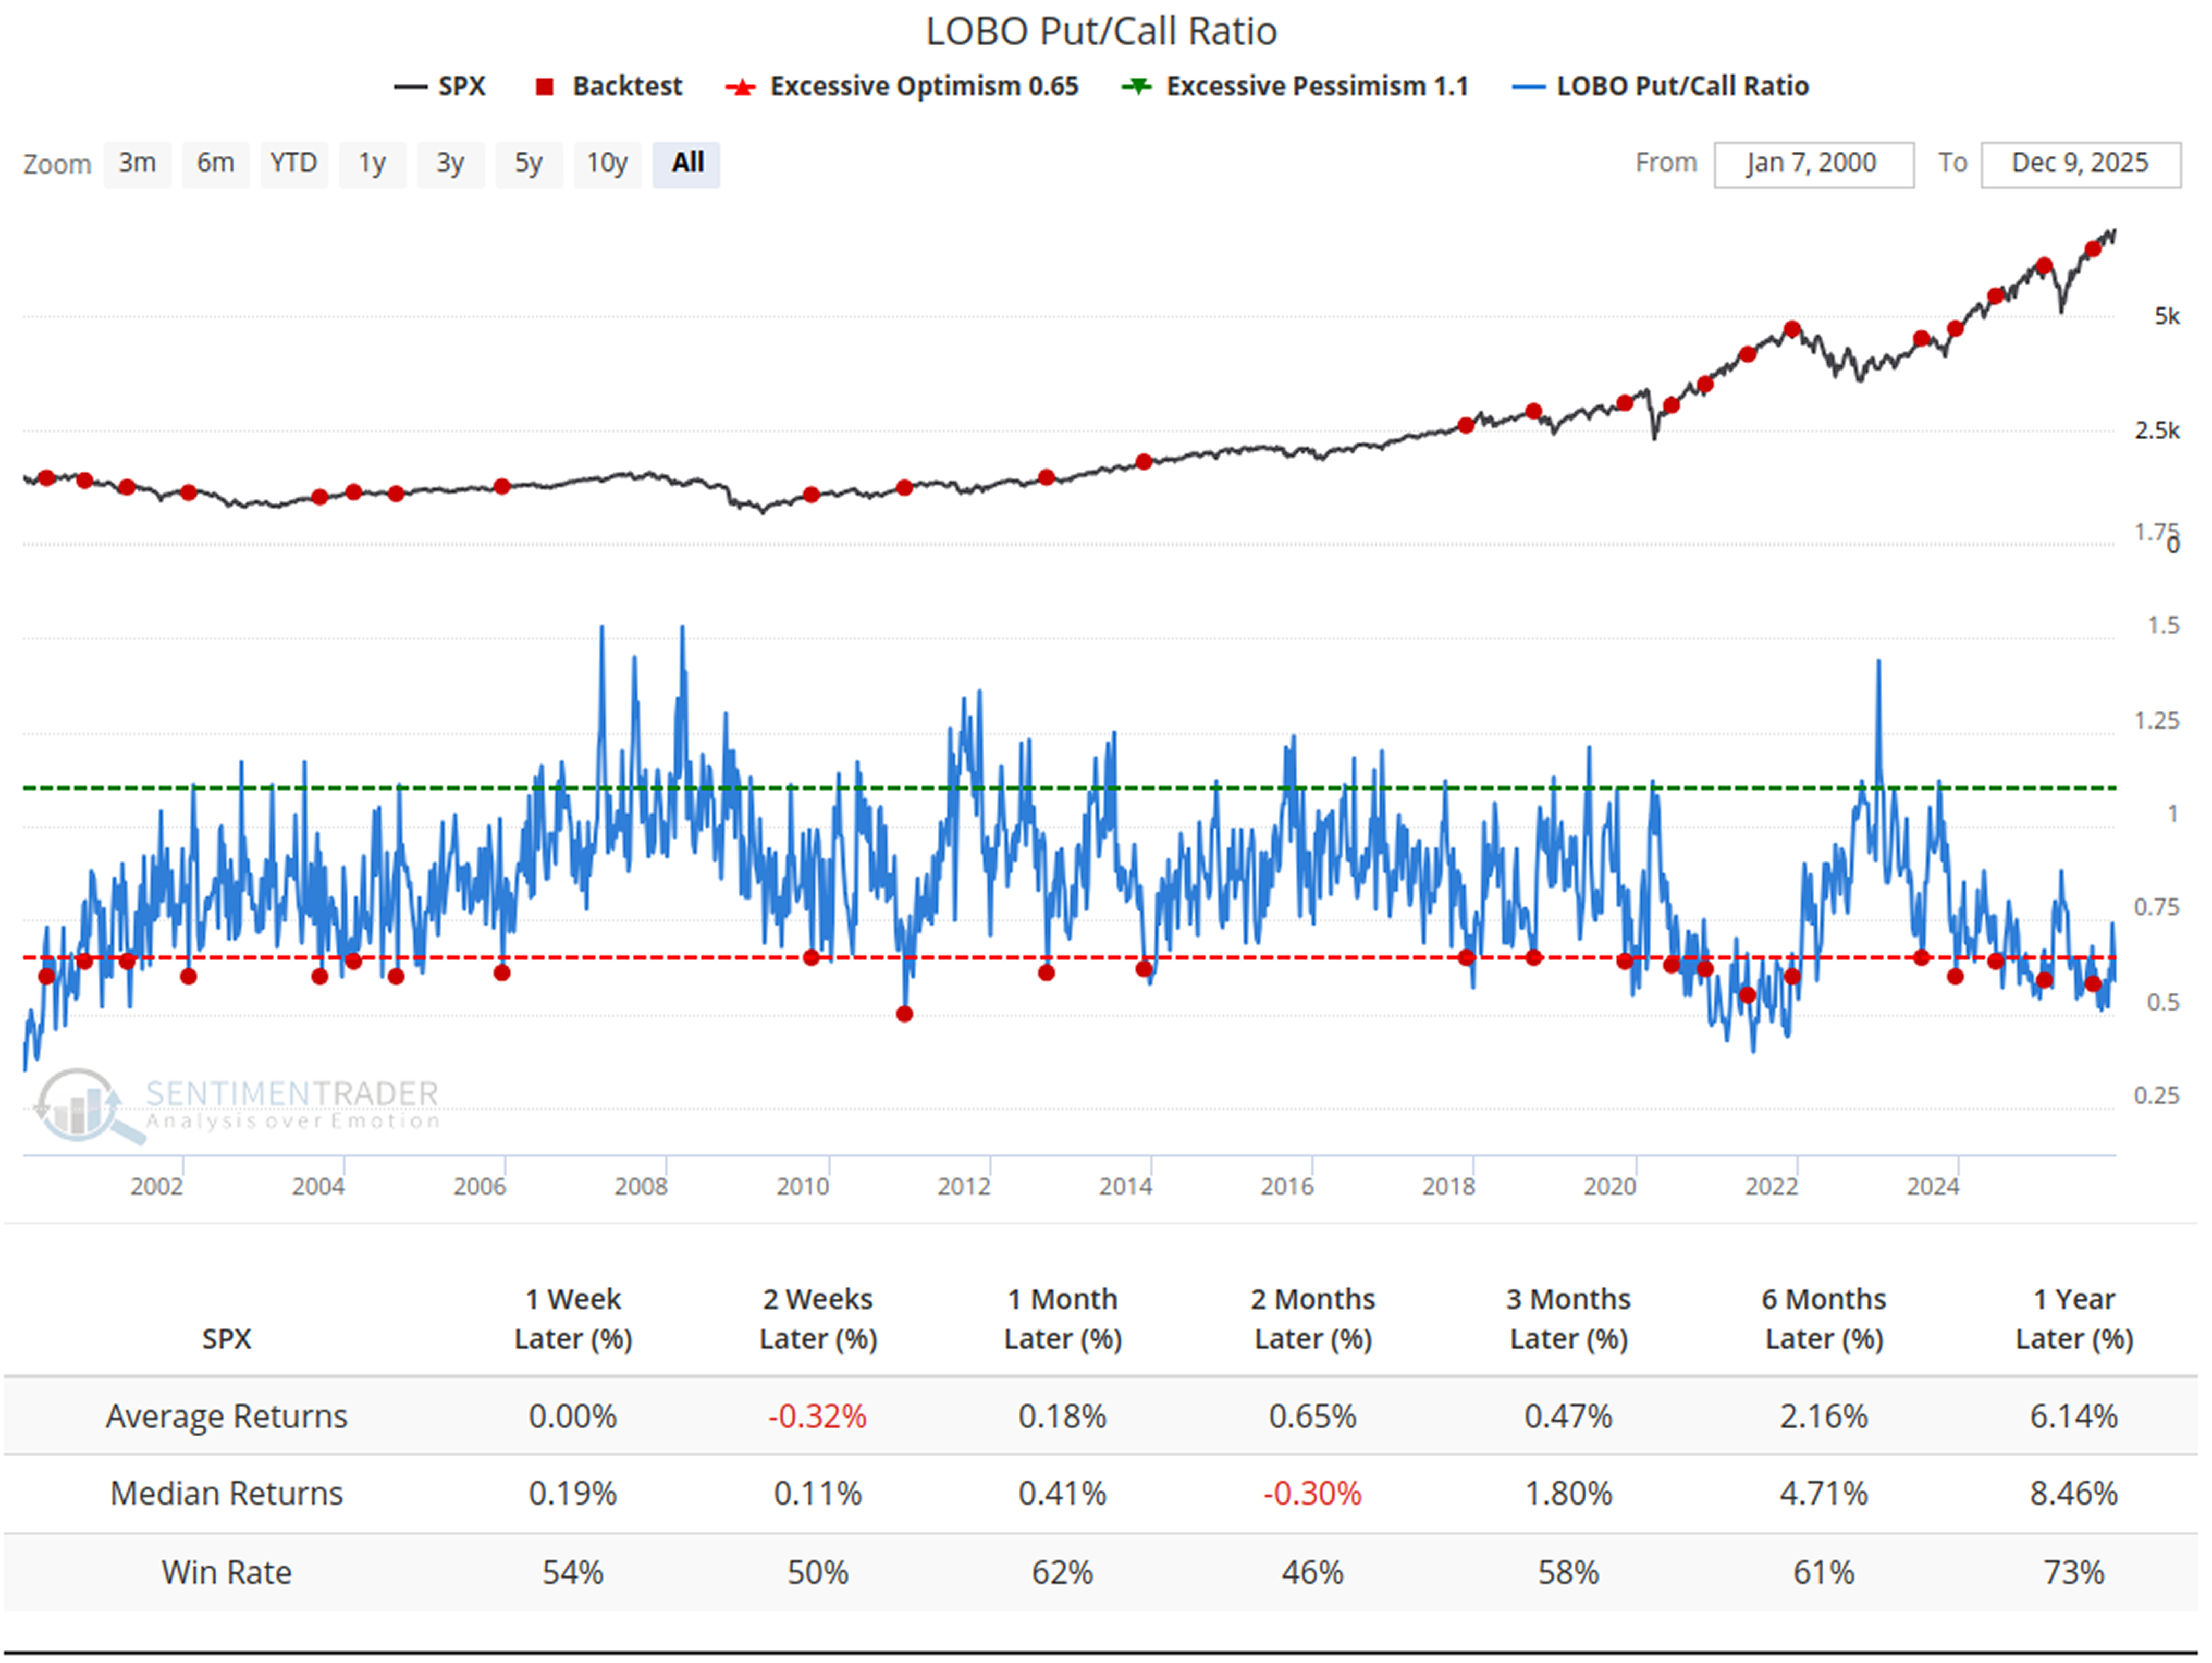
Data indicates that when sentiment is this exuberant, the market typically enters a period of stagnation or volatility in the short term (1 week to 1 month), with an average return close to 0%. This aligns with the short-term "extreme exuberance leads to a pullback" principle. However, over a 6-month or 1-year horizon, historical upward trends have not been disrupted by such exuberance.
What Our Research Tells Us...
The current market exhibits complex structural characteristics. Short-term sentiment indicators (e.g., the LOBO Put/Call Ratio) point to exuberant trader sentiment, suggesting the market may enter a phase of volatility or face pullback pressure. Meanwhile, there are divergences in market structure: a disconnect between asset valuations (negative ERP) and capital behavior (high institutional positioning), as well as a gap between economic perceptions (weak survey-based soft data and consumer confidence) and actual output (hard data performance).
Despite the limited historical sample size, the subsequent evolution of these divergence patterns is highly dependent on the trajectory of hard data. If hard data remains resilient, the current low sentiment and high institutional positioning may together form short-term support for the market. Conversely, a trend-based decline in hard data will expose the fragility of valuations and positioning, potentially subjecting the market to systemic pressure.