
Disappointing economic reports are investors' latest worry

Key points:
- Economic surprises have been increasingly negative in the U.S.
- Many of those surprises have been in "soft" data like surveys
- After a period of largely positive surprises, this reversion to the mean hasn't tended to lead to negative returns
Surprises have been skewing to the downside
Time and again since 2022, a devastating year for many, investors have been looking for reasons to sell. None of them have been particularly compelling based on historical behavior.
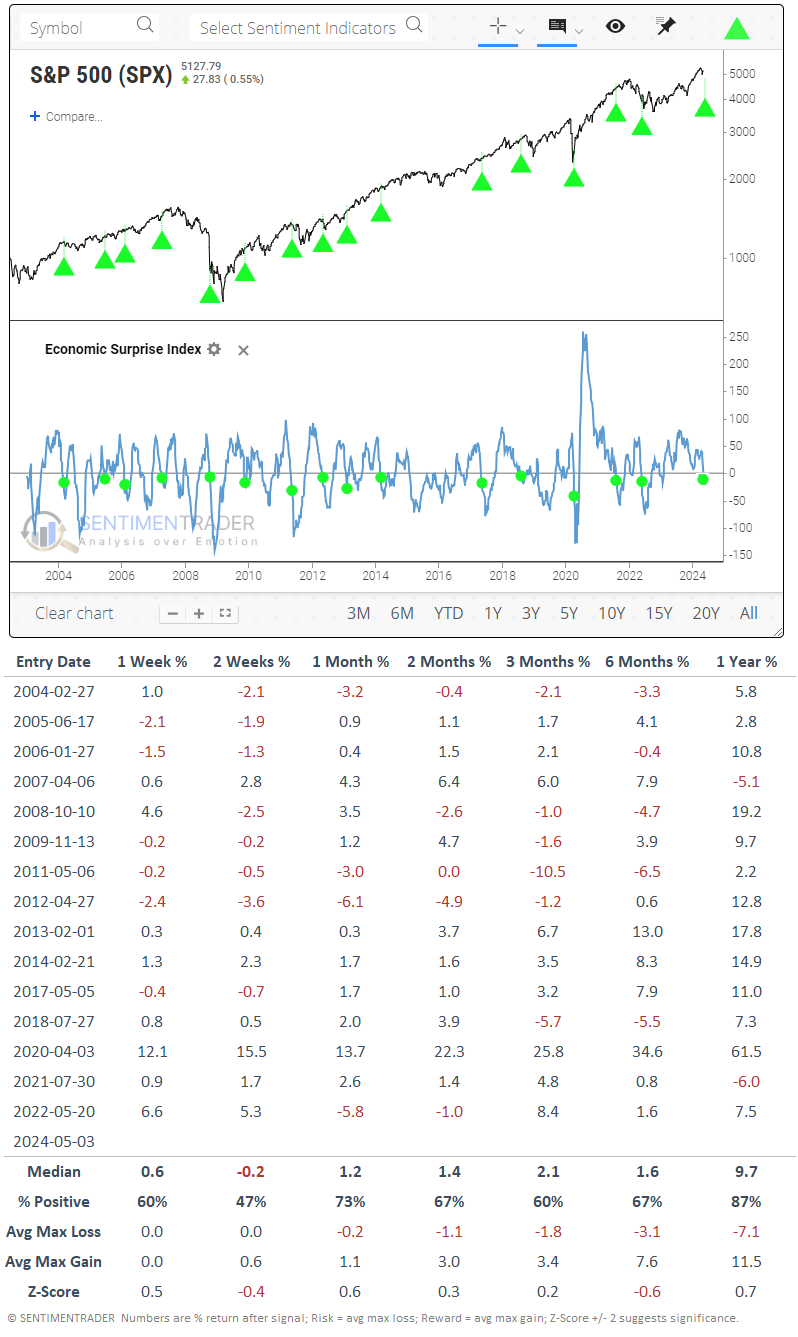
One that popped up lately is disappointing economic reports. While that may be welcome to some as it could help sway the Fed to cut rates, a deteriorating economy is not generally a welcome background for stock prices. And according to Citigroup, economic surprises have gone from positive to the most negative in over a year.
The chart and table below show each time that economic surprises have cycled from very positive (above +50) to meaningfully negative (below -5). While the S&P 500's returns over the next couple of weeks were somewhat poor, that was the only time frame of concern. After that, they weren't much different than random. A year later, the S&P was higher after all but two signals, and those were both limited losses.
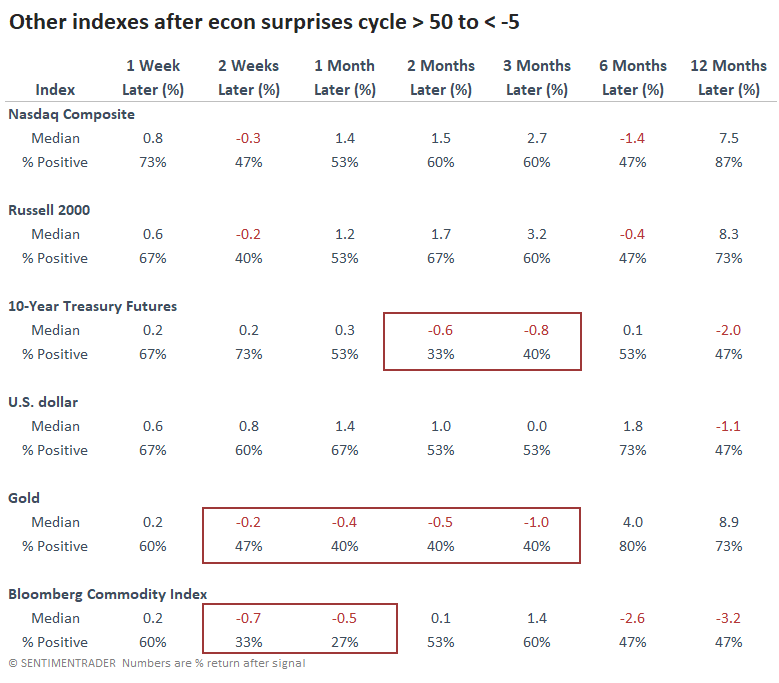
Among other indexes and markets, not too much stood out. Treasury notes showed some weakness in price over the next 2-3 months, meaning yields rose - not necessarily what one would expect with weaker-than-expected economic reports. Gold and the broader commodity complex performed poorly over the short- to medium-term.
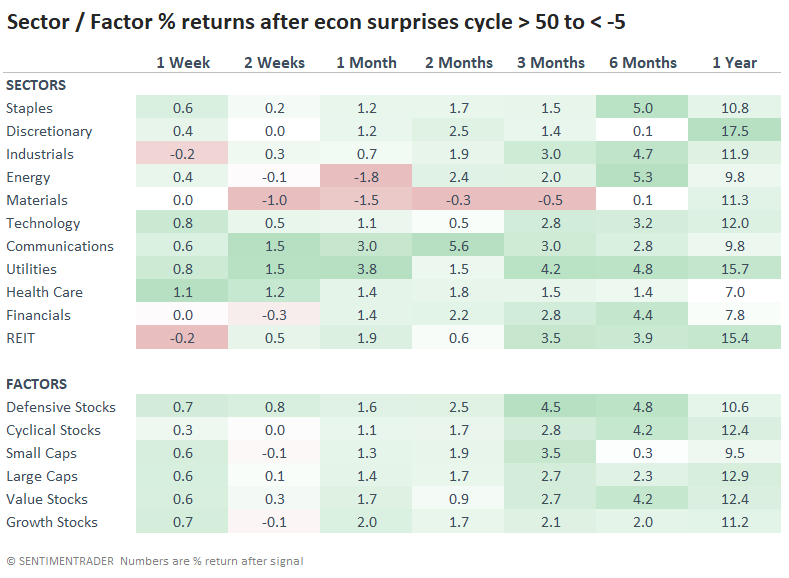
It's not a big surprise that defensive stocks showed among the best returns after these cycles in economic surprises. Over the next three months, the defensive factor averaged a return of +4.5%, the highest out of any sector or factor. Utilities and Staples held up well over the next three to six months. Utilities were the only group that showed only a single loss over the next six months; all others had three or more losses.
Much of the decline in surprises has come among "soft" economic releases, such as surveys. "Hard" data, such as retail sales, which are less open to subjective interpretation, have held up relatively better relative to expectations. Because of that, the difference between soft and hard surprises has plunged to one of the lowest levels in more than 20 years.
When soft surprises were substantially worse than hard ones, the S&P 500 returned an annualized +10.2% versus only +5.3% when the opposite condition existed. When soft-hard surprises cycled from near +1 to -1, it tended to precede favorable market conditions but was way too early in 2008 and didn't help ahead of the pandemic panic in 2020.

What the research tells us...
We've spent much time since October 2022 looking at bearish arguments. Almost all of them were discarded since we could not reproduce consistently negative returns for stocks after similar conditions. Again, investors want to be bearish to protect themselves after a year like 2022, when pretty much every financial asset lost value.
Sometimes, the hardest thing to do is the obvious one, and the obvious thing is that stocks usually go up (in the U.S., anyway). Some concerns are lingering that have a decent record of preceding lower prices. Still, those are few and far between and don't seem to outweigh the significantly larger sample of sentiment, fundamental, credit, and momentum studies showing a more consistent history of preceding rising prices.