Products
SentimenTrader Trading Tools
‍
Backtest Engine
My Trading Toolkit
Correlation Analysis
Seasonality
Market Prediction
Indicators & Data API
‍
Proprietary Indicators & Charts
Market Data API
Strategies & Scanner
‍
50+ Trading Strategies
Smart Stock Scanner
Smart Option Scanner
Research Reports
‍
Research Solutions
Reports Library
Free Resources
Simple Backtest Calculator
Simple Seasonality Calculator
The Kelly Criterion Calculator
Sentiment Geo Map
Public Research Reports
Education
Sentiment Indicators
Technical Indicators
Pricing
Company
About
In the News
Testimonials
Client Success Stories
Contact
Log inLoginSign up
< BACK TO ALL REPORTS

Did this price pattern mark a top for equities?

Dean Christians
2025-08-04
In the past two weeks, the S&P 500 rallied for four straight days to a record high and then declined for four consecutive days. Similar price patterns saw the index consistently rally over the next three months, with muted drawdowns.

Key points: 

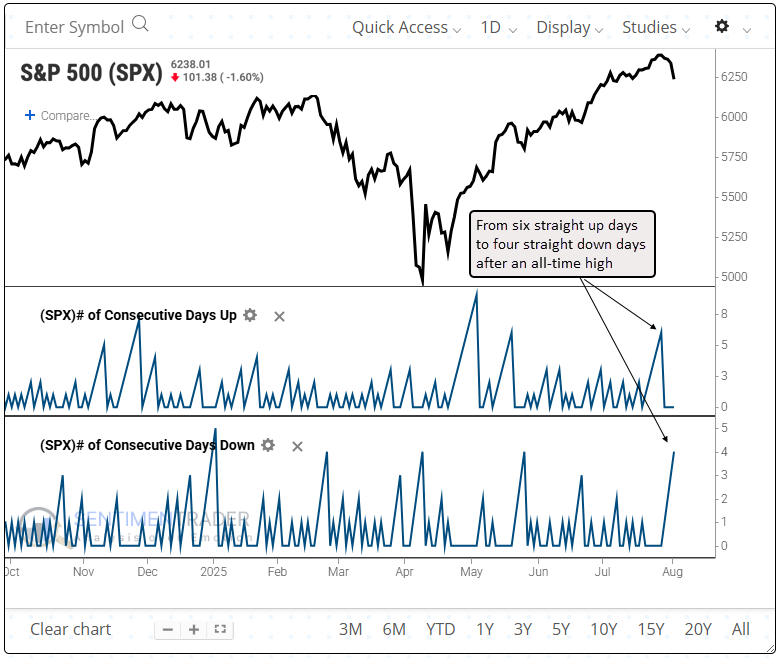
  • The S&P 500 recorded six up days, then four down, off an all-time high
  • Similar patterns saw the index bounce back, rallying 78% of the time over the next three months
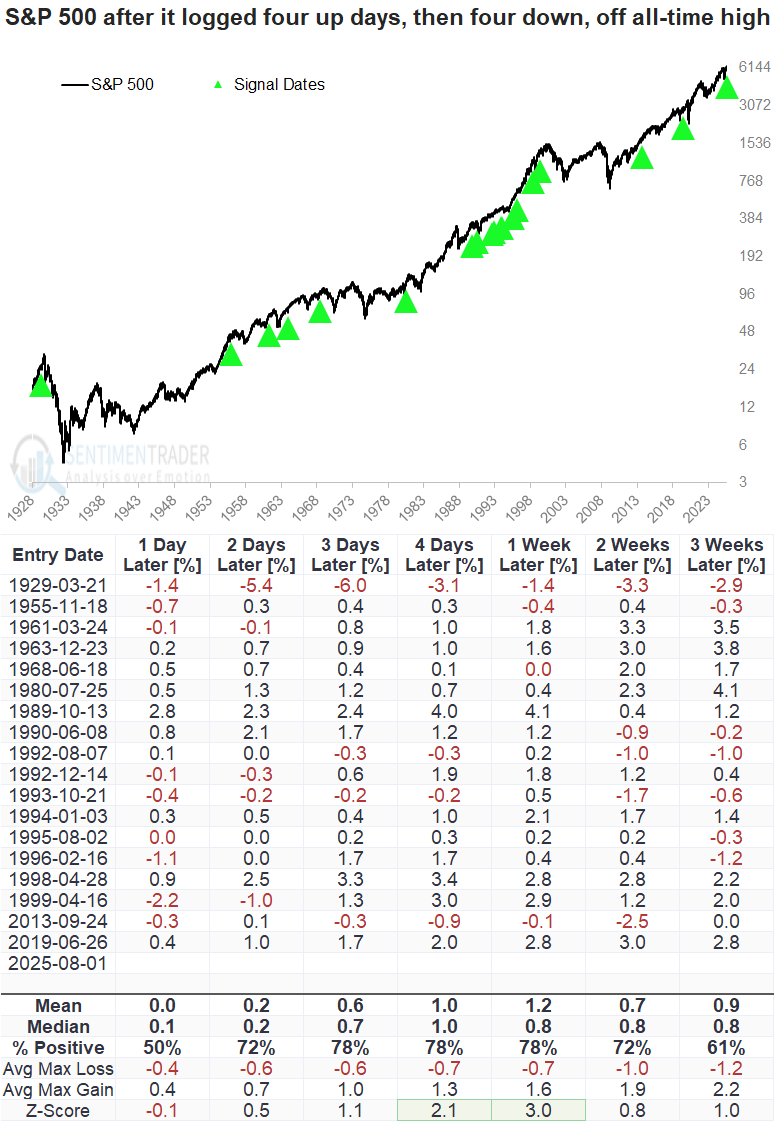
  • Even shorter time frames favored a snap-back rally, with a caveat

An ominous price pattern or just noise?

Stocks' most recent breakout was met with persistent selling pressure. Textbooks tell us that's a sign of rejection, and a bad sign going forward.

On Friday, the world's most benchmarked index logged its fourth straight daily decline from an all-time high. The pullback follows six consecutive record closes, prompting debate over whether this marks a meaningful shift or is simply noise within an ongoing uptrend.

Price patterns like this tend to be observations rather than actionable trading signals, which is why we don't incorporate them into our weight-of-the-evidence framework. Nonetheless, they are intriguing to assess, particularly as a way to challenge and debunk the narratives that often accompany them.

A bounce-back looks likely

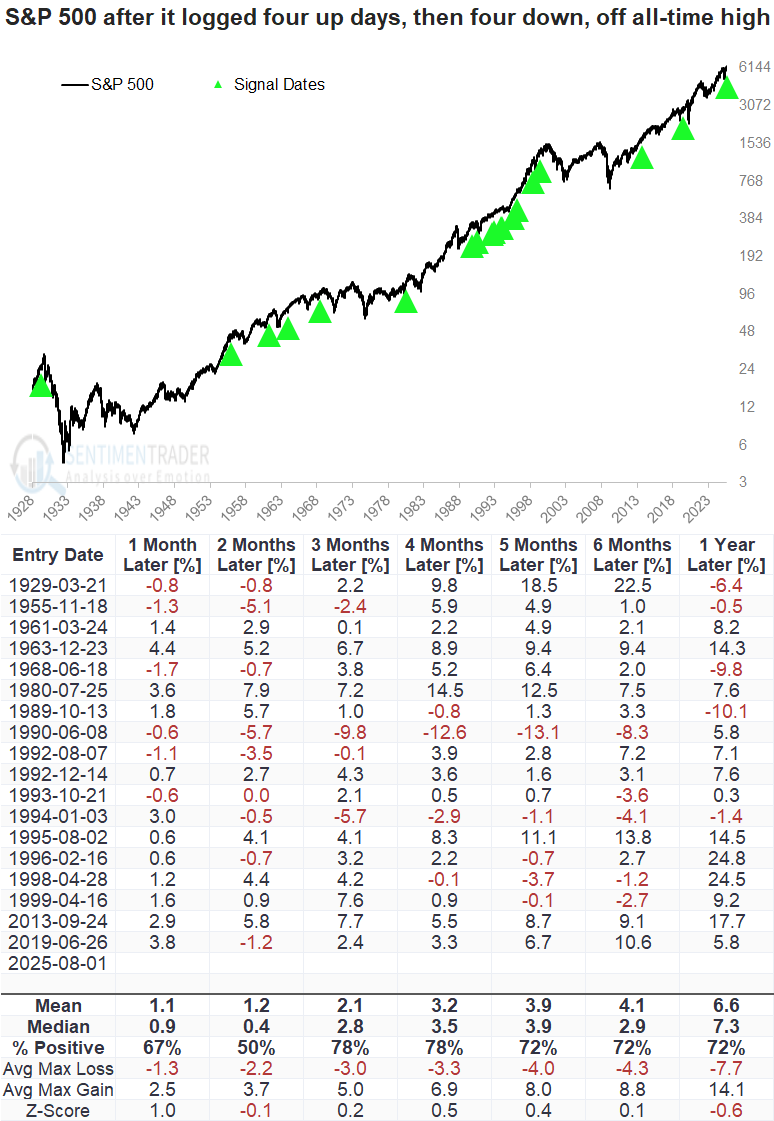
Whenever the S&P 500 saw four up days in a row followed by four down days after hitting a record high, it typically bounced back, rallying 78% of the time over the following three and four months. Moreover, the 1990 precedent was the only case aligned with a significant market top. 

While it's unlikely this pattern represents the start of a correction, given the coin flip win rate at the two-month mark and unfavorable seasonality, one cannot rule out some choppy price action in the next few months. Some signals differ slightly, but you can load and run this test yourself with the Backtest Engine by clicking here.

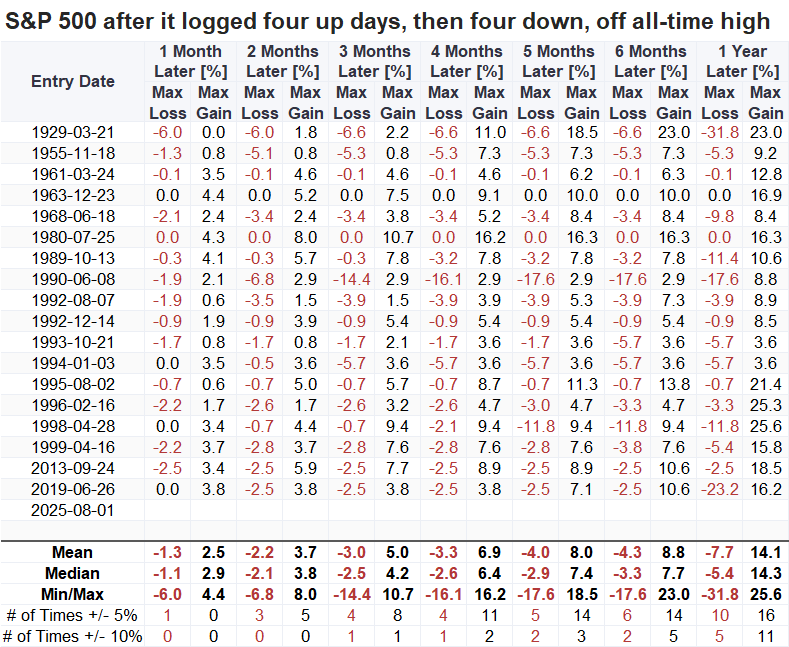
Within the following four months, the S&P 500 experienced just four maximum losses exceeding 5%, and only one surpassed a 10% drop. 

After these price patterns, the next day was a coin flip. However, win rates and returns showed notable improvement in the three to five-day horizons, suggesting a snapback rally.

What if the next day is up or down? 

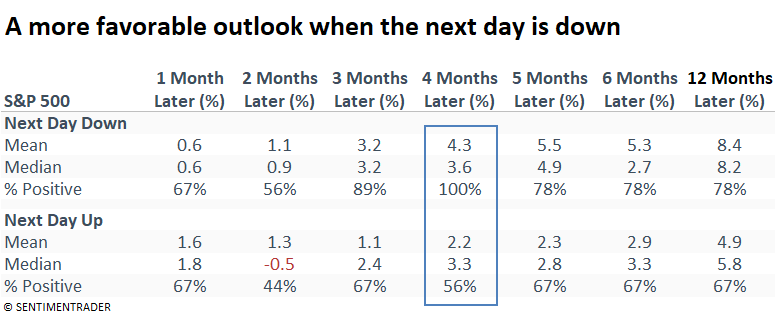
With stocks rebounding today, it's worth examining how the S&P 500 performed depending on whether the day after one of these signals was positive or negative. Interestingly, when the next day is down, the world's most benchmarked index has tended to perform better, rallying 100% of the time over the following four months. 

What the research tells us...

The S&P 500 just exhibited a rare pattern by rising for at least four consecutive days to a record high, only to follow that with four straight days of losses. While this back-to-back shift in momentum may appear ominous on the surface, especially after reaching all-time highs, history suggests it's more reflective of the natural ebb and flow within an uptrend.

In fact, following similar occurrences, the index has rallied over the next three months in 78% of instances, with only one case experiencing a decline of more than 10%. Rather than signaling imminent danger, this pattern often marks a brief consolidation within a broader bullish trend.

PRODUCTS
SentimenTrader
Trading Tools
Indicators & Data API
‍
Strategies & Scanner
‍
Research Reports
FREE
RESOUrCES
Simple Backtest
Calculator
Simple Seasonality
Calculator
The Kelly Criterion
Calculator
Sentiment Geo Map
‍
Public Research Reports
‍
Education
Sentiment Indicators
‍
Technical Indicators
‍
Pricing
Bundle pricing
‍
FAQ
‍
Announcements
‍
COMPANY
‍
About
‍
In the News
‍
Testimonials
‍
Client Success Stories
CONTACT
‍
General Inquiries
‍
Media Inquiries
‍
Financial Professionals Inquiries
‍
© 2026 Sundial Capital Research Inc. All rights reserved.
Setsail Marketing
TermsPrivacyAffiliate Program
Risk Disclosure: The information and tools provided are for research and analytical purposes only and are not intended as investment advice. Market analysis involves uncertainty, and outcomes may differ from expectations. Users should conduct their own due diligence and consider their individual circumstances before making any financial decisions. Past performance is not necessarily indicative of future results.

Hypothetical Performance Disclosure: Hypothetical performance results have many inherent limitations, some of which are described below. No representation is being made that any account will or is likely to achieve profits or losses similar to those shown; in fact, there are frequently sharp differences between hypothetical performance results and the actual results subsequently achieved by any particular trading program. One of the limitations of hypothetical performance results is that they are generally prepared with the benefit of hindsight. In addition, hypothetical trading does not involve financial risk, and no hypothetical trading record can completely account for the impact of financial risk of actual trading. for example, the ability to withstand losses or to adhere to a particular trading program in spite of trading losses are material points which can also adversely affect actual trading results. There are numerous other factors related to the markets in general or to the implementation of any specific trading program which cannot be fully accounted for in the preparation of hypothetical performance results and all which can adversely affect trading results.

Testimonial Disclosure: Testimonials appearing on this website may not be representative of other clients or customers and is not a guarantee of future performance or success.