
Did Tech Just Give Another Buy Signal? Part II

In Part I here, I noted that a reasonably reliable indicator based on ticker XLK (Technology Select Sector SPDR Fund) gave a bullish signal following the selloff on 9/20. I also pointed out that the Annual Seasonal Trend for XLK was still unfavorable for a few more weeks.
In Part II, we will look at two other tickers with better performance results than XLK following the XLK-based breadth signal discussed in Part I.
REUSING SAVED BACKTEST ENGINE SCANS
I detailed the simple steps to "Save" a Backtest Engine scan at the end of Part I. So now I can recall it by:
- Selecting "Tools | Backtest Engine"
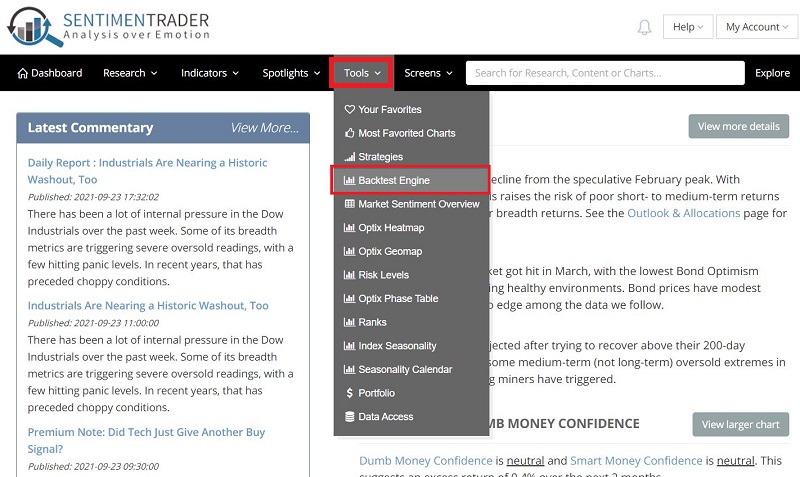
- Clicking the sideways arrow next to the previously saved scan

Clicking this arrow will run the initial test using XLK. For our purposes in this piece, we will focus on the last ten years. The performance results for ticker XLK during this period appear below.
TICKER QQQ
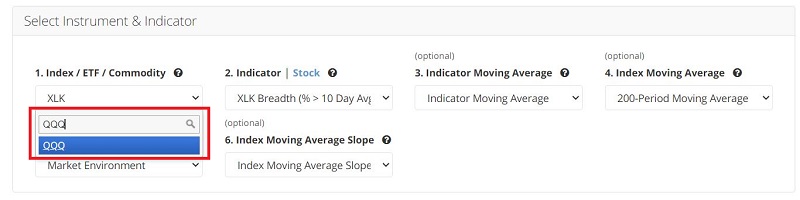
Now let's run the same test with ticker QQQ (Invesco QQQ Trust), which tracks the Nasdaq 100 Index. To do so, we click inside the box for input #1 and type in "QQQ," then click QQQ when it appears below the input box.
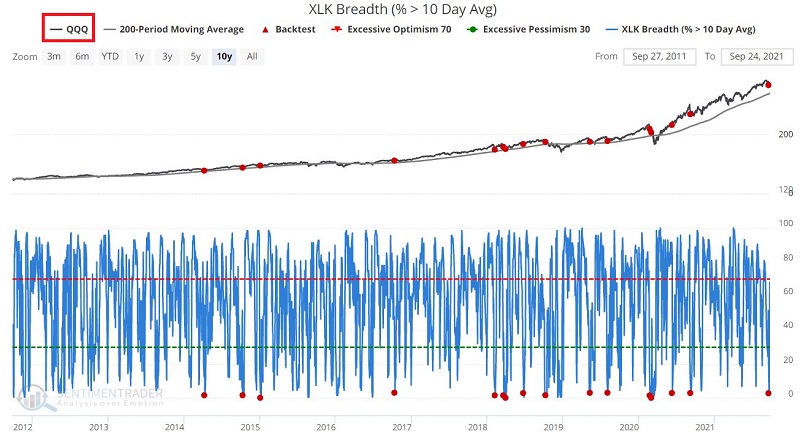
Clicking "Run Backtest" then produces the results chart shown below. In this test, ticker QQQ appears as the price chart in the top clip, and performance results are based on QQQ price action follow XLK-based signals.
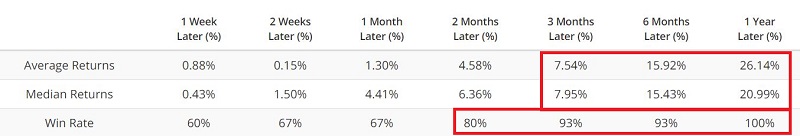
The table below displays the results.
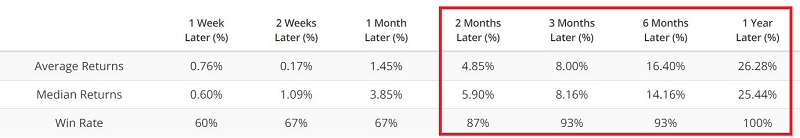
The key things to note are that:
- Performance results using QQQ are very similar to those using XLK (with a 12-month Average Return 5 percentage points higher than XLK)
- Options traders may prefer to focus on QQQ, which has much greater option volume than XLK and much tighter bid/ask spreads
TICKER SMH
As another "tech" alternative, let's now run the same test with ticker SMH (VanEck Vectors Semiconductor ETF), which tracks the MVIS US Listed Semiconductor 25 Index. To do so, we click inside the box for input #1 and type in "SMH," then click SMH when it appears below the input box.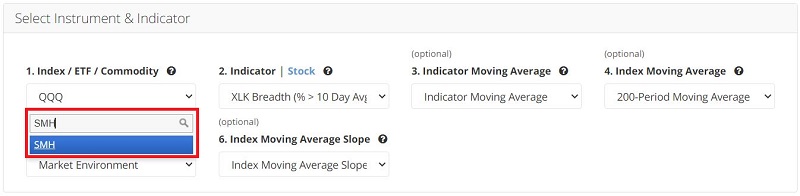
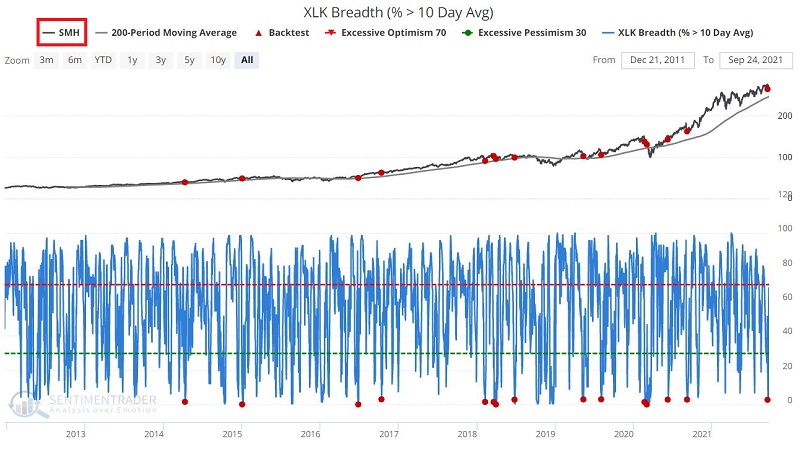
Clicking "Run Backtest" then produces the results chart shown below. In this test, ticker SMH appears as the price chart in the top clip, and performance results are based on SMH price action follow XLK-based signals.
The table below displays the results.
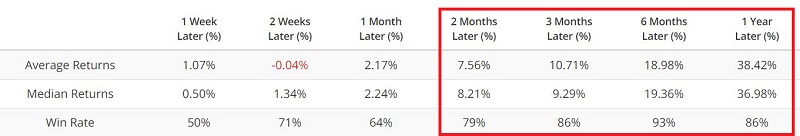
The key things to note are:
- The Win Rate is slightly less robust for SMH versus the other tickers
- However, the Average Returns for 3 to 12 months are significantly higher than the other tickers