Products
SentimenTrader Trading Tools
‍
Backtest Engine
My Trading Toolkit
Correlation Analysis
Seasonality
Indicators & Data API
‍
Proprietary Indicators & Charts
Market Data API
Strategies & Scanner
‍
50+ Trading Strategies
Smart Stock Scanner
Research Reports
‍
Research Solutions
Reports Library
Free Resources
Simple Backtest Calculator
Simple Seasonality Calculator
The Kelly Criterion Calculator
Sentiment Geo Map
Public Research Reports
Pricing
Company
About
In the News
Testimonials
Client Success Stories
Contact
Log inLoginSign up
< BACK TO ALL REPORTS

Did Tech Just Give Another Buy Signal?

Jay Kaeppel
2021-09-23
A simple indicator that looks at the performance of the component stocks for ticker XLK (Technology Select Sector SPDR Fund) has flashed what is typically a favorable sign. At the same time, a particular seasonal tendency stands as a short-term caveat. In this piece, we highlight the details.

In the past decade, the technology sector has been the place to be, especially in the last 2-3 years. Looking forward, half of the pundits seem to think that the tech sector is wildly overvalued and due for a severe whack, while the other half sees nothing but blue skies as the pace of technological advancement continues to accelerate.

Interestingly, one reliable breadth indicator just gave a bullish signal for tech stocks, while one seasonal tendency is currently flashing a short-term warning sign.

XLK Breadth (% > 10-day Avg)

As the name implies, the XLK Breadth (% > 10-day Avg) indicator notes the percentage of ticker XLK (Technology Select Sector SPDR Fund) component stocks currently above their respective 10-day moving average. The chart below displays the indicator along with the price action for ticker XLK for the last three years.

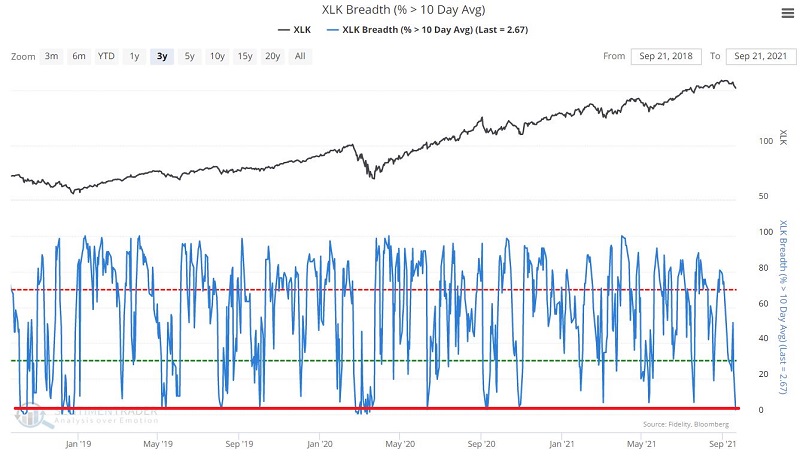
Note that only rarely does the indicator value drop below 3%.

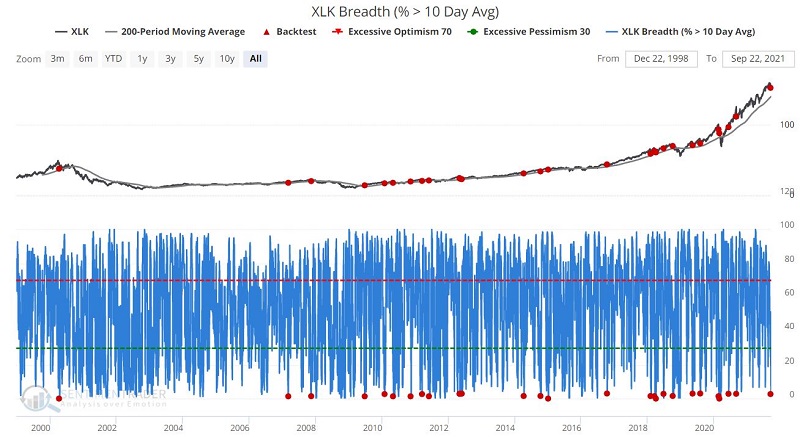
Now let's set up a test using our Backtest Engine (you can run this test by clicking here). For this test, we will look for those times during all of XLK's history when:

  • XLK was above its 200-day moving average (i.e., we want to look for signals only when XLK is already in a quantifiable uptrend)
  • The % of XLK components above their 10-day moving average drops below 3%
  • For the first time in 5 days

All previous signals are noted with a red dot in the chart below.

The table below displays the historical results.
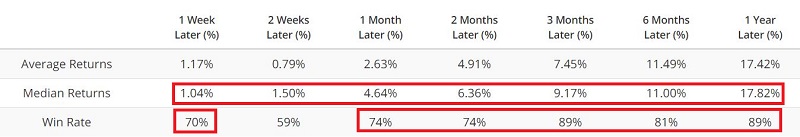
Things to Note:

  • A high percentage of winning trades across the board (except for 2-weeks)
  • Progressively higher Median Returns across each subsequent time frame
  • A new signal occurred on 9/20/2021

Does this new signal mean everything is "All Clear" for the technology sector and that tech stocks are about to embark on another great run to the upside? Not necessarily. Note that the signals in April 2000 and November 2007 were followed by subsequent 12-month XLK declines of -47% and -39%, respectively.

Still, at least until XLK shows some serious sign of breaking down (a drop below the 200-day moving average, perhaps?), tech sector traders might consider giving the bullish case the benefit of the doubt for the time being - with one near-term caveat.

ONE CAVEAT

The Annual Seasonal Trend chart for XLK suggests that tech stock traders might be wise to exhibit patience in the near term.

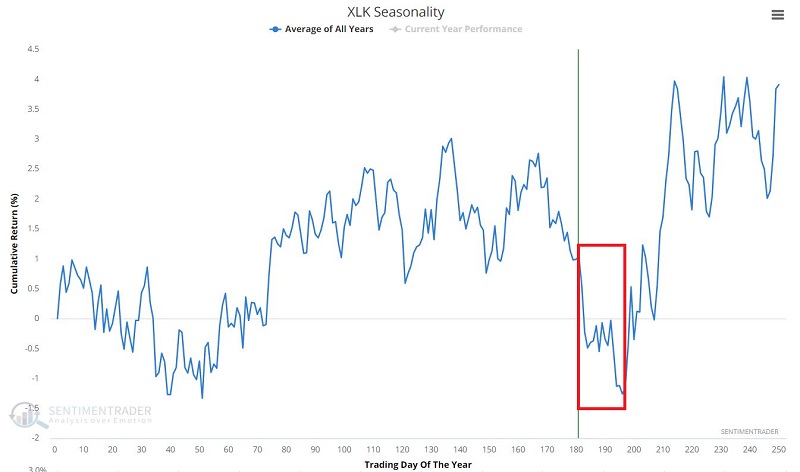
As you can see in the chart above, XLK is entering a period of seasonal weakness.  

The chart below displays the cumulative percentage price performance for XLK from the current Trading Day of the Year through TDY #196.
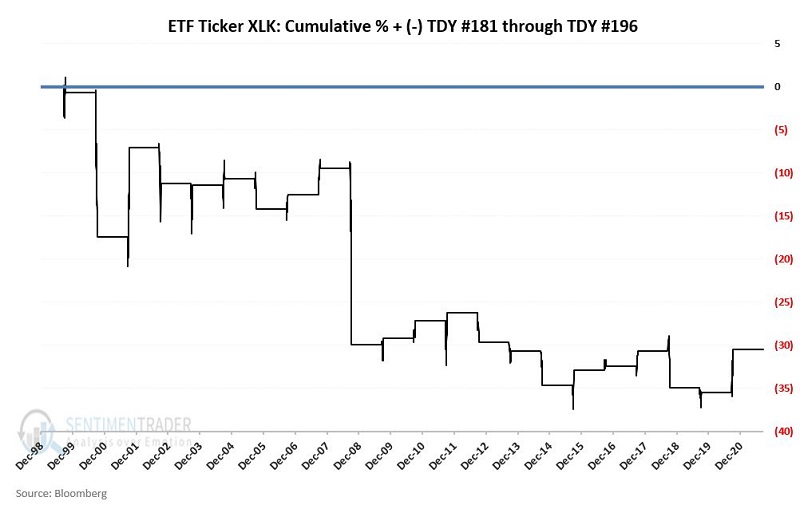
Things to Note:

  • # of times UP = 11
  • # of times DOWN = 11
  • Average UP % = +3.4%
  • Average DOWN % = (-6.3%)

Another pullback by XLK as it nears the seasonal low around Trading Day of the Year #196 - combined with the breadth signal above - could serve as a buying opportunity for tech stock traders.

TO SAVE TO FAVORITES

To save the scan discussed above:

  • Click "Add to Favorites"
  • Enter a Name (ex., "XLK Breath (% > 10-day Avg) crosses below 3%")
  • Click "Save"
PRODUCTS
SentimenTrader
Trading Tools
Indicators & Data API
‍
Strategies & Scanner
‍
Research Reports
FREE
RESOUrCES
Simple Backtest
Calculator
Simple Seasonality
Calculator
The Kelly Criterion
Calculator
Sentiment Geo Map
‍
Public Research Reports
‍
Pricing
Bundle pricing
‍
Announcements
‍
FAQ
COMPANY
‍
About
‍
In the News
‍
Testimonials
‍
Client Success Stories
CONTACT
‍
General Inquiries
‍
Media Inquiries
‍
Financial Professionals Inquiries
‍
© 2025 Sundial Capital Research Inc. All rights reserved.
Setsail Marketing
TermsPrivacyAffiliate Program
Risk Disclosure: Futures and forex trading contains substantial risk and is not for every investor. An investor could potentially lose all or more than the initial investment. Risk capital is money that can be lost without jeopardizing ones’ financial security or life style. Only risk capital should be used for trading and only those with sufficient risk capital should consider trading. Past performance is not necessarily indicative of future results.

Hypothetical Performance Disclosure: Hypothetical performance results have many inherent limitations, some of which are described below. No representation is being made that any account will or is likely to achieve profits or losses similar to those shown; in fact, there are frequently sharp differences between hypothetical performance results and the actual results subsequently achieved by any particular trading program. One of the limitations of hypothetical performance results is that they are generally prepared with the benefit of hindsight. In addition, hypothetical trading does not involve financial risk, and no hypothetical trading record can completely account for the impact of financial risk of actual trading. for example, the ability to withstand losses or to adhere to a particular trading program in spite of trading losses are material points which can also adversely affect actual trading results. There are numerous other factors related to the markets in general or to the implementation of any specific trading program which cannot be fully accounted for in the preparation of hypothetical performance results and all which can adversely affect trading results.

Testimonial Disclosure: Testimonials appearing on this website may not be representative of other clients or customers and is not a guarantee of future performance or success.