Data &
Technology
Research
Reports
Report Solutions
Reports Library
Actionable
Strategies
Free
Resources
Simple Backtest Calculator
Simple Seasonality Calculator
The Kelly Criterion Calculator
Sentiment Geo Map
Public Research Reports
Free Webinar
Pricing
Company
About
Meet Our Team
In the News
Testimonials
Client Success Stories
Contact
Log inLoginSign up
< BACK TO ALL REPORTS

Despite losses, investors borrow more against stocks

Jason Goepfert
2020-10-27
In September, investors borrowed more against their stock holdings, despite those holdings losing value. As a result, total margin debt increased to a near-record level, jumping more than 35% from the spring lows.

Investors have become pretty willing to borrow against the value of their brokerage accounts.

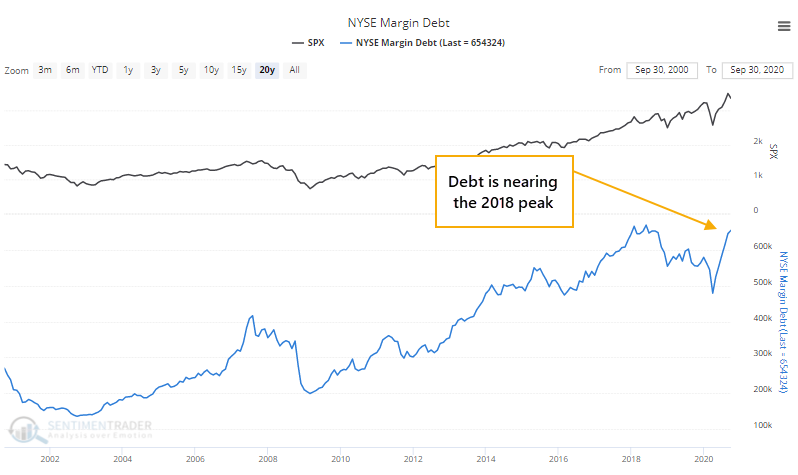
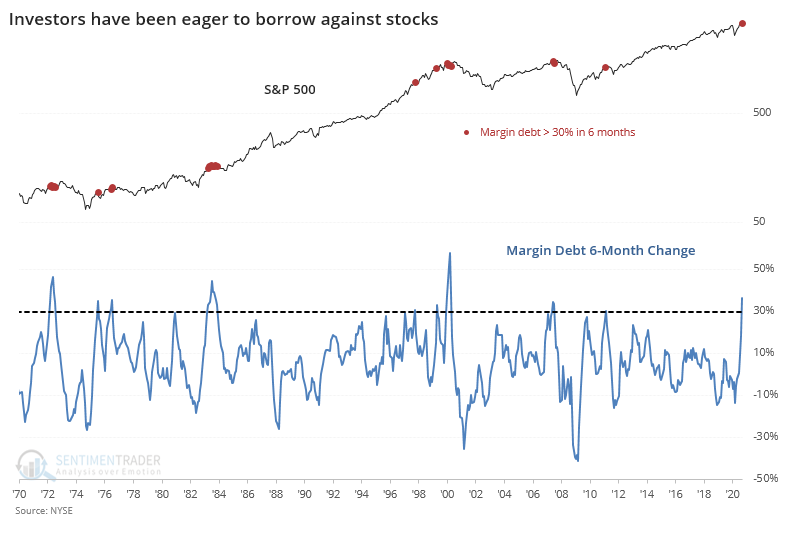
The latest margin debt figures show that investors have pledged more than $650 billion against their stock holdings as of September. That's up more than 35% from the low in March and is nearing a record high.

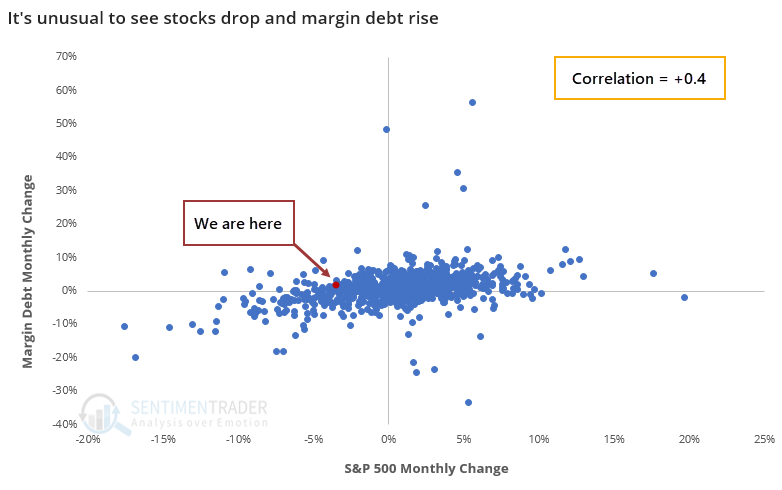
This is unusual because in September stocks fell and yet borrowings against those holdings increased.

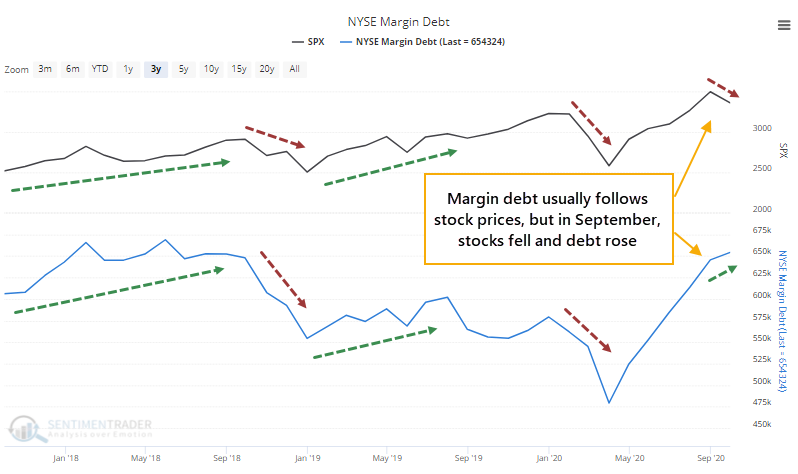
Over the past 70 years, it has been unusual to see the monthly percentage change in the S&P 500 differ much from the change in margin debt. There's a fairly high positive correlation between the two, which September violated.

A knee-jerk contrarian would assume this is a bad thing. It suggests that investors are complacent, too willing to increase their leverage despite a market that's not going their way. But it hasn't really proven out that way.

Clearly, there were some trouble spots - most notably in 1987, 2000, and 2007, when longer-term returns suffered greatly. Those were also times when debt had jumped by a large amount, and quickly.

Over the past 6 months, margin debt has jumped by more than 35%, one of the largest rates-of-change since 1950.

That was most definitely not a good sign in 2000 and 2007, but as we've discussed multiple times in recent years, that was coming from a higher base, and the growth in debt was far ahead of the growth rate in stocks. Neither is the case this time around.

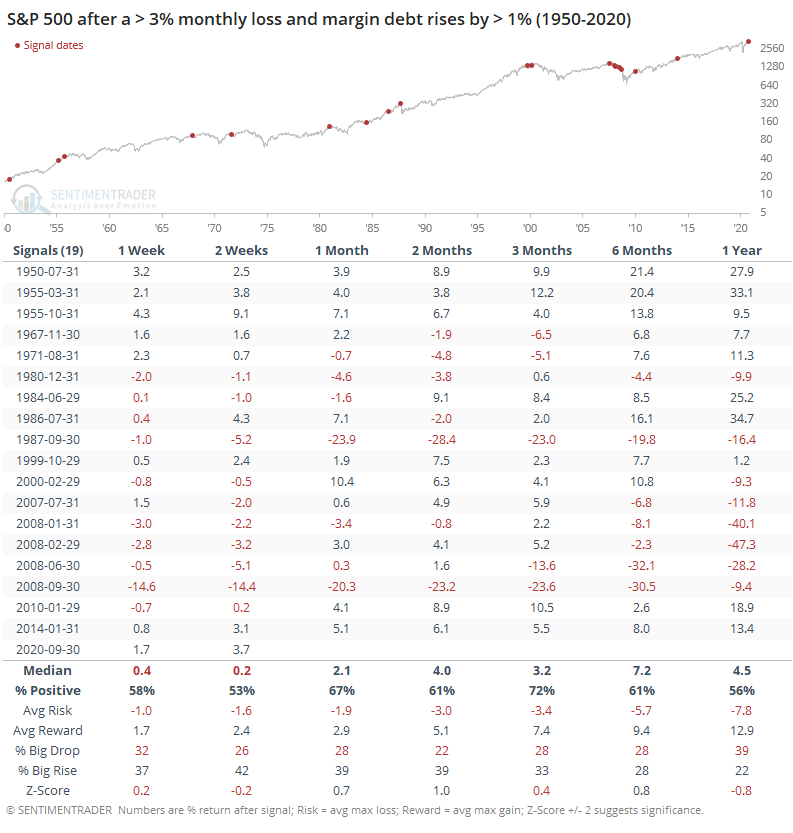
Below, we can see the S&P's future returns when debt jumped by more than 25% when it was coming off at least a 3-year low.

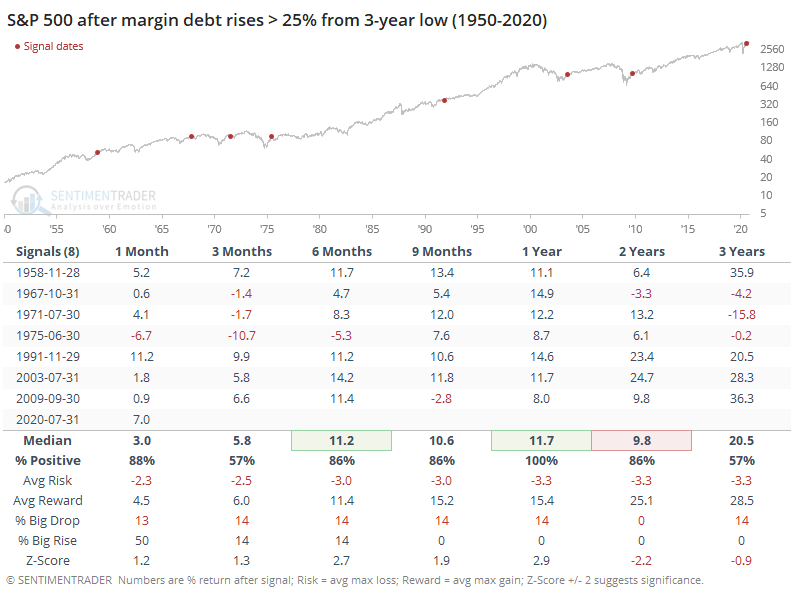
This context is important, as it more accurately reflects investor sentiment at the time. In these cases, stocks had a strong tendency to rally over the next 6-12 months, with no large failures. The risk/reward was skewed impressively to the "reward" side, though there was not a strong bias toward seeing an abnormally large rise versus fall across most time frames.

We'd be more inclined to consider the latest margin debt data as a positive for stocks going forward, but because the rate of change has been so high, and it's so near the prior record level, there are enough concerns that it likely shouldn't be included in the Active Studies.

Sorry, you don't have access to this report

Upgrade your subscription plan to get access
Go to Dasboard
DATA &
TECHnologies
IndicatorEdge
‍
BackTestEdge
‍
Other Tools
‍
DataEdge API
RESEARCH
reports
Research Solution
‍
Reports Library
‍
actionable
Strategies
Trading Strategies
‍
Smart Stock Scanner
‍
FREE
RESOUrCES
Simple Backtest
Calculator
Simple Seasonality
Calculator
The Kelly Criterion
Calculator
Sentiment Geo Map
‍
Public Research Reports
‍
Free Webinar
COMPANY
‍
About
‍
Meet our Team
‍
In the News
‍
Testimonials
‍
Client Success Stories
Pricing
Bundle pricing
‍
Announcements
‍
FAQ
© 2024 Sundial Capital Research Inc. All rights reserved.
Setsail Marketing
TermsPrivacyAffiliate Program
Risk Disclosure: Futures and forex trading contains substantial risk and is not for every investor. An investor could potentially lose all or more than the initial investment. Risk capital is money that can be lost without jeopardizing ones’ financial security or life style. Only risk capital should be used for trading and only those with sufficient risk capital should consider trading. Past performance is not necessarily indicative of future results.

Hypothetical Performance Disclosure: Hypothetical performance results have many inherent limitations, some of which are described below. No representation is being made that any account will or is likely to achieve profits or losses similar to those shown; in fact, there are frequently sharp differences between hypothetical performance results and the actual results subsequently achieved by any particular trading program. One of the limitations of hypothetical performance results is that they are generally prepared with the benefit of hindsight. In addition, hypothetical trading does not involve financial risk, and no hypothetical trading record can completely account for the impact of financial risk of actual trading. for example, the ability to withstand losses or to adhere to a particular trading program in spite of trading losses are material points which can also adversely affect actual trading results. There are numerous other factors related to the markets in general or to the implementation of any specific trading program which cannot be fully accounted for in the preparation of hypothetical performance results and all which can adversely affect trading results.

Testimonial Disclosure: Testimonials appearing on this website may not be representative of other clients or customers and is not a guarantee of future performance or success.