Products
SentimenTrader Trading Tools
‍
Backtest Engine
My Trading Toolkit
Correlation Analysis
Seasonality
Market Prediction
Indicators & Data API
‍
Proprietary Indicators & Charts
Market Data API
Strategies & Scanner
‍
50+ Trading Strategies
Smart Stock Scanner
Smart Option Scanner
Research Reports
‍
Research Solutions
Reports Library
Free Resources
Simple Backtest Calculator
Simple Seasonality Calculator
The Kelly Criterion Calculator
Sentiment Geo Map
Public Research Reports
Education
Sentiment Indicators
Technical Indicators
Pricing
Company
About
In the News
Testimonials
Client Success Stories
Contact
Log inLoginSign up
< BACK TO ALL REPORTS

Defensive Stocks Dominate The New High List - Does It Matter?

Jason Goepfert
2019-06-12
null

A defensive new high list

Across the equity market, securities at a 52-week high have expanded. Same goes for companies within the S&P 500. And within that index, it’s been more of the defensive sectors that have seen the best participation.

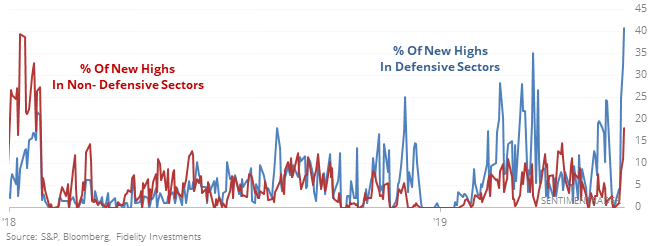
While that suggests a potentially worrisome risk-off mentality, it has not been a bad sign. The S&P 500's forward returns were good, and generally better than times when non-defensive sectors dominated the new highs.

As far as the sectors themselves go, there wasn’t a clear bias toward either one. When defensive sectors dominated the new-high list, those sectors tended to outperform non-defensive sectors, but it was mixed.

A week to remember

The tech sector was languishing at a multi-month low a week ago and has since put in its best week in years.

Since 1928, this kind of rapid change in sentiment has been a good kick-start, especially in recent decades. It was better when it triggered during healthy markets, like this one, depending on how we define "healthy."

Housing pattern

According to the ETF Seasonality list, the worst performing fund in June is the XHB housing fund, with an average return of -4.3%. It has followed its typical seasonal path almost perfectly so far this year, potentially an issue as its 3-day Optimism Index climbed above 70.

Bond hedges

As bonds have rallied, options traders in the TLT fund have built up an inventory of put options. The Put/Call Open Interest Ratio is showing they’re now holding 200 puts for every 100 calls. Since the financial crisis, TLT has struggled to hold gains when this many puts were outstanding. When the OI ratio was below 0.75, however, TLT was higher 3 months later after 87 out of 88 days per the Backtest Engine.

This post was an abridged version of our previous day's Daily Report. For full access, sign up for a 30-day free trial now.

PRODUCTS
SentimenTrader
Trading Tools
Indicators & Data API
‍
Strategies & Scanner
‍
Research Reports
FREE
RESOUrCES
Simple Backtest
Calculator
Simple Seasonality
Calculator
The Kelly Criterion
Calculator
Sentiment Geo Map
‍
Public Research Reports
‍
Education
Sentiment Indicators
‍
Technical Indicators
‍
Pricing
Bundle pricing
‍
FAQ
‍
Announcements
‍
COMPANY
‍
About
‍
In the News
‍
Testimonials
‍
Client Success Stories
CONTACT
‍
General Inquiries
‍
Media Inquiries
‍
Financial Professionals Inquiries
‍
© 2026 Sundial Capital Research Inc. All rights reserved.
Setsail Marketing
TermsPrivacyAffiliate Program
Risk Disclosure: The information and tools provided are for research and analytical purposes only and are not intended as investment advice. Market analysis involves uncertainty, and outcomes may differ from expectations. Users should conduct their own due diligence and consider their individual circumstances before making any financial decisions. Past performance is not necessarily indicative of future results.

Hypothetical Performance Disclosure: Hypothetical performance results have many inherent limitations, some of which are described below. No representation is being made that any account will or is likely to achieve profits or losses similar to those shown; in fact, there are frequently sharp differences between hypothetical performance results and the actual results subsequently achieved by any particular trading program. One of the limitations of hypothetical performance results is that they are generally prepared with the benefit of hindsight. In addition, hypothetical trading does not involve financial risk, and no hypothetical trading record can completely account for the impact of financial risk of actual trading. for example, the ability to withstand losses or to adhere to a particular trading program in spite of trading losses are material points which can also adversely affect actual trading results. There are numerous other factors related to the markets in general or to the implementation of any specific trading program which cannot be fully accounted for in the preparation of hypothetical performance results and all which can adversely affect trading results.

Testimonial Disclosure: Testimonials appearing on this website may not be representative of other clients or customers and is not a guarantee of future performance or success.