
Defensive sectors are leading the market

Key points:
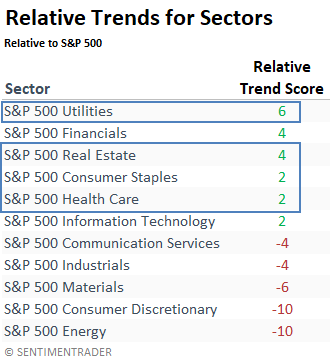
- Consumer Staples, Healthcare, Real Estate, and Utilities are exhibiting positive relative trend scores
- Similar relative trend profiles for defensive sectors suggest stock indexes could stall over the next month
- Defensive groups tended to outperform the broad market in the near term
Does leadership in defensive sectors signal trouble for the broader market?
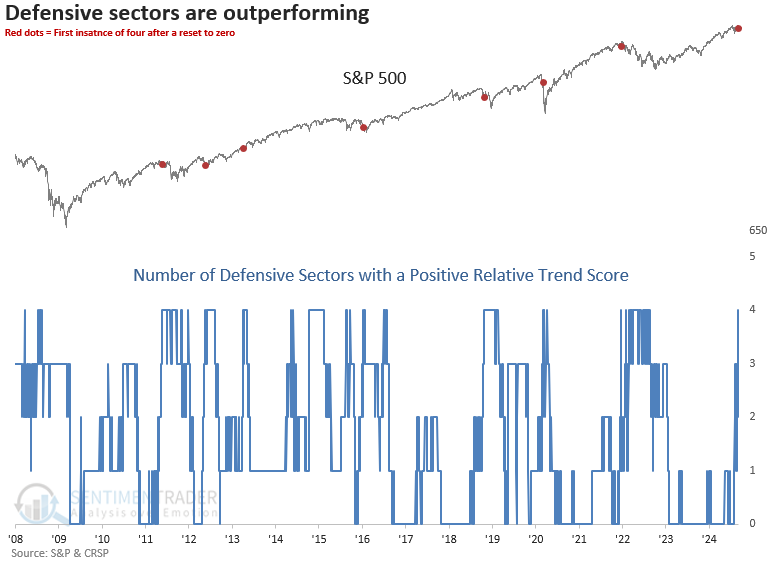
Over the past month, I've shared my absolute and relative trend scores for sectors in multiple research notes. Aside from Technology, which has recently stumbled, the groups with positive relative trend scores were concentrated mainly in defensive areas like Real Estate and Utilities-a trend I suggested might be influenced by a softening in interest rates.
With stocks losing momentum in recent weeks after a strong rally, relative trend scores for defensive sectors have risen, resulting in Consumer Staples and Healthcare joining Real Estate and Utilities in the positive category.
For the first time since December 2021, relative trend composites for Consumer Staples, Healthcare, Real Estate, and Utilities displayed a positive score in unison.
On Monday, the Healthcare sector's relative trend score rose to 2, aligning it with other defensive-oriented groups in positive territory.
Financials continue to hold a positive score. As I've highlighted multiple times, this group has a strong track record of signaling impending trouble ahead of significant corrections or bear markets when its relative trend has been decidedly negative for an extended period, which is not the case now.
Similar relative trend profiles preceded a short-term pause
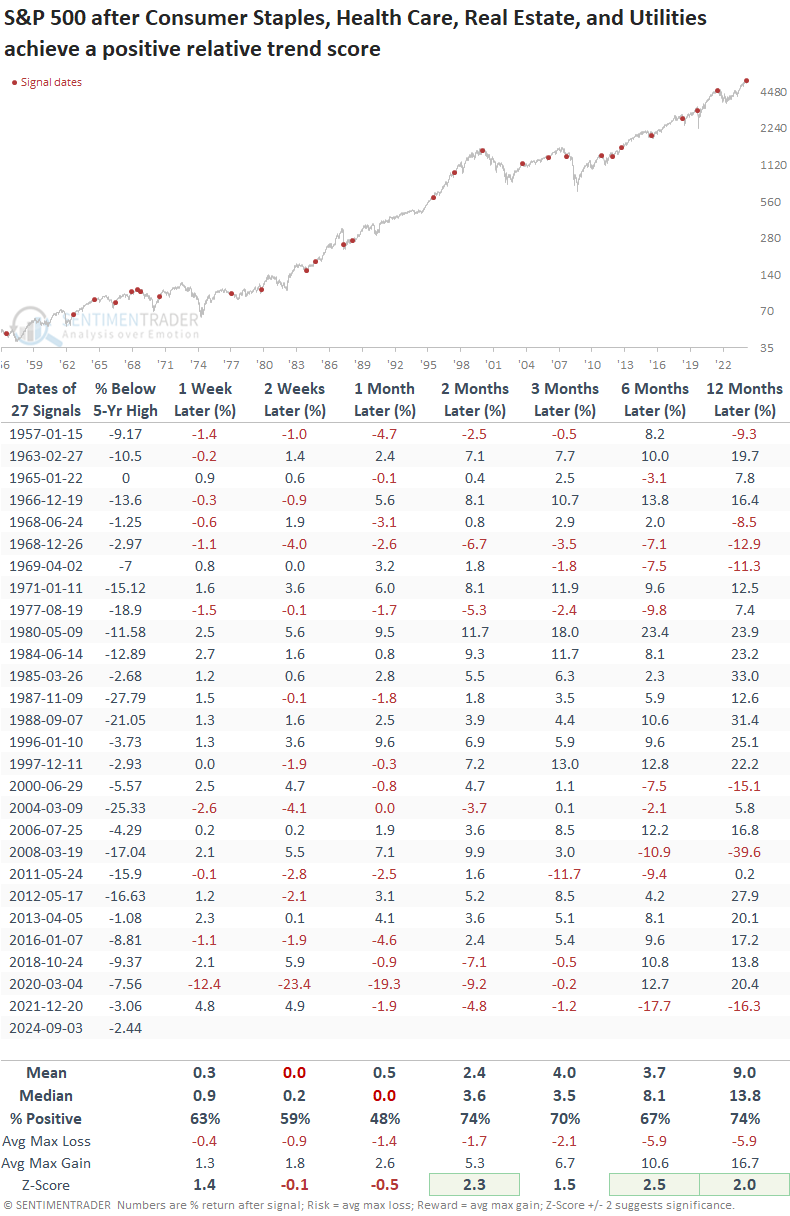
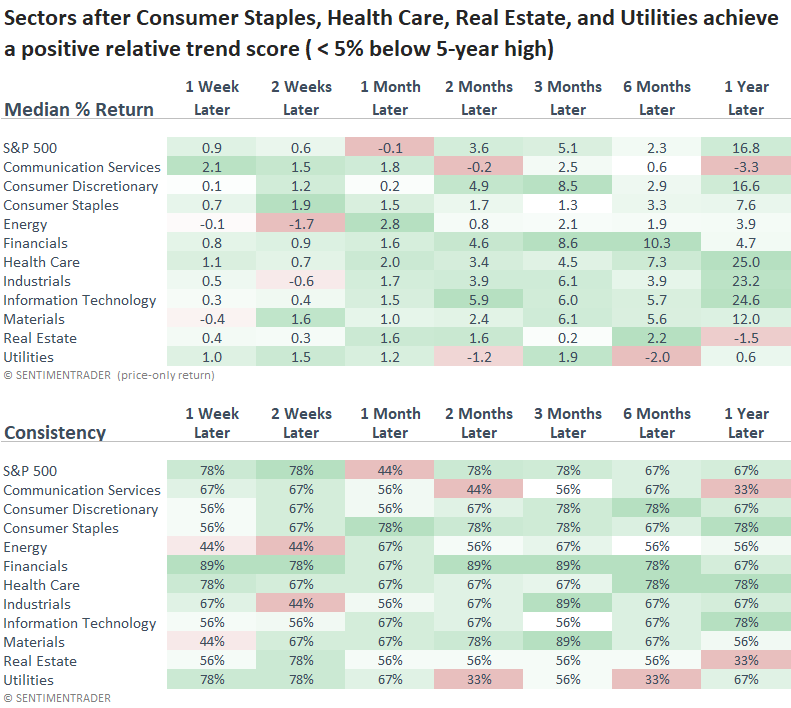
Typically, when all four defensive-oriented groups showed a positive relative trend score, the S&P 500 had already entered a correction, as reflected in the percentage below the 5-year high column in the outlook table. During this phase, the world's most benchmarked index often remained flat over the following month. However, after this consolidation period, the index rebounded over medium and long-term periods, exhibiting significance in several horizons.
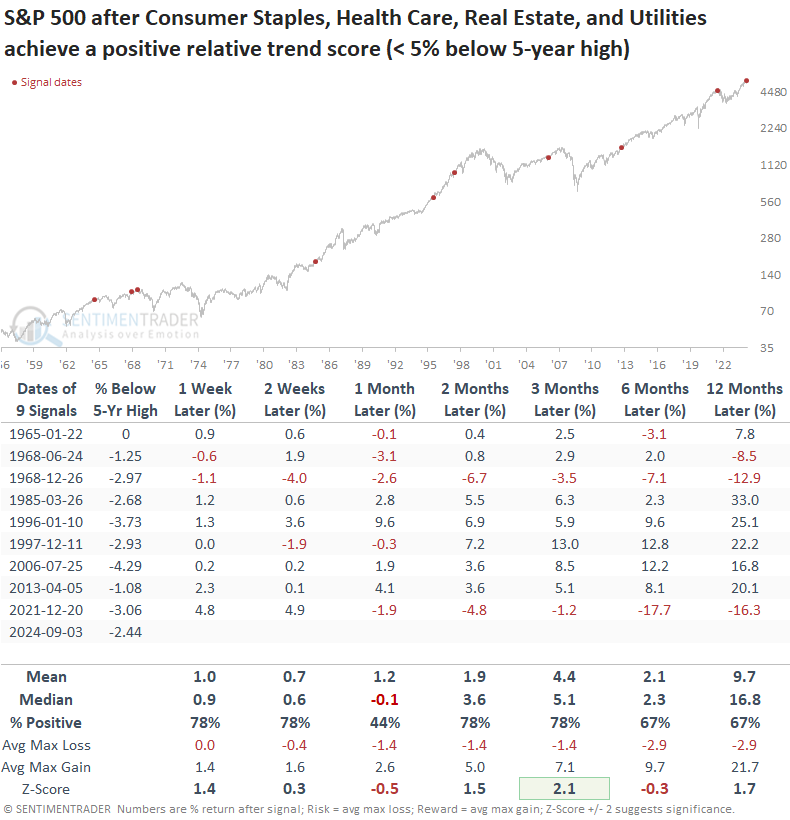
Suppose I isolate precedents when the S&P 500 closed within 5% of a 5-year high, providing context similar to now. In that case, the S&P 500 still tended to consolidate over the subsequent month and then rally over medium and long-term time frames. Because these signals occurred near a high, only the three-month interval showed significance relative to random returns.
Over the following month, all four defensive sectors outpaced the S&P 500. Furthermore, Healthcare extended its strong performance, delivering the highest annual return among all sectors.
An absence of supporting evidence
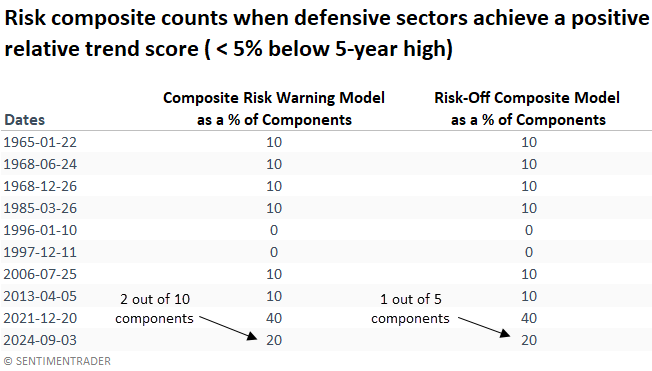
The positive relative trend backdrop for defensive sectors could be due to a softening in interest rates, a weakening economy, or uncertainty ahead of the election. If a significant correction or economic contraction were imminent, market breadth indicators would be flashing warning signs. However, that's not the case, as my risk models display low signal counts.
Please note the 40% signal count in December 2021, a period when defensive leadership coincided with weak market breadth.
A potential election scenario
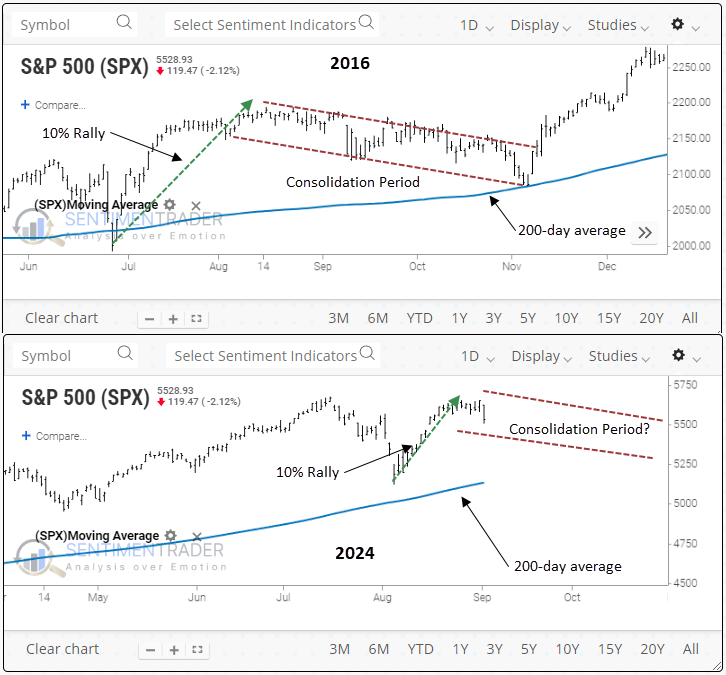
The 2016 lead-up to the election is an interesting analogy that could play out again in 2024. The S&P 500 rallied 10% (several thrust signals occurred) from the June low to the peak in mid-August. Subsequently, the index entered a choppy consolidation period that saw the world's most benchmarked index fall roughly -5% on a peak-to-trough basis.
A similar consolidation above the 200-day average would not be surprising as buyers will likely go on strike given election uncertainty.
A potential FOMC scenario
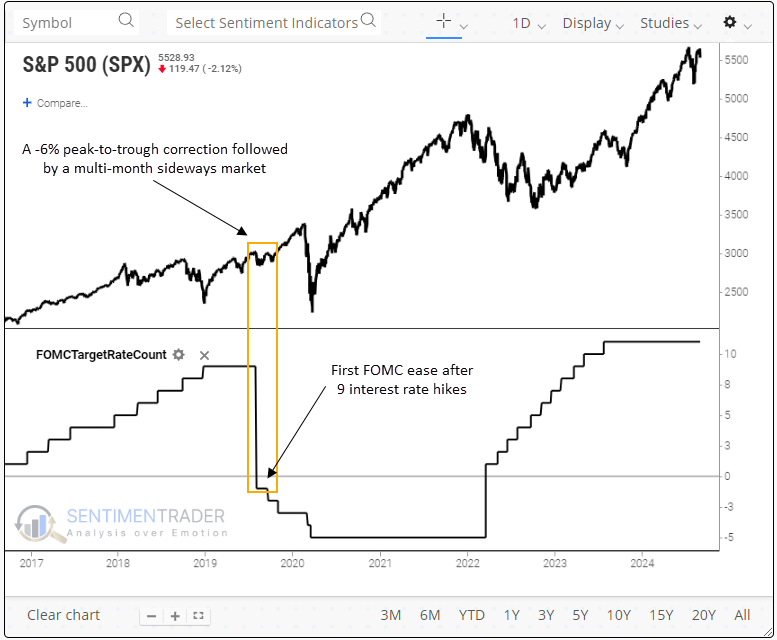
Following the previous FOMC interest rate hiking cycle, the S&P 500 declined slightly over 6% on a peak-to-trough basis and subsequently moved sideways for a few months. Therefore, a buy-the-rumor, sell-the-event scenario should not be ruled out should the Fed ease in September.
What the research tells us...
Stock market leadership has taken a decidedly defensive tone, likely driven by multiple factors. Periods when defensive sectors led relative to the S&P 500 often resulted in a temporary stock pause, typically reflecting a consolidation within a broader uptrend. Although investors should consider all potential outcomes, current market breadth indicators do not fully support this defensive tone. Nevertheless, significant upcoming events, such as the September FOMC meeting and the election, could further support the possibility of a consolidation phase.