
Defensive sector insiders are sending a message

Key points
- There has been some notable action among corporate insiders in specific sectors
- The bad news is that the sectors in question are the ones that most investors think of as "defensive"
- Still, the message might not be to get more defensive on the overall market but to look more closely for opportunities in the sectors highlighted below
The Materials sector
The Materials Select Sector SPDR Fund (ticker XLB) tracks the S&P 500 Materials Sector Index. The chart below highlights those dates when the Corporate Insider Buy/Sell Ratio - XLB indicator was above 0.35.
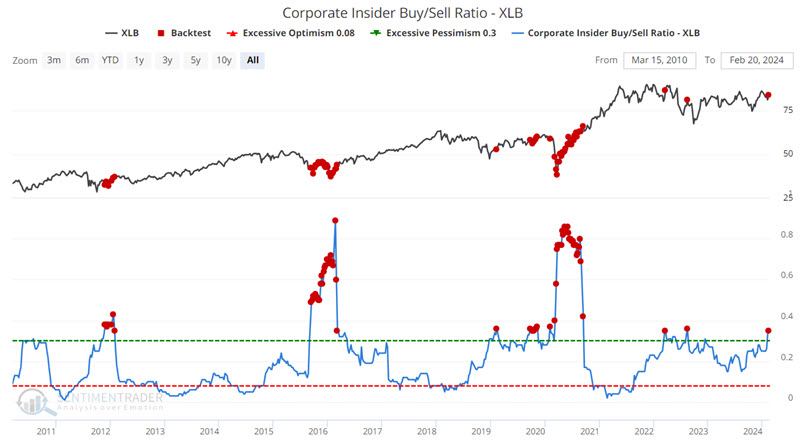
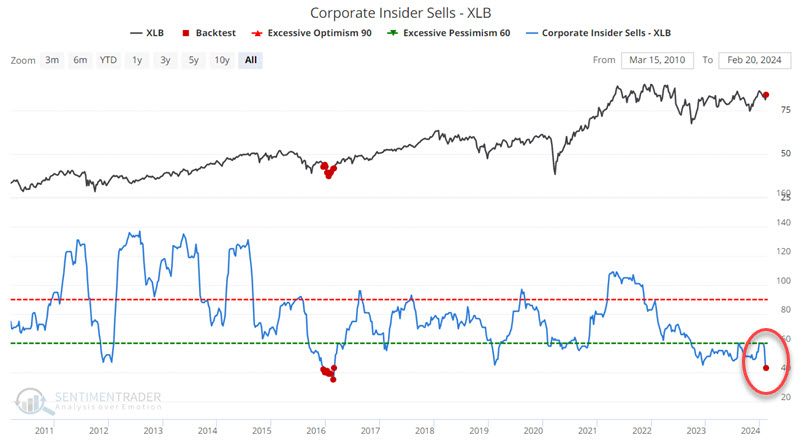
In recent months, the driving force in the Buy/Sell ratio has been the absence of selling among XLB insiders. The chart below highlights those dates when the Corporate Insider Sells - XLB indicator was at or below 43. In the past 14 years, the indicator has reached this level only once before.
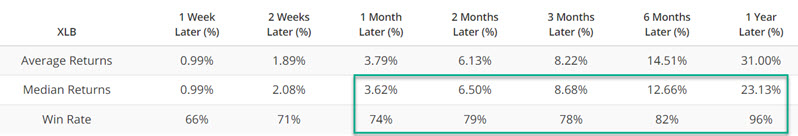
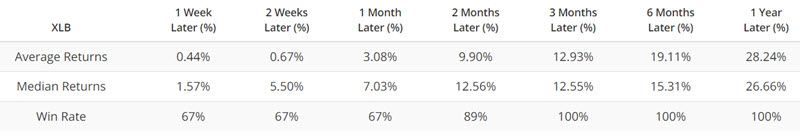
As you can see in the results below - while the numbers appear compelling, the sample size is far too small to draw any meaningful conclusions from. Still, when insider selling dries up, it intuitively suggests a collective lack of bearishness among the individuals who know their companies best.
The Consumer Staples sector
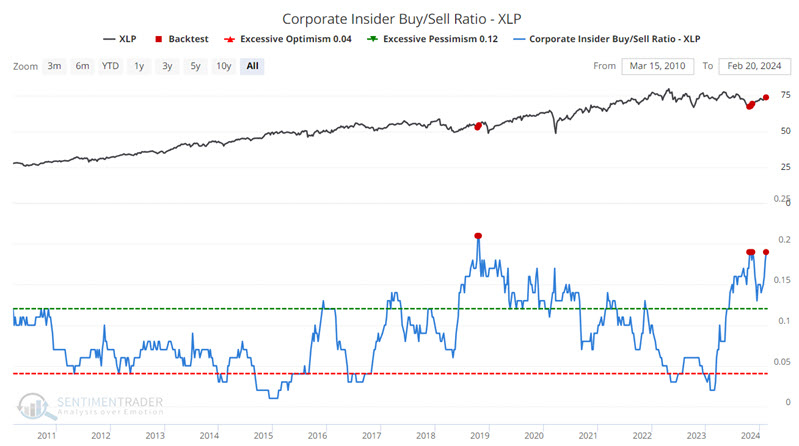
The Consumer Staples Select Sector SPDR Fund (ticker XLP) tracks the S&P 500 Consumer Staples Sector Index. The Corporate Insider Buy/Sell Ratio - XLP indicator recently spiked to its second-highest reading in the past 14 years.
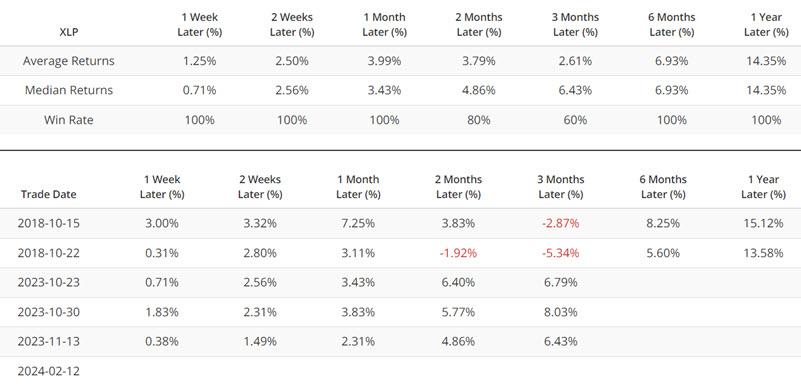
The chart below highlights those dates when the Corporate Insider Buy/Sell Ratio - XLP was above 0.19. Once again, the sample size is tiny, so there is a risk in making any projections based on prior results. Nevertheless, one-sided insider activity has historically been a valuable weight of the evidence sign for investors to pay attention to.
Once again, a lack of selling is the driving force. The chart below highlights the Corporate Insider Sells - XLP indicator. As you can see, insider selling has plunged to the lowest level recorded in this particular Bloomberg database.
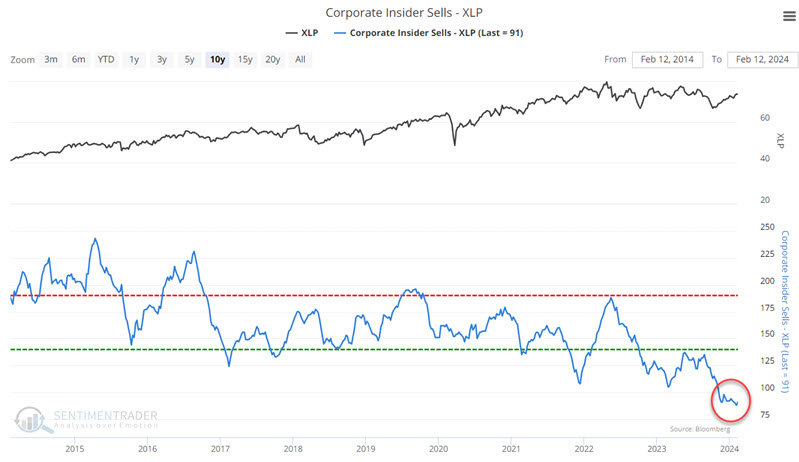
An actual significant and prolonged spike in insider buying is the most bullish sign insiders can convey. Barring that, an absence of insider selling suggests that - while insiders may not be piling in anticipating an imminent rally - they are seemingly not terribly concerned in the aggregate about downside risk.
The Health Care sector
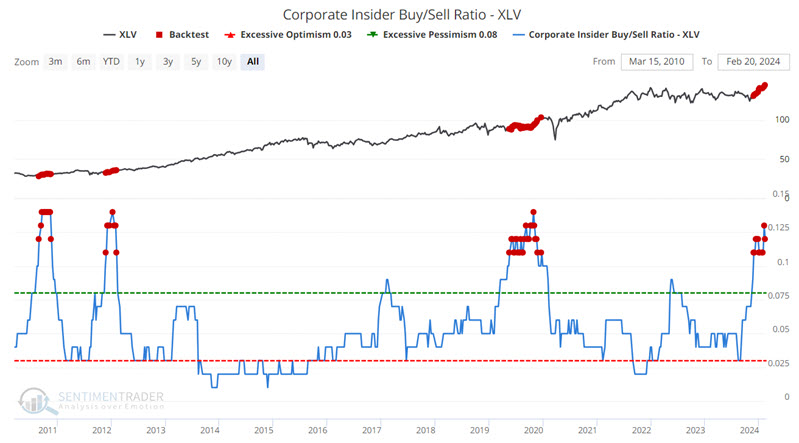
The Health Care Select Sector SPDR Fund (ticker XLV) tracks the S&P 500 Health Care Sector Index. The Corporate Insider Buy/Sell Ratio - XLP indicator has experienced a significant spike in recent months, accompanied by a breakout to all-time highs for the ETF itself.
The chart below highlights those dates when the Corporate Insider Buy/Sell Ratio - XLP was above 0.11.
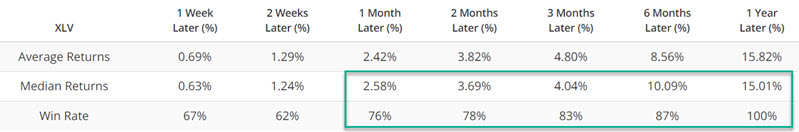
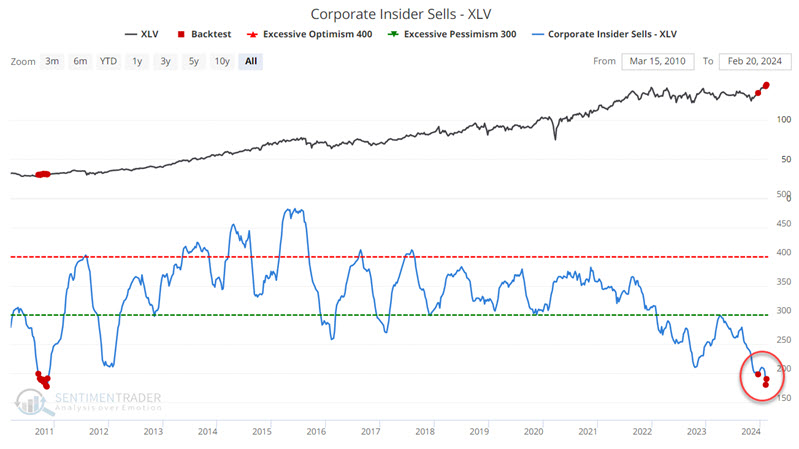
As with the other sectors highlighted above, healthcare insiders have seemingly gone on a selling strike, as shown in the chart below.
The Utilities sector
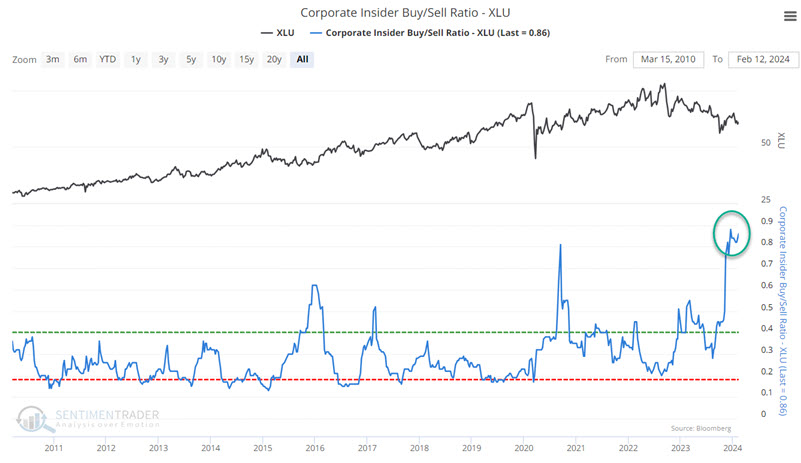
The Utilities Select Sector SPDR Fund (ticker XLU) tracks the S&P 500 Utilities Sector Index. Utilities are generally considered the most defensive sector among the major S&P 500 sectors. Utilities have also been the worst-performing sector in 2024 and have traded sideways for roughly four and a half years. This is enough to make most investors look elsewhere for opportunities. However, utility sector corporate insiders are apparently seeing something very different.
The chart below shows that the Corporate Insider Buy/Sell Ratio - XLU indicator is just below the highest reading recorded in this particular Bloomberg database. Does this guarantee higher utility stock prices directly ahead? Not necessarily. But the bottom line is that, on the whole, utility executives are more bullish now than they have been at any time in the last 14 years.
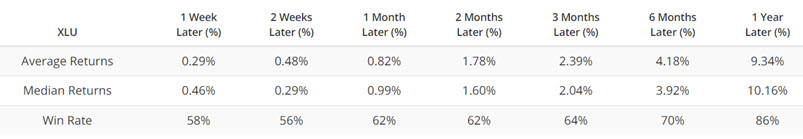
The chart and table below highlight XLU performance after those dates when the Corporate Insider Buys - XLU indicator was at 25 or above.
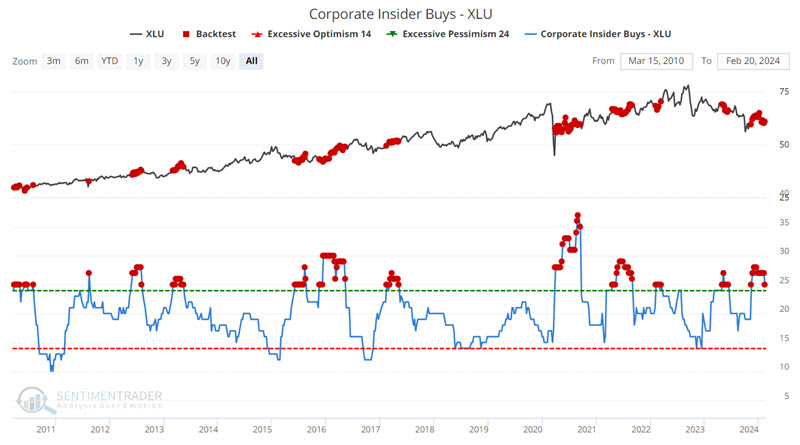
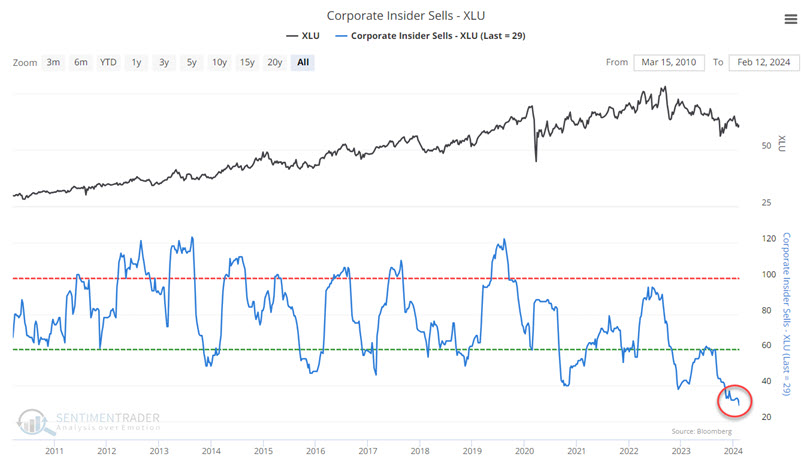
Interestingly - and like the other sectors highlighted above - insider selling among utility insiders has dried up to the lowest level recorded in this particular Bloomberg database of insider activity.
What the research tells us…
The bottom line is straightforward: Insider activity among the market's most defensive sectors has recently skewed far to the favorable side. Many investors and pundits view bullishness among defensive sectors as a mixed or bearish sign for the overall stock market, as defensive sectors tend to lag in a bull market and lead in a bear market. However, taking the information above as a bearish warning seems off a bit. Instead of taking this as a bearish sign for the overall market, looking at potential opportunities in the sectors highlighted above might be a better take. Within a bull market, there is often rotation among leading sectors. None of the information highlighted above guarantees that these sectors will become the new market leaders anytime soon. Still, where there is decisively favorable insider activity, there is typically opportunity.