
Defensive and commodity-oriented sectors drive the expansion in 4-week lows

Key points:
- Defensive and commodity-oriented sectors, not cyclical groups, are driving the expansion in 4-week lows
- Similar market breadth conditions suggest the backdrop for the broad market remains constructive
- While some short-term breadth indicators deteriorate, the long-term backdrop remains constructive
A Tale of Two Tapes
Two components of the Risk-Off Composite Model recently triggered warnings, suggesting a deterioration in short-term market breadth indicators.
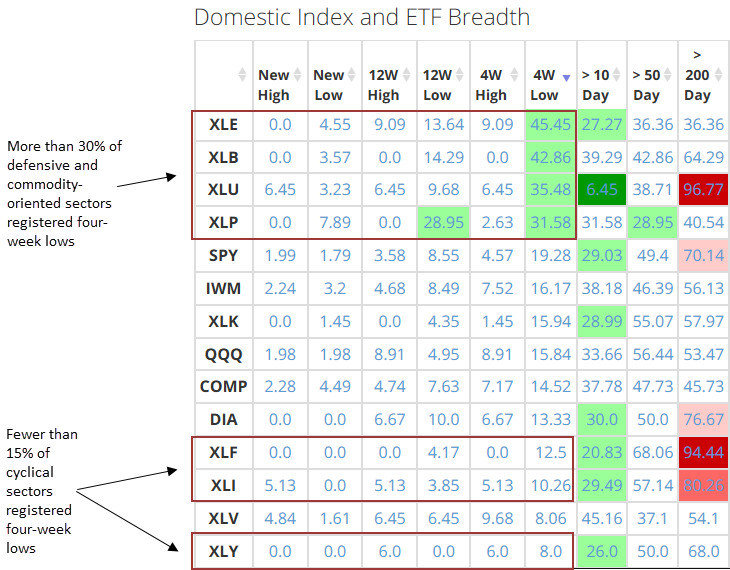
One of the models tracks the spread between 4-week highs and lows, detecting an expansion in lows relative to highs, which is typically an unfavorable scenario. However, upon analyzing the data, I observed that the recent rise in new lows predominantly stems from defensive and commodity-focused sectors rather than cyclical groups, as shown in the table below and available on our website under spotlights on breadth.
With defensive groups like staples and utilities showing over 30% of their stocks hitting a 4-week low, while cyclical sectors such as financials and industrials have fewer than 15% of stocks at similar lows, I couldn't help but wonder when we've seen this pattern before and what it might indicate for the broader market.
While it's difficult to attribute specific drivers to daily or weekly market gyrations, one possible explanation for the uptick in new lows among defensive groups is the sharp rise in the 10-year Treasury yield. This scenario has negatively influenced stocks with higher yields in the past.
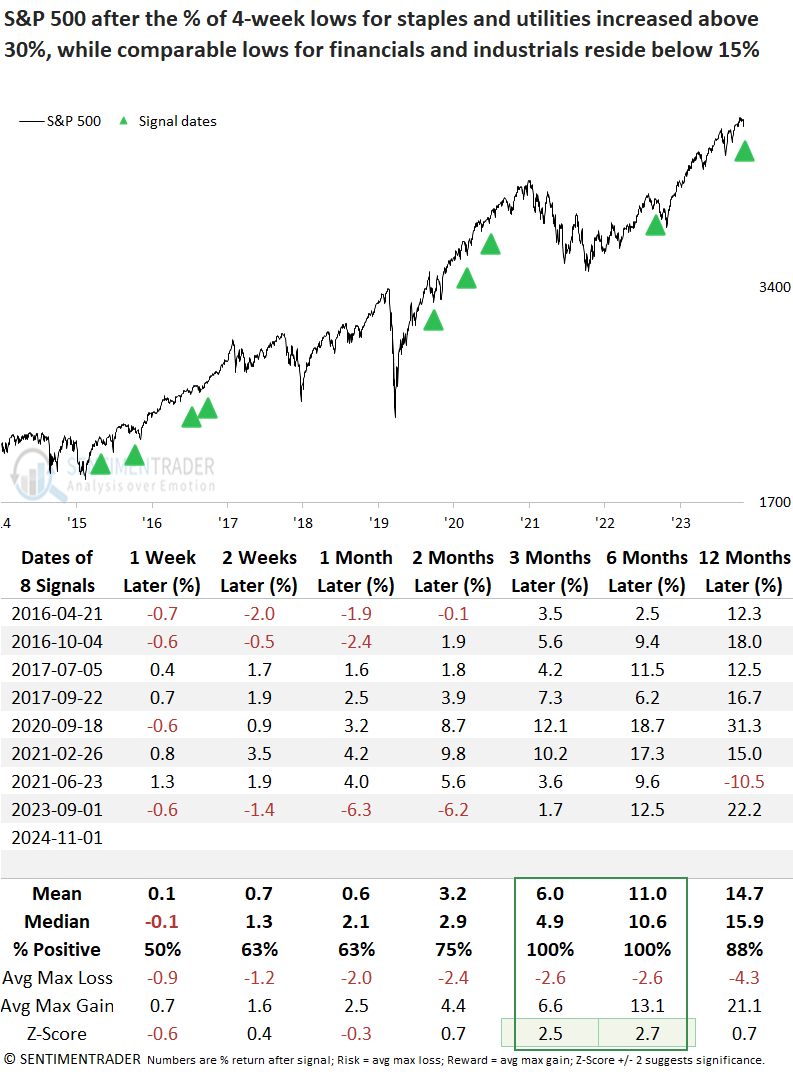
Comparable market breadth scenarios preceded positive returns
Although the sample size is limited, each time the percentage of 4-week lows for staples and utilities exceeded 30%, while financials and industrials stayed under 15% and the S&P 500 was near a multi-year year high, the world's most benchmarked index produced a gain 100% of the time over the next three and six months.
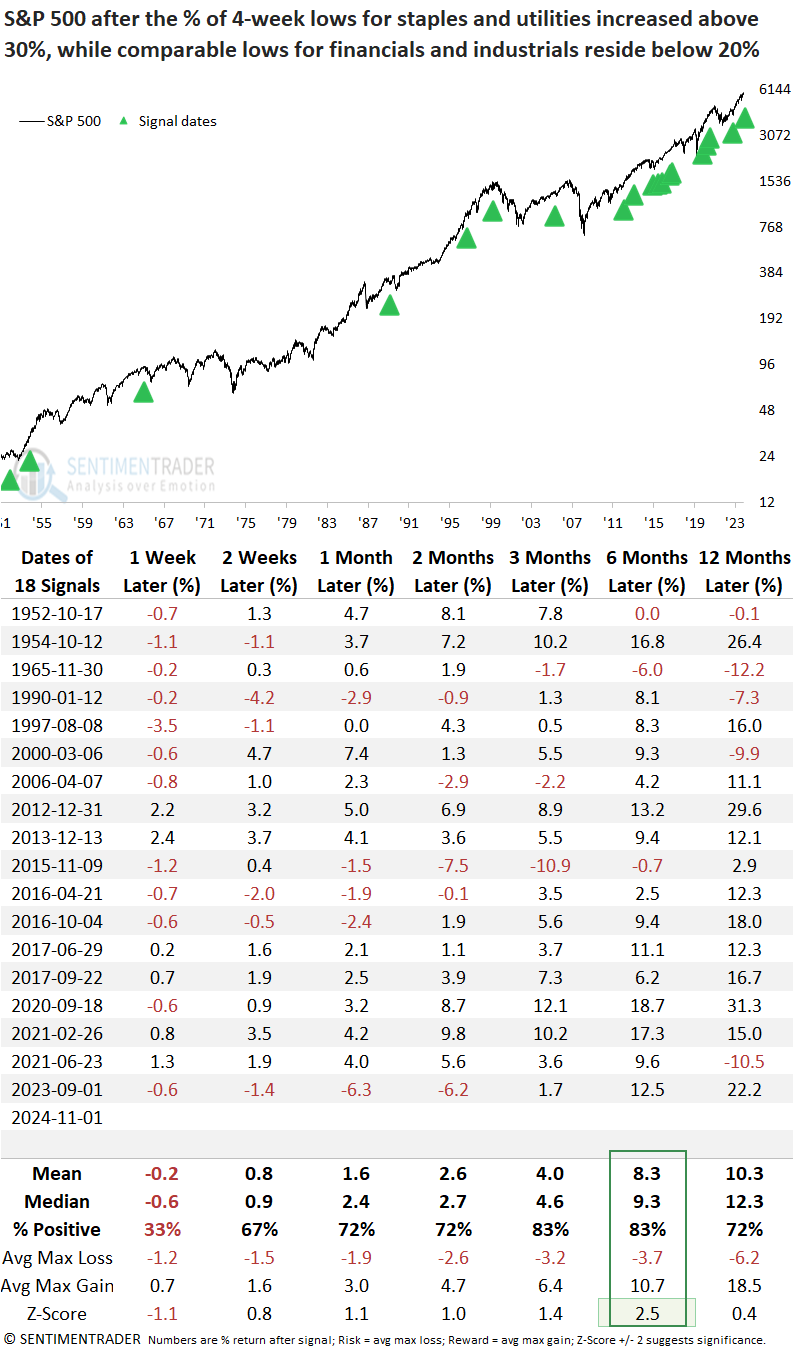
Suppose I increase the threshold for 4-week lows for the cyclical sectors from 15% to 20% to increase the sample size. In that case, the number of instances increased from eight to eighteen. Under this scenario, the S&P 500 still demonstrated strong returns and consistency, particularly over the next six months.
So, it's probable that whatever impacted defensive groups ultimately supported cyclical sectors, influencing the direction of the broad market upward.
Risk-Off Composite Model
With the recent alerts, the Risk-Off Composite Model signal count increased to 40%, one short of a broad composite signal.
Although it's risky to overlook the market message these signals convey, today's analysis raises the question of whether the high-low spread component might be more effective if it focused solely on cases where cyclical sectors were driving the expansion in new lows.
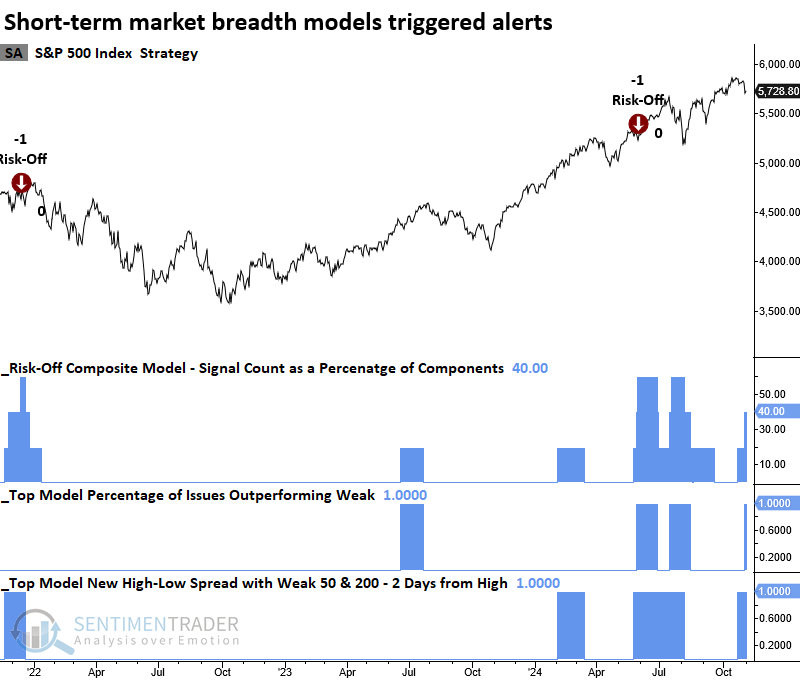
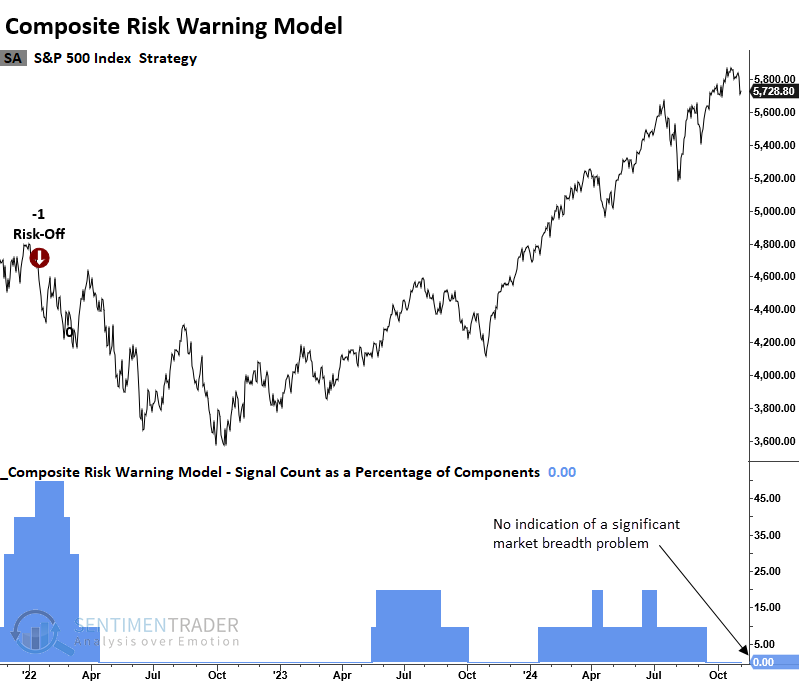
The Composite Risk Warning Model, the primary TCTM component for identifying a potential trend change in advance of price alone, maintains a signal count of zero, indicating that long-term breadth conditions remain constructive.
This is the model you should focus on if you're a medium to long-term investor.
What the research tells us...
The broad market has stalled with the notable rise in the 10-year Treasury yield and lingering election uncertainties. Although cyclical groups remain constructive, defensive sectors exhibit a more pronounced deterioration in participation. One such indicator, the percentage of 4-week lows, highlights a more significant increase in lows for sectors like staples and utilities. In contrast, cyclical groups such as financials and industrials show only minimal declines. Comparable divergences in market breadth between defensive and cyclical sectors have typically suggested that investors should maintain a bullish bias, with the cyclical sector's message being more influential. While some short-term concerns are worth mentioning, the big-picture backdrop remains constructive.