
Default risk gets priced in by bond traders

Key points:
- The cost to insure against bond defaults spiked to a 9-month high
- Jumps in the prices for credit default swaps have occurred before some major declines
- The most consistently bothersome sector was energies, which showed weak returns after these signals
Paying up for protection
One of the main drivers of the rise in stock prices this year has been loose financial conditions. That's something of a tautology because stock prices are a portion of most financial condition models, but other inputs carry just as much, if not more, weight.
One of those factors is bond spreads. As spreads widen, showing distress, it feeds into tighter financial conditions. Many of those models show tightening conditions, which have preceded more challenging environments for stocks.
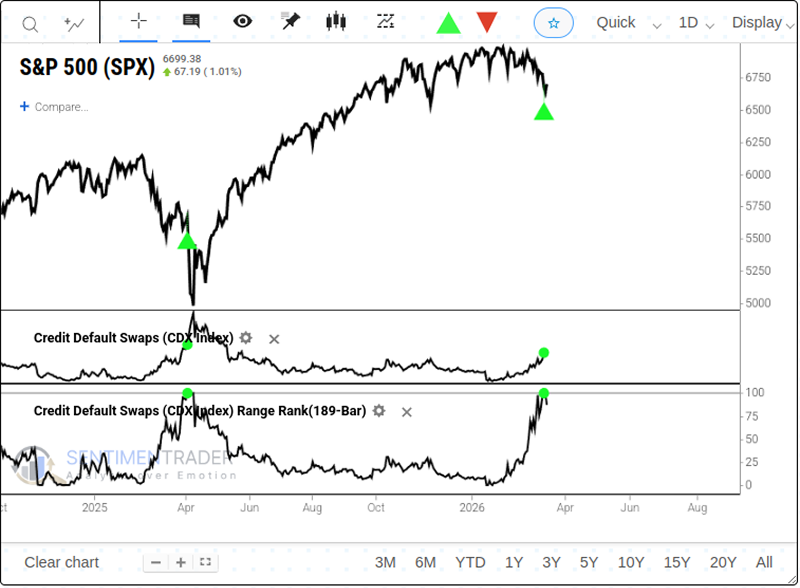
As those concerns rose, traders bought protection against bond defaults. Prices rise when traders scramble for protection, which we can see in the spike in credit default swaps. The chart below shows that the price of CDS protection notched a 9-month high last week (100% of its 189-day range).
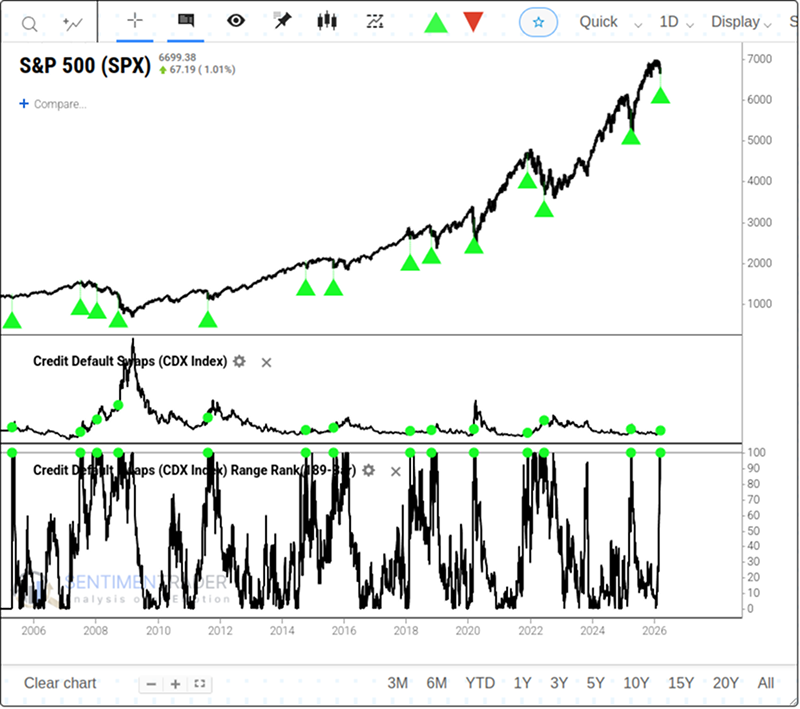
When we zoom out, we can see that these signals have been triggered multiple times over the past couple of decades.
A worry for stocks (especially Energy)
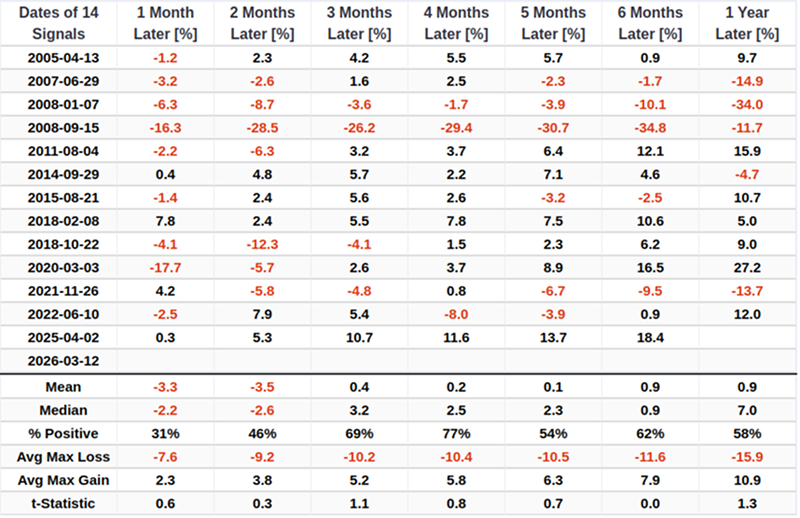
It's hard to tell what these 9-month highs in the cost of CDS protection meant for stocks, so the table below breaks it down.
Over the following one month, the S&P 500 was relatively weak, with only a 31% win rate and a negative median return. Even a year later, the average max risk outweighed the average max reward.
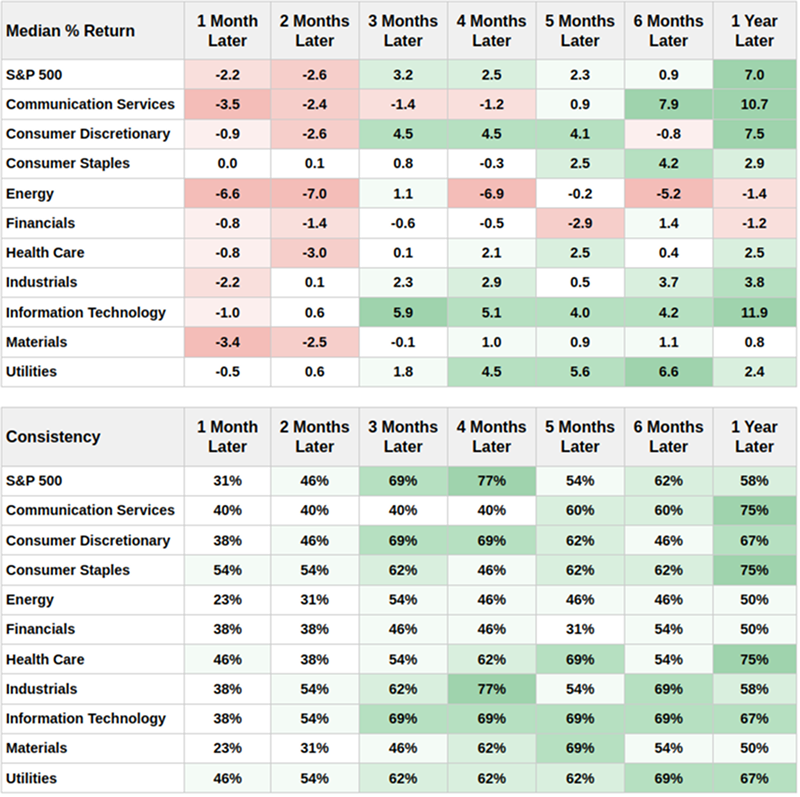
If you use Backtest Engine 2.0 to run this test (click here to load it and then click the Run Backtest button), you can use the Major Sectors tab to see how specific sectors reacted to these jumps in default protection. The next couple of months showed weak returns across the board, except for the defensive utilities sector. Worst of all were the Energy, with negative average returns and poor win rates over the short-to-medium-term.
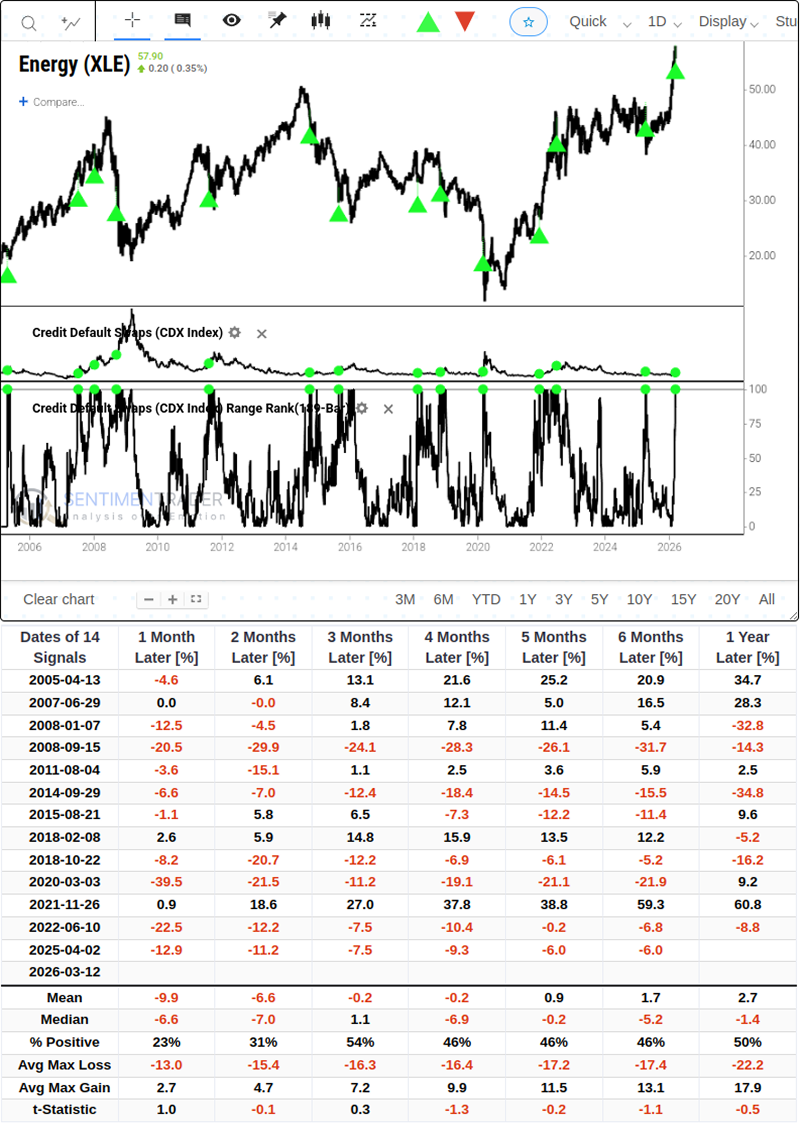
If we go back to the test and see how the XLE fund performed after these signals, we can get a clearer picture of how investors treated these stocks after they grew concerned about rising defaults. The chart below shows that those reactions were not good.
The data shows that XLE struggled after 13 signals. In the 2-3 months test, its win rate was only about 20-30%. Over the next month, the average maximum loss of -13% was more than 4 times the average reward of 2.7%, which is not something we often see.
What the research tells us...
Bull markets need bulls. Investors have to believe that prospects are bright to keep putting money into stocks, and when that sentiment shifts, rallies become much more difficult to sustain. So far, indications are good that investors are still in a buy-the-dip mentality, but it's starting to face its first real test since the panic last week.
The spike in credit default protection prices is a worry, especially if it doesn't recede quickly and substantially. That worry is valid for the broader market but is particularly acute for energies. After other signals, how investors reacted over the first couple of weeks was a decent guide to longer-term returns, so it may pay to watch if buyers are willing to step in right away and use the recent mini-panic as an opportunity to buy rather than an excuse to sell.