
Declining participation in cyclical sector stocks

Key points
- Market breadth has narrowed significantly in three key cyclical sectors: Consumer Discretionary, Financials, and Technology.
- Fewer than 60% of stocks in these sectors are trading above their 50-day moving averages, despite the S&P 500 lingering near its 52-week high.
- Historically, this specific type of divergence has preceded weak and volatile medium-term returns for the broader market.
- While short-term breadth metrics are raising alarms, longer-term "Risk On/Off" and "Market Environment" composites remain favorable, suggesting a potential corrective phase rather than a structural bear market.
Is the drop in cyclical participation a cause for concern?
The S&P 500 Index has been trading in a range-bound, choppy manner for several months. These periods of consolidation allow moving averages to catch up with price action. Consequently, breadth indicators that track short-to-medium-term trends, such as the percentage of stocks above their 50-day moving average, often reveal a decline in market participation.
On Monday, the proportion of stocks in the Consumer Discretionary, Financial, and Technology sectors closing above their 50-day moving averages fell below 60%, even as the world's most benchmarked index remained within 2.5% of its one-year high. This backdrop of narrowing market breadth, specifically migrating to these three crucial cyclical sectors, warrants careful attention. For related backtest, click here.
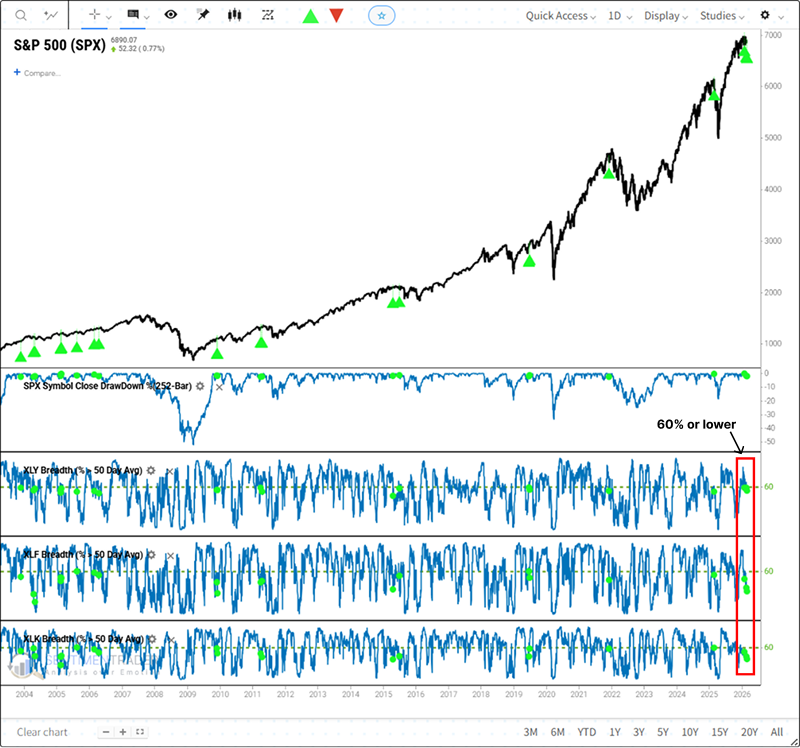
Similar cyclical weakness precedes a dim medium-term outlook
When the percentage of stocks above their 50-day average drops below 60% across the Consumer Discretionary, Financial, and Technology sectors while the broader market remains near highs, the S&P 500 has historically exhibited sluggish performance over the subsequent three months. This scenario has frequently materialized just before or shortly after market peaks, suggesting that the current turbulent market environment is likely to persist.
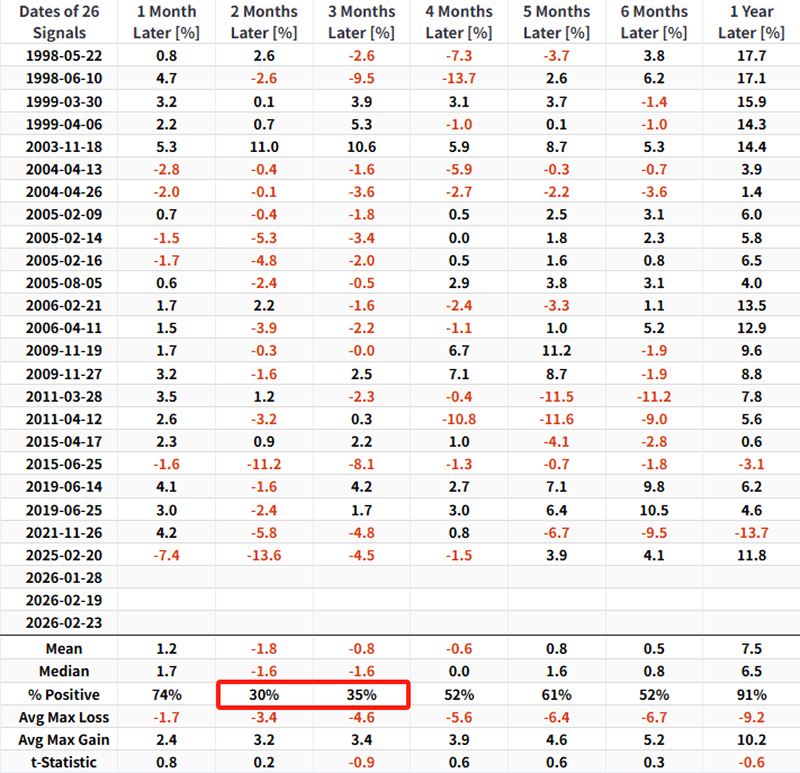
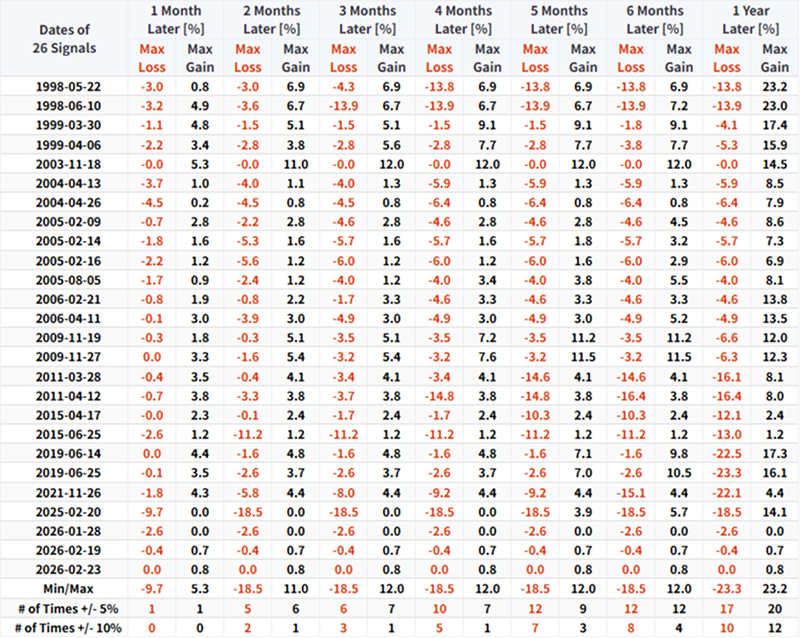
During these sluggish three-month periods following the signal, the S&P 500 has experienced maximum drawdowns exceeding -10% on three occasions, while recording a maximum gain exceeding 10% only once.
Risk-Off Composite Model triggers
Last Thursday, a component within our Risk-Off Composite Model triggered an alert, reflecting the deteriorating participation among S&P 500 constituents. Because this composite model primarily tracks short-to-medium-term trends, these alerts are not entirely surprising in the current context.
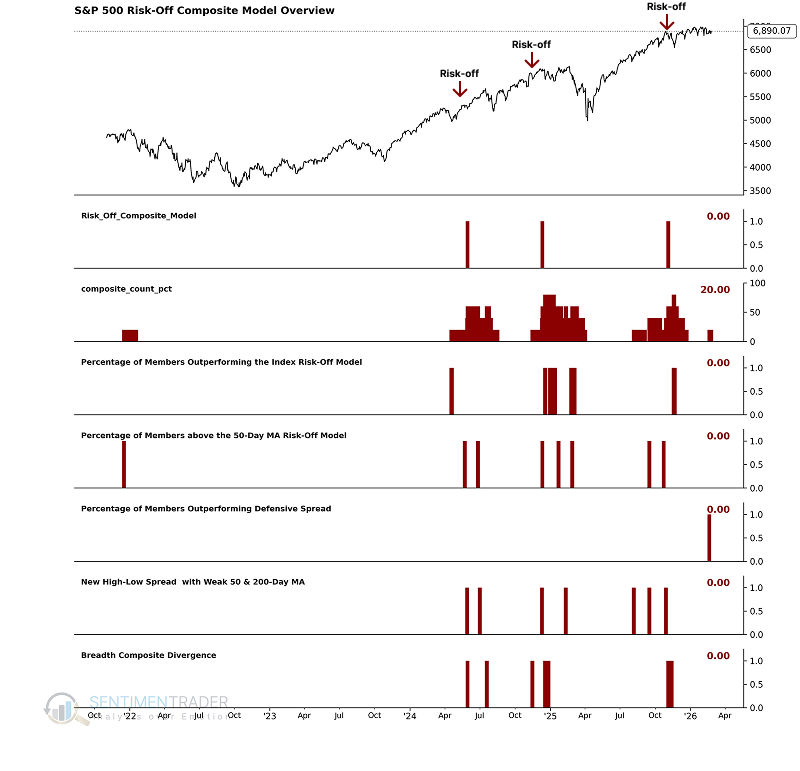
Other considerations
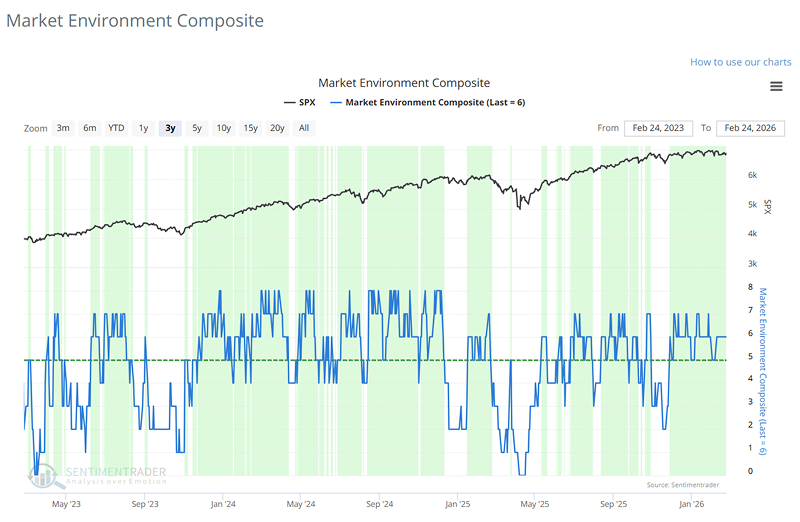
Despite this short-term deterioration, the Market Environment Composite maintains a score of six, which still reflects favorable conditions.
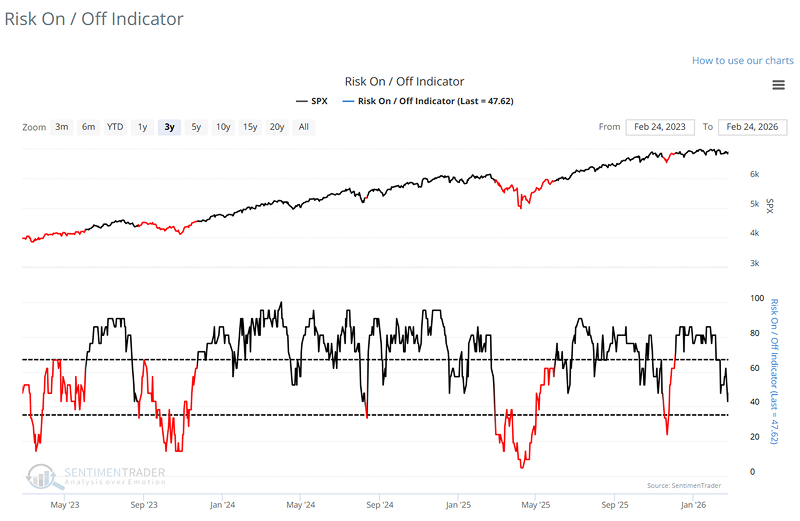
Similarly, the Risk On/Off Indicator, an additional overlay model that assesses overall market health, remains in a positive ("Risk On") position.
What the research tells us...
Engagement issues are beginning to resurface, a common occurrence during prolonged consolidation phases. Multiple factors may contribute to this scenario, including interest rates, uncertainty surrounding government policies, and overvaluation. Regardless of the cause, similar market breadth patterns suggest the S&P 500 could stall for three months. Currently, the evidence still leans bullish, but traders should remain vigilant for signs of further deterioration and prepare for heightened market volatility and potential pullbacks in the near term.