
Declining leading economic indicators - and what it means for economy and stocks

Key Points
- LEI is designed to measure the trend/strength of economic activity and is not a direct stock market indicator per se. However, because the performance of the economy and the stock market are so tightly intertwined, LEI also ends up being something of a de facto stock market indicator.
- The Conference Board Leading Economic Indicators (LEI) have fallen below their 12-month exponential moving average (and the 6-month moving average has turned down)
- Historically, the economy and the stock market perform better when LEI is showing strength
Identifying the trend of LEI
There is no "perfect" way to define trends, so we will go with something straightforward. At the end of each month (regardless of when the data was released during the month), we will compare the latest LEI reading to its own 12-month exponential moving average. Interpretation is simple:
- If LEI > 12-month exponential average = Favorable for economy and stocks
- If LEI < 12-month exponential average = Unfavorable for economy and stocks
The chart below displays the following calculation:
Latest LEI reading - 12-month exponential moving average
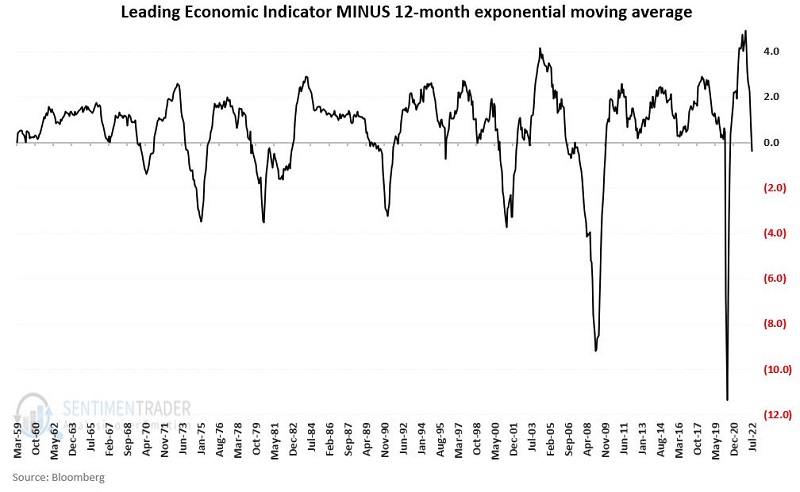
Let's look at economic and stock market performance depending on whether the line in the chart above is positive or negative (i.e., if LEI is above or below its 12-month EMA).
LEI and Coincident Economic Indicators
While LEI is intended to foreshadow the action of the economy in the next six to twelve months, the Conference Board Coincident Economic Indicators (CEI) - as the name implies - is intended to identify the economy's trend in the present.
For our purposes, we will use the CEI data series to measure the overall economy. For each month, we will look at:
- The month-end reading for LEI (i.e., above or below its 12-mo. EMA) AND;
- The increase or decrease in the Coincident Economic Indicators over the FOLLOWING 12 months
The theory is that CEI should show better forward 12-month performance when LEI is in an uptrend and lesser 12-month performance when LEI is in a downtrend. Let's see how this works out in reality.
CEI Performance
LEI has closed above its own 12-month EMA 76% of the time. The chart below displays the cumulative % increase/decrease in the CEI series, looking ONLY at those months when LEI ended the previous month ABOVE its own 12-month EMA. Note the steadily upward nature of performance.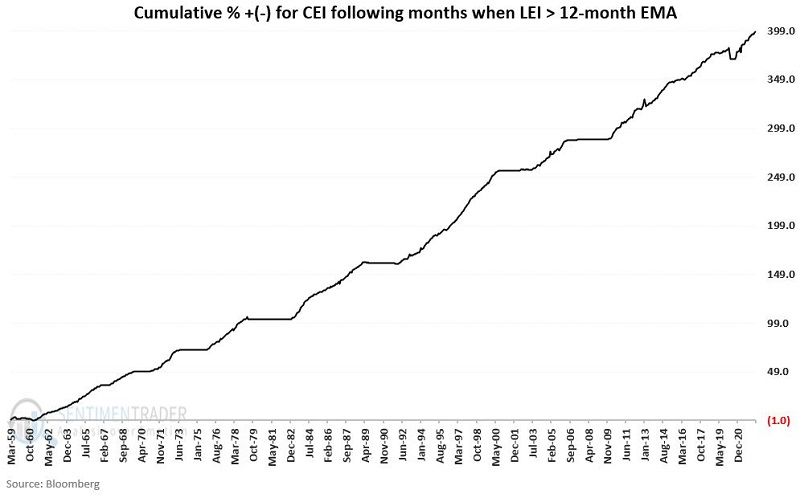
LEI has closed below its own 12-month EMA 24% of the time. The chart below displays the cumulative % increase/decrease in the CEI series, looking ONLY at those months when LEI ended the previous month BELOW its own 12-month EMA.
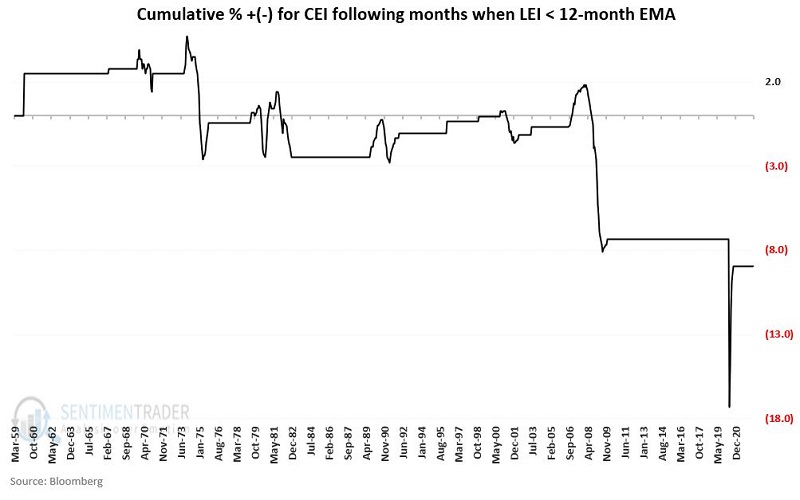
It is important to make the following distinction:
- The economy (using CEI as a proxy) DOES NOT always decline when LEI is below its 12-month EMA HOWEVER;
- Virtually all recessions and economic downturns have occurred when LEI was below its 12-month EMA
The table below summarizes CEI results numerically.
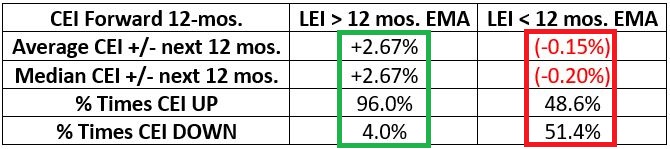
LEI has dropped below its 12-month EMA. As of August 1st, this indicator will now be ranked as "Unfavorable" for the overall economy.
- This DOES NOT mean that CEI is doomed to decline in the next 12 months
- IT DOES imply that the probability of CEI rising over the next 12 months has now dropped from 96% to under 50% (i.e., there is a verifiable threat of a recession)
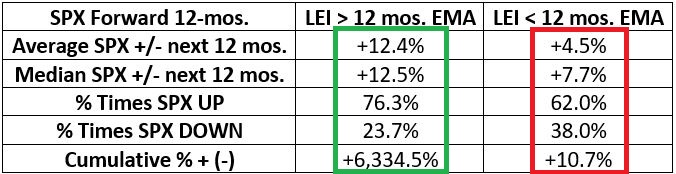
S&P 500 Performance
For the sake of continuity in this study, we will look at stock market performance based on the same relationship used above - i.e., the latest LEI reading compared to its latest 12-month EMA. However, please note that the Conference Board LEI Model tracked in the Strategies section uses the 1-month change in the 6-month moving average of LEI to identify the trend.
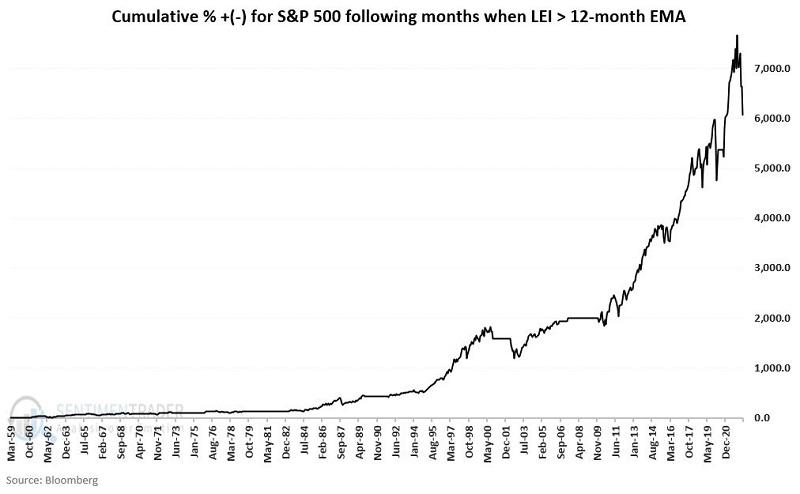
The chart below displays the cumulative % growth for the S&P 500 index if held long only when LEI closed the previous month ABOVE its 12-month EMA. The cumulative gain is +6,335%.
The chart below displays the cumulative % growth for the S&P 500 index if held long only when LEI closed the previous month BELOW its 12-month EMA. The cumulative gain is +10.7%.
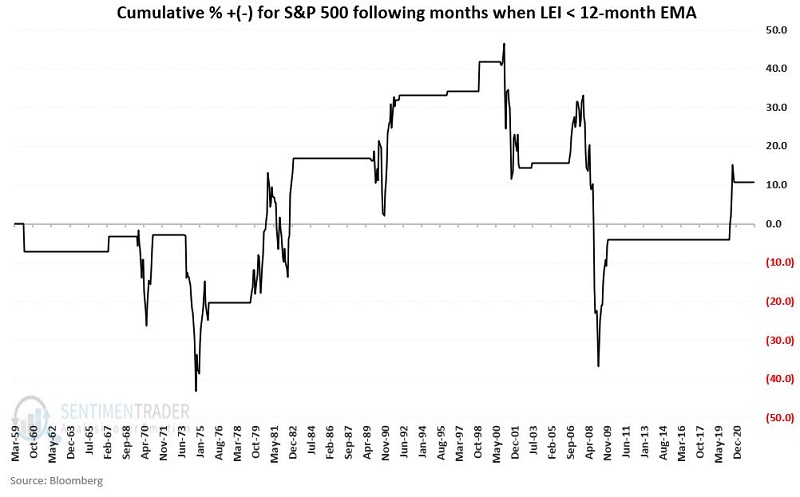
On the one hand, the S&P 500 Index did show a net gain while LEI < 12-month EMA. Nevertheless, the results are extraordinarily volatile and inconsistent and include most bear market periods (excluding 2002 until now) in the past 60+ years.
What the research tells us…
The latest value for the Conference Board Leading Economic Indicator Index fell below its 12-month exponential moving average. This means that beginning August 1st, this indicator will be deemed "Unfavorable" for both the economy and the stock market.
Based on historical results, there is no guarantee that the economy will plunge into recession nor that the stock market will continue to tumble. Nevertheless, as long as this negative reading persists, it will serve as a serious impediment to the economy and stocks and a warning sign for investors to look for bullish price action confirmation in the market before diving back in heavily.