Products
SentimenTrader Trading Tools
‍
Backtest Engine
My Trading Toolkit
Correlation Analysis
Seasonality
Market Prediction
Indicators & Data API
‍
Proprietary Indicators & Charts
Market Data API
Strategies & Scanner
‍
50+ Trading Strategies
Smart Stock Scanner
Smart Option Scanner
Research Reports
‍
Research Solutions
Reports Library
Free Resources
Simple Backtest Calculator
Simple Seasonality Calculator
The Kelly Criterion Calculator
Sentiment Geo Map
Public Research Reports
Education
Sentiment Indicators
Technical Indicators
Pricing
Company
About
In the News
Testimonials
Client Success Stories
Contact
Log inLoginSign up
< BACK TO ALL REPORTS

Declining issues on the NYSE are overwhelming advancing issues

Dean Christians
2022-08-29
Declining issues on the NYSE have overwhelmed advancing issues, with three out of six sessions showing a ratio of 5/1 in favor of declining issues. Let's assess the outlook for the S&P 500 after similar conditions.

Key points:

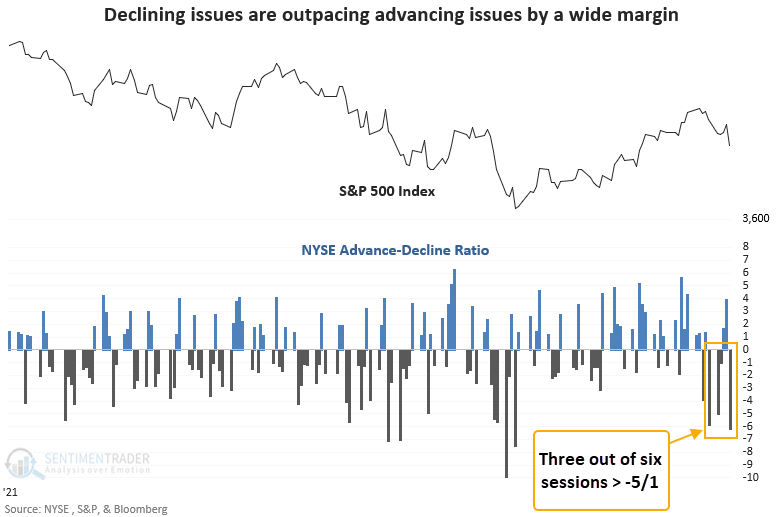
  • Declining issues on the NYSE have overwhelmed advancing issues by a ratio of 5/1
  • The lopsided breadth ratio has occurred in three of the last six sessions
  • Similar market breadth conditions have preceded mixed returns on a short to medium-term basis

A lopsided advance-decline ratio

In the last few weeks, we've shared several notes that suggested we could see a pause in the rally. Until now, the studies primarily focused on external price indicators like the 200-day moving average and the MACD indicator. 

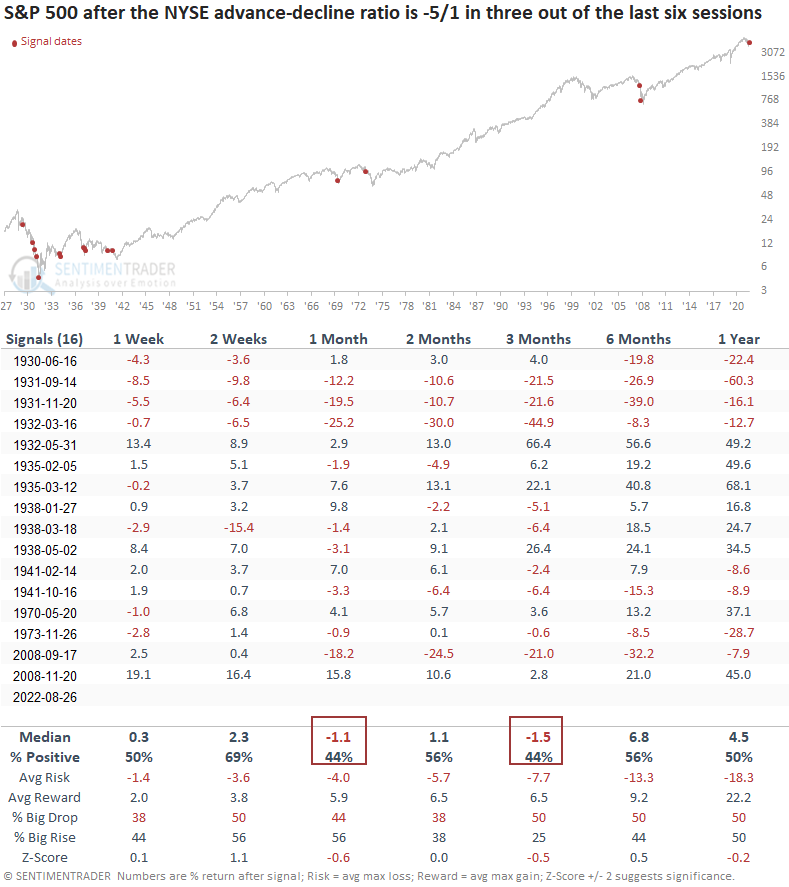
In the last six sessions, NYSE market breadth has turned considerably unfavorable, with three sessions showing an advance-decline ratio of -5/1. Let's assess the outlook for the S&P 500 after similar setups. I will also include a condition requiring the 200-day moving average for the S&P 500 to decline for 80 consecutive days or more, which is the case now. 

Similar signals preceded mixed returns

The lopsided breadth ratio in a downtrend is rare, especially since 1942. Our study identified 15 other instances in the last 93 years. While the one and three-month time frames show a negative return, the other short to medium-term windows were positive. So, the negative breadth in the last six sessions doesn't provide us with an overwhelming edge one way or the other. 

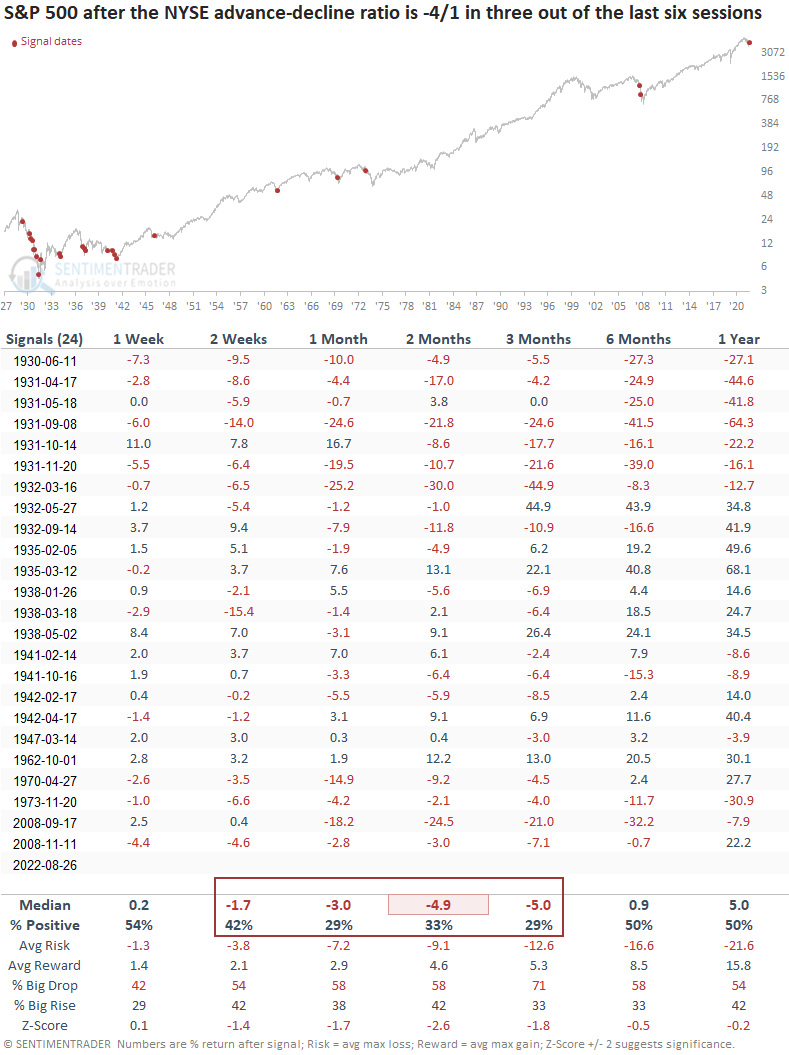
Suppose I lower the threshold for the ratio to -4/1. In that case, the study identifies an additional eight signals. Returns, win rates, and z-scores look considerably worse. As with the -5/1 signals, the 1929-42 period contains most of the instances.

What the research tells us...

Market breadth has turned considerably negative in the short-term, with the NYSE advance-decline ratio exceeding -5/1 in three of the last six sessions. The overwhelming adverse breadth condition is rare and, unfortunately, provides us with a somewhat inconclusive outlook. The study shows a more pessimistic view when I lower the threshold for the ratio to -4/1. While the long-term outlook suggests we trust the thrust, the near-term picture could be volatile.

PRODUCTS
SentimenTrader
Trading Tools
Indicators & Data API
‍
Strategies & Scanner
‍
Research Reports
FREE
RESOUrCES
Simple Backtest
Calculator
Simple Seasonality
Calculator
The Kelly Criterion
Calculator
Sentiment Geo Map
‍
Public Research Reports
‍
Education
Sentiment Indicators
‍
Technical Indicators
‍
Pricing
Bundle pricing
‍
FAQ
‍
Announcements
‍
COMPANY
‍
About
‍
In the News
‍
Testimonials
‍
Client Success Stories
CONTACT
‍
General Inquiries
‍
Media Inquiries
‍
Financial Professionals Inquiries
‍
© 2026 Sundial Capital Research Inc. All rights reserved.
Setsail Marketing
TermsPrivacyAffiliate Program
Risk Disclosure: The information and tools provided are for research and analytical purposes only and are not intended as investment advice. Market analysis involves uncertainty, and outcomes may differ from expectations. Users should conduct their own due diligence and consider their individual circumstances before making any financial decisions. Past performance is not necessarily indicative of future results.

Hypothetical Performance Disclosure: Hypothetical performance results have many inherent limitations, some of which are described below. No representation is being made that any account will or is likely to achieve profits or losses similar to those shown; in fact, there are frequently sharp differences between hypothetical performance results and the actual results subsequently achieved by any particular trading program. One of the limitations of hypothetical performance results is that they are generally prepared with the benefit of hindsight. In addition, hypothetical trading does not involve financial risk, and no hypothetical trading record can completely account for the impact of financial risk of actual trading. for example, the ability to withstand losses or to adhere to a particular trading program in spite of trading losses are material points which can also adversely affect actual trading results. There are numerous other factors related to the markets in general or to the implementation of any specific trading program which cannot be fully accounted for in the preparation of hypothetical performance results and all which can adversely affect trading results.

Testimonial Disclosure: Testimonials appearing on this website may not be representative of other clients or customers and is not a guarantee of future performance or success.