
Decision time for the dollar

Key Points
- The U.S. dollar has been one of the most consistently bullish markets over the last year
- The action of the dollar is typically influencing a lot of other markets
- In the past 14 years, significant "tops/downside reversals" for the buck have propelled stock prices higher
- There are several reasons to anticipate a potential downside reversal in the near-term
- The implications are important regardless of which way the dollar moves from here
Dollar vs. Stocks
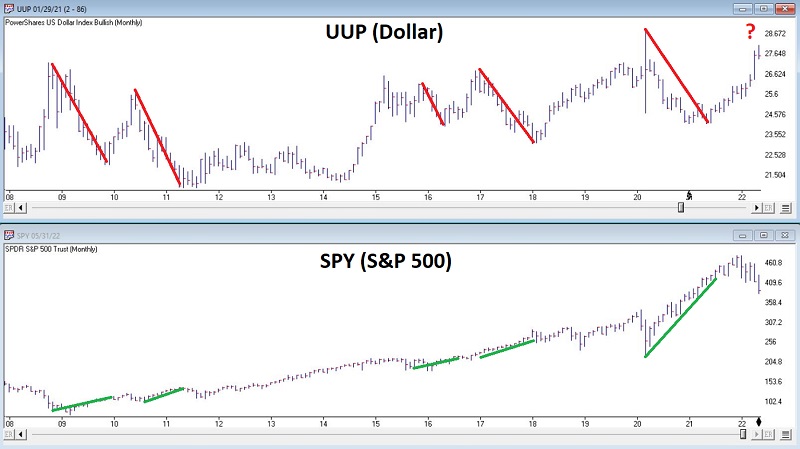
Over long periods, the U.S. dollar and the S&P 500 Index have enjoyed a mildly inverse relationship. The correlation coefficient between ticker UUP (Invesco DB U.S. Dollar Index Bullish Fund) and ticker SPY (SPDR S&P 500 ETF Trust) over the past ten years is roughly -0.10 - i.e., a mildly inverse relationship.
However, things are slightly different at the extreme. When the dollar puts in a significant high and then declines, the S&P 500 has usually reacted by moving higher. The chart below (courtesy of AIQ TradingExpert) displays ticker UUP on the top and SPY on the bottom. While the information and the exact drawing of lines are admittedly somewhat subjective, the point is pretty straightforward - when the dollar reverses lower after a rally, stocks have tended to perform well.
Running into resistance
The chart below (courtesy of Barchart.com) shows U.S. dollar futures testing an area of significant resistance.
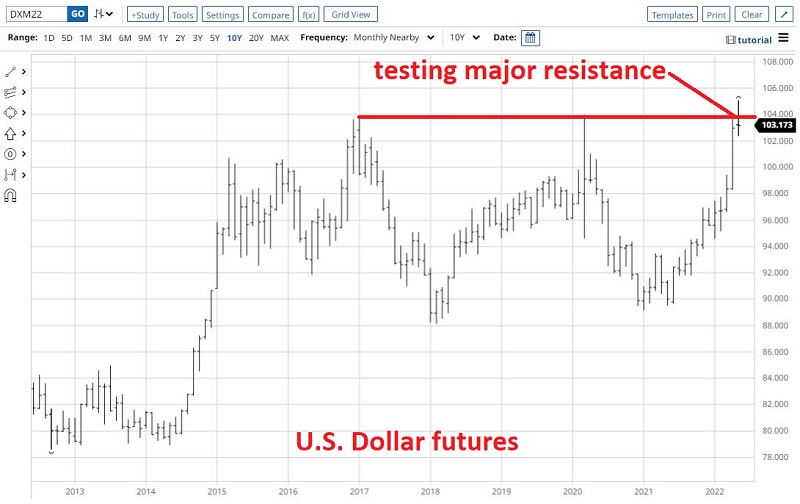
Will the buck break out or break down? No one can predict with 100% certainty. We can, however, assess certain clues.
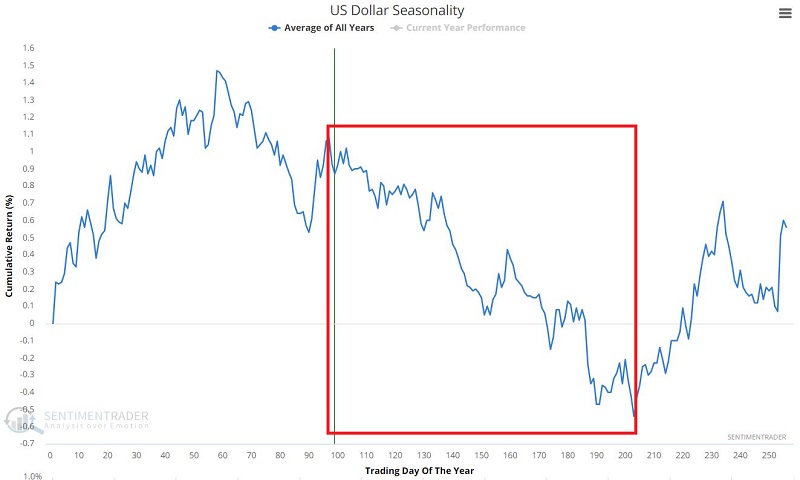
Seasonal weakness could weigh
The dollar has been on a tear this year, and there is no guarantee that it will slow down. Still - the weakest part of the year for the dollar is the late May to late September period. So, if we are going to see weakness, we should expect to see some signs very soon. The chart below displays the annual seasonal trend for the U.S. dollar.
Sentiment getting overdone to the upside
Relying solely on seasonality to identify an opportunity is typically not the best idea. However, when seasonality is combined with other factors - support/resistance, price trend, sentiment, etc. - it can be a potent combination in terms of spotting good opportunities.
We already have a clear "line in the sand" type of resistance and an impending period of seasonal weakness for the dollar. In addition, sentiment has gotten significantly bullish for the dollar. The chart below displays those times when the 100-day moving average of Dollar Optix crossed above 65.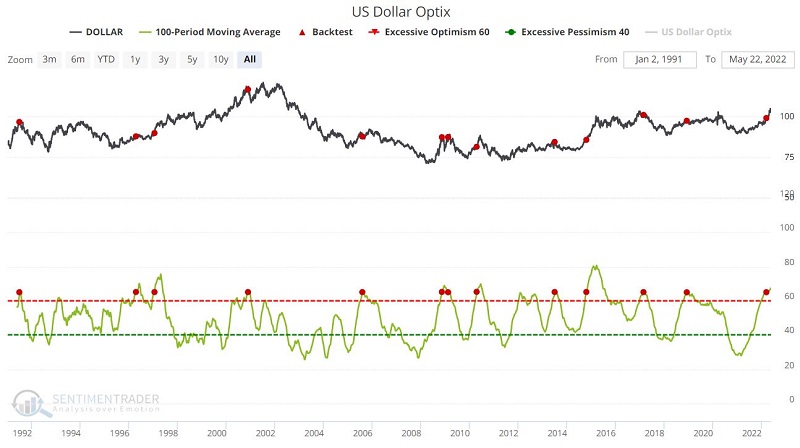
The latest purportedly "bearish" signal occurred on 3/15/2022. The dollar so far has wholly shrugged this off and has rallied 5.8% since the signal. Is it time to toss the latest signal in the dustbin? Maybe. But before doing so, note the summary of results from previous signals in the table below.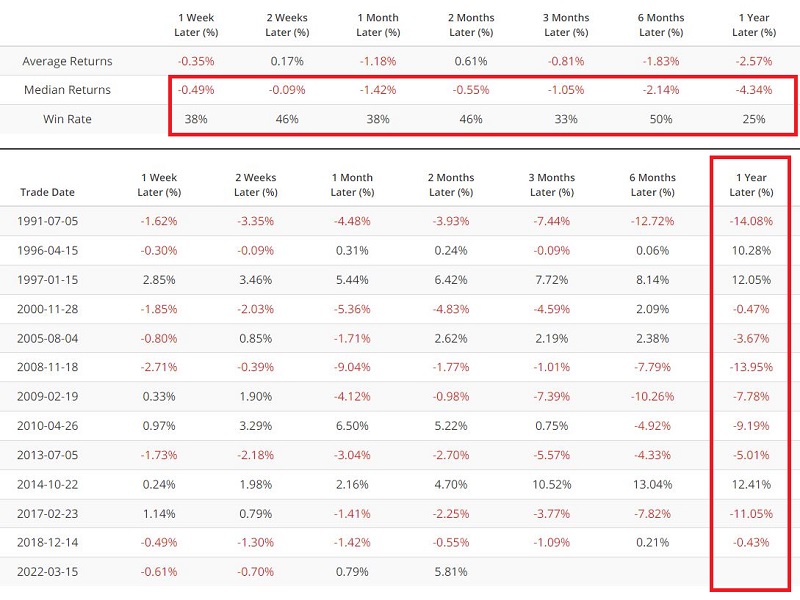
Note that the Median Return was negative for each time frame, and the Win Rate was 50% or below. Like seasonality, this argues for potential weakness in the months ahead.
What the research tells us…
The implication of the information above - the significant resistance level, the weak seasonal trend, and the high Optix reading- suggests that a reversal of fortune for the dollar may be in the offing. And if the dollar does weaken here, the implication is that the probability of improvement in the stock market rises.
On the flip side, there is no guarantee that a reversal will occur. There is an important implication associated with that outcome if it does not. If the dollar continues to rally, the recent trends in stocks and bonds may continue unabated.
The bottom line is to watch the buck closely for an important clue in the days and weeks ahead.