
December fills trader's eye with visions of.... corn(?)

Key points:
- Corn is soon entering a favorable seasonal period
- This period has seen corn gain in price 75% of the time since 1940
- Corn Optix has also reached a significant level
Corn seasonality set to turn positive
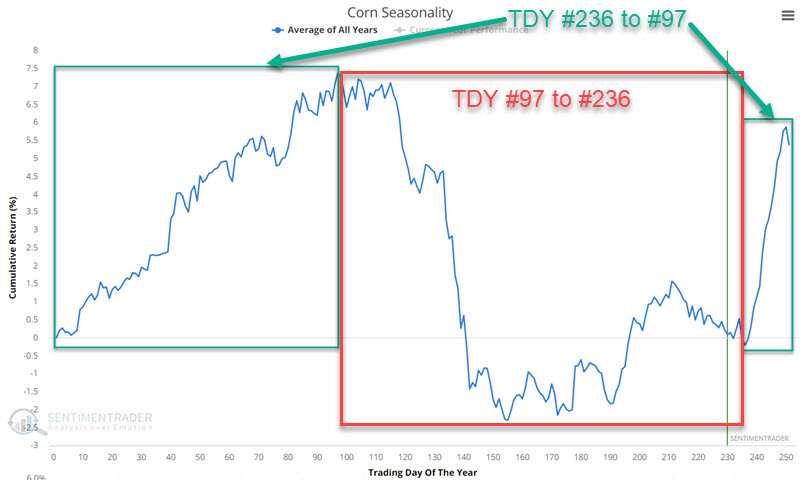
The chart below displays the annual seasonal trend for corn futures. Not that the "corn year" can essentially be cut into two phases:
- Favorable Phase from Trading Day of Year (TDY) #236 through TDY #97 of the following year
- Unfavorable Phase from TDY #97 through TDY #236
Note that corn is about to enter a favorable seasonal period. For 2023-24, this period runs from the close of 2023-12-08 through the close of 2024-05-20.
For this test, we will examine the performance of corn futures separately between Trading Day of the Year (TDY) #236 and TDY #97 and then from TDY #97 through TDY #236.
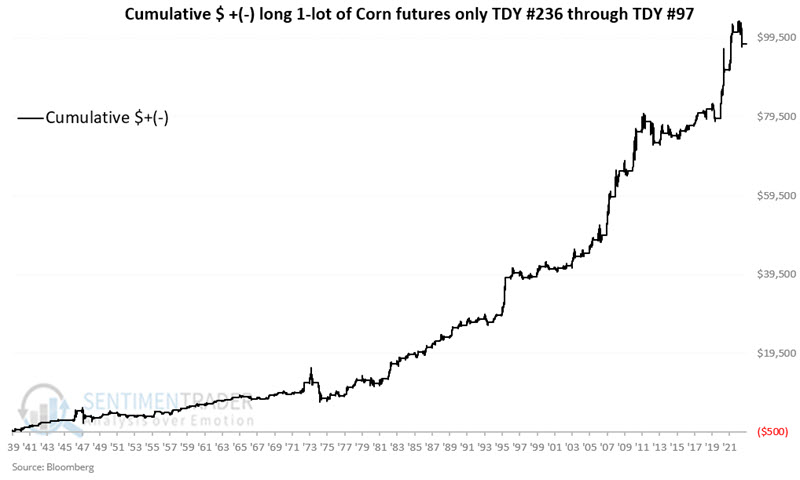
The chart below displays the cumulative dollar return achieved by holding a long 1-lot position in corn futures only from TDY #236 through TDY #97 starting in 1940. The cumulative hypothetical $ +(-) is +$98,005.
The chart below displays the cumulative dollar return achieved by holding a long 1-lot position in corn futures only from TDY #97 through TDY #236 starting in 1940. The cumulative hypothetical $ +(-) is (-$78,452).
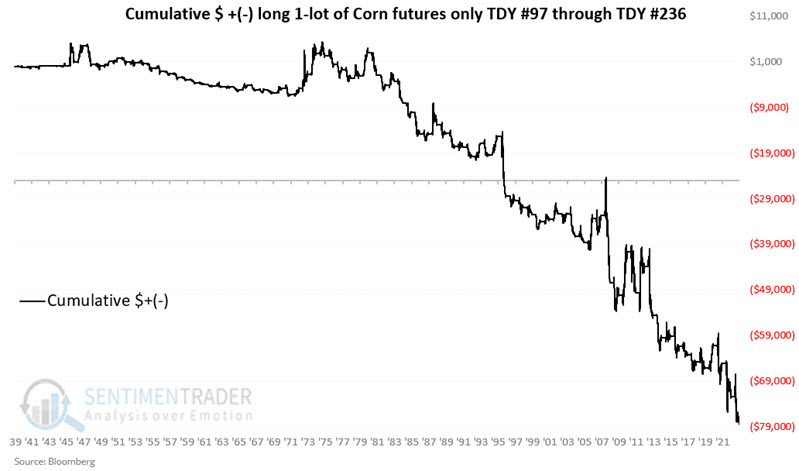
The difference in the long-term trends in the charts above is pretty unmistakable.
Combining favorable and unfavorable periods
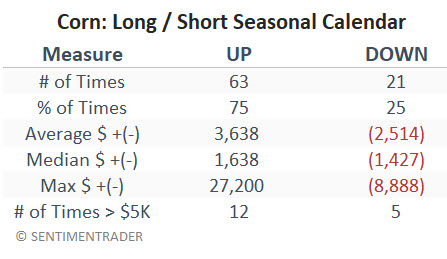
Now, let's assume a trader held a long position in corn from TDY #236 through TDY #97 and a short position in corn from TDY #97 through TDY #236 each year since 1940. The chart below displays the hypothetical net result.
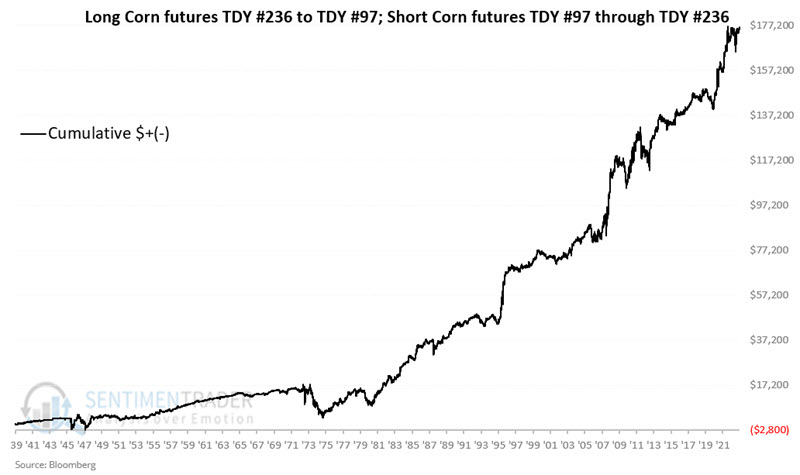
Over the past 84 years, corn futures showed a gain 63 times during this roughly six-month period. Five years showed a gain of +$13,000 per 1-lot or more. However, the sheer size of 2012's loss of -$8,888 reminds us of the need for risk management in every trade, regardless of any perceived edge.
Sentiment could be a favorable tailwind
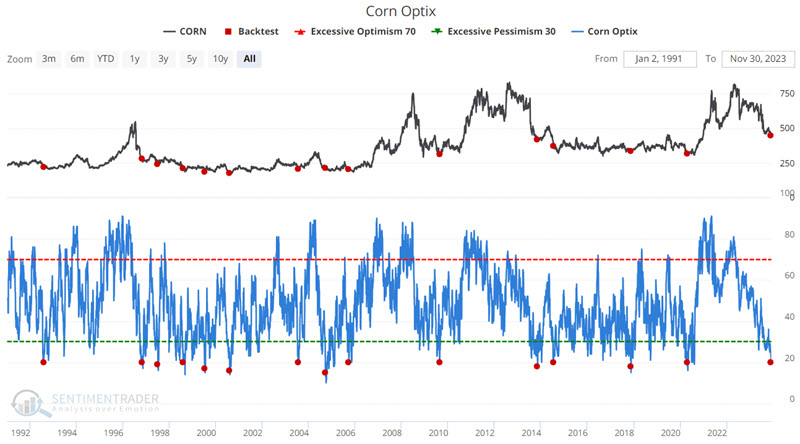
The chart below highlights those dates when Corn Optix stood at 20% or lower. The most recent drop to this level occurred on 2023-11-29.
The table below summarizes subsequent corn performance.
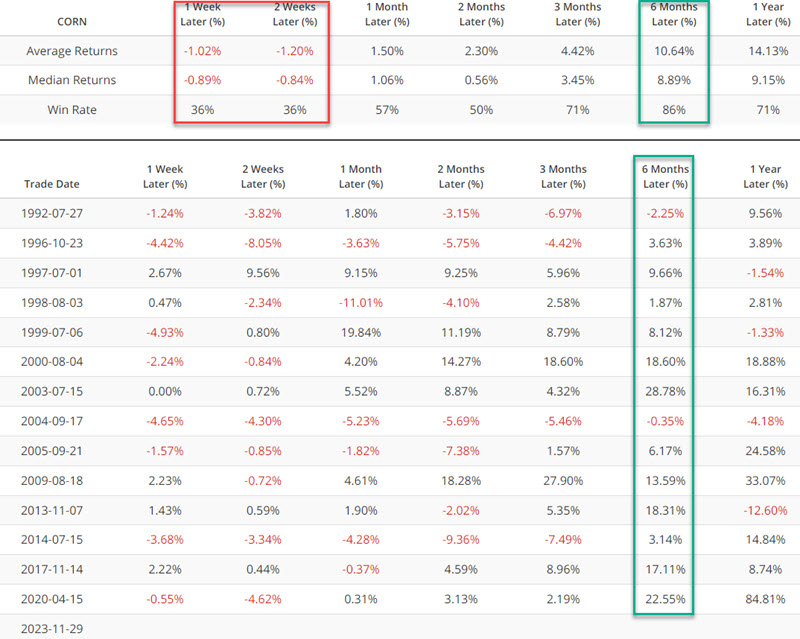
The favorable results over six months dovetail nicely with the abovementioned seasonal trend. However, it should be noted that the first two weeks after a signal has been hit or miss. This suggests that traders do not "jump the gun" but instead wait for the start of the favorable seasonal period (after the close on December 8th) before contemplating a long position in corn.
Ticker CORN as an alternative for non-futures traders
The Teucrium Corn Fund ETF (ticker CORN) may be an alternative for non-futures traders to play the corn market. The Teucrium Corn Fund seeks to have the daily changes in the NAV of the fund's Shares reflect the daily changes in the corn market for future delivery as measured by the Teucrium Corn Index. The Benchmark is a weighted average of the closing settlement prices for three futures contracts for corn that are traded on the Chicago Board of Trade. Under normal market conditions, it is expected that 100% of the fund's assets will be invested in benchmark component futures contracts and in cash and cash equivalents. The fund seeks to achieve its investment objective by investing in benchmark component futures contracts.
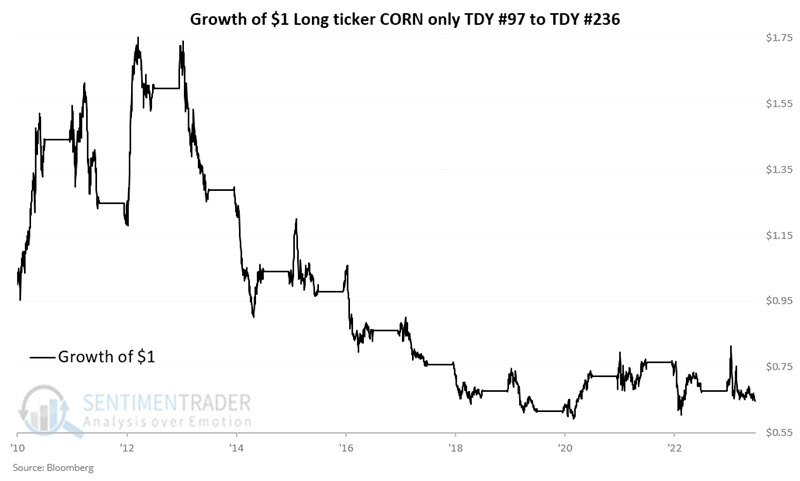
For the record, since its inception in 2010, the performance of CORN during the favorable TDY #236 to TDY #97 period has been underwhelming. The chart below displays the growth of $1 invested in CORN only during this seasonal period every year since 2010.
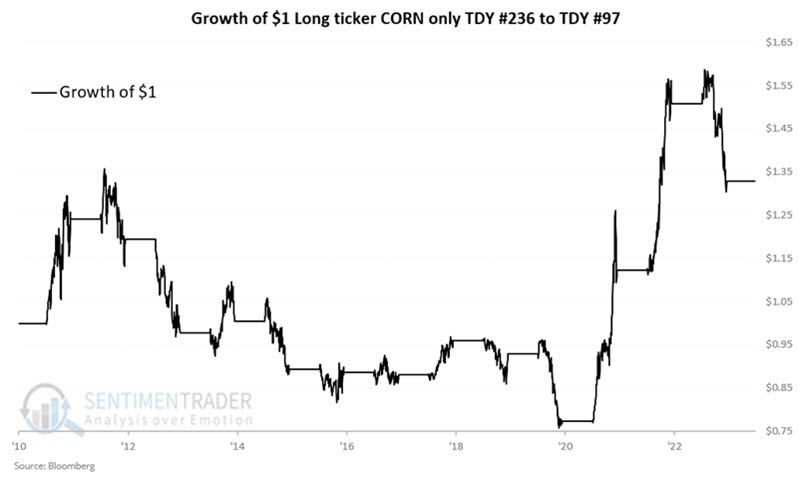
The table below summarizes the results.
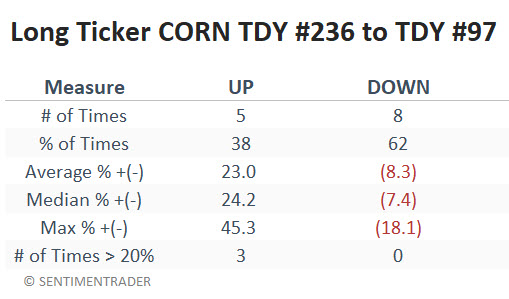
The 38% Win Rate suggests that non-futures trader who wants to play the seasonally favorable period for corn futures add their preferred trend-following overlay to avoid riding CORN lower during off years.
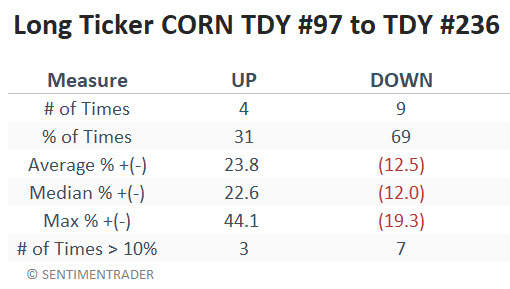
CORN's performance during the unfavorable period of TDY #97 through #236 has been more in line with that of corn futures. The chart below displays the growth of $1 invested in CORN only during this unfavorable seasonal period every year since 2010, and the table summarizes performance.
What the research tells us...
Corn has been one of the most reliably cyclical markets for over eight decades. Corn tends to rise in price when doubt is at its greatest - from early winter when there is no corn in the ground in the Midwest through the end of planting season (mid-May). Prices tend to ease once the status of the current year's crop is mostly known (mid-May until early winter). This gives corn traders a potential "edge" every year. The trick is to recognize that growing conditions vary widely from year to year and that the seasonal tendency discussed here is never a sure thing in any given year. Traders are still responsible for allocating capital wisely and managing risk intelligently.