Products
SentimenTrader Trading Tools
‍
Backtest Engine
My Trading Toolkit
Correlation Analysis
Seasonality
Indicators & Data API
‍
Proprietary Indicators & Charts
Market Data API
Strategies & Scanner
‍
50+ Trading Strategies
Smart Stock Scanner
Research Reports
‍
Research Solutions
Reports Library
Free Resources
Simple Backtest Calculator
Simple Seasonality Calculator
The Kelly Criterion Calculator
Sentiment Geo Map
Public Research Reports
Pricing
Company
About
In the News
Testimonials
Client Success Stories
Contact
Log inLoginSign up
< BACK TO ALL REPORTS

Days after turning negative, Nasdaq breadth surges

Jason Goepfert
2020-09-15
For weeks, breadth underlying the Nasdaq rally had been weakening, then turned negative. Days after that, stocks on that exchange enjoyed one of the best and more broad rallies in months. This kind of behavior tends to be positive and goes a ways toward offsetting the negatives from August.

Leave it to this market to be as perverse as possible.

Just days after it became apparent that underlying momentum in the Nasdaq wasn't just deteriorating but was turning negative, it has one of the most broadly positive days in months.

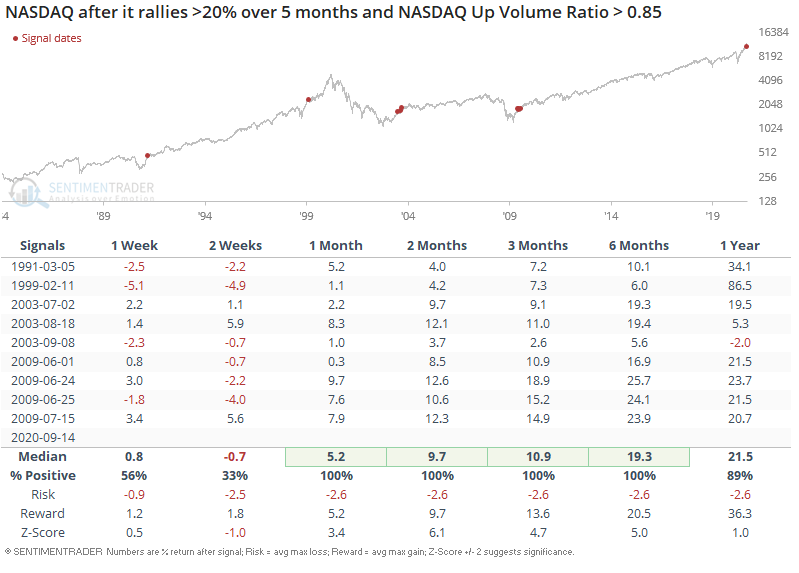
I'm going to borrow a table from Troy's premium note showing how the Nasdaq has responded after a surge in positive breadth after it had already rallied strongly over the past 5 months.

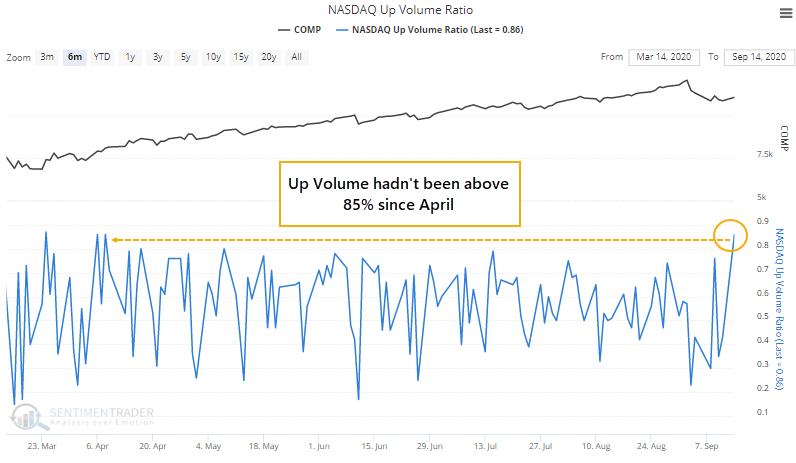
Monday's broad rally was enough to push the 10-day average of the Up Volume Ratio above 50% again, albeit barely. The Nasdaq Composite's annualized returns when this is above 50% are much better than when it's below. Another point in the bulls' favor.

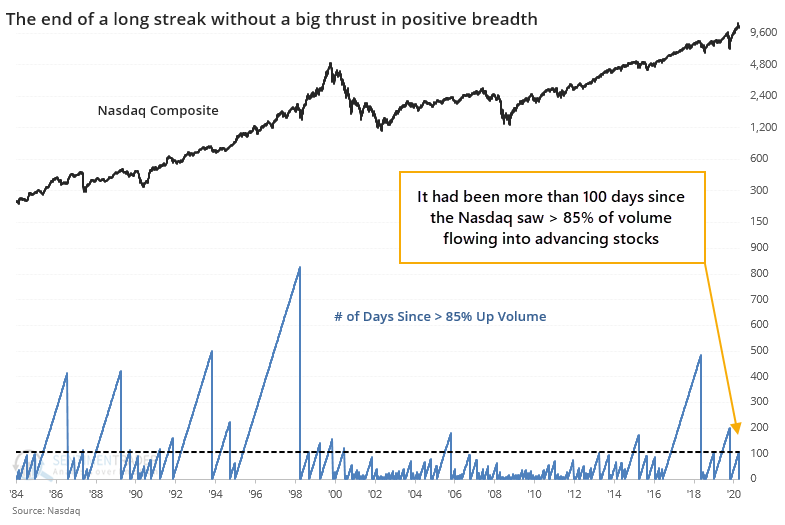
Remarkably, it had been more than 100 days since more than 85% of any day's volume flowed into advancing stocks.

This is one of the longer streaks dating back to 1984.

The table below shows how the Composite performed after its first 85% Up Volume day in several months when the 10-day average of that ratio had been below 50%.

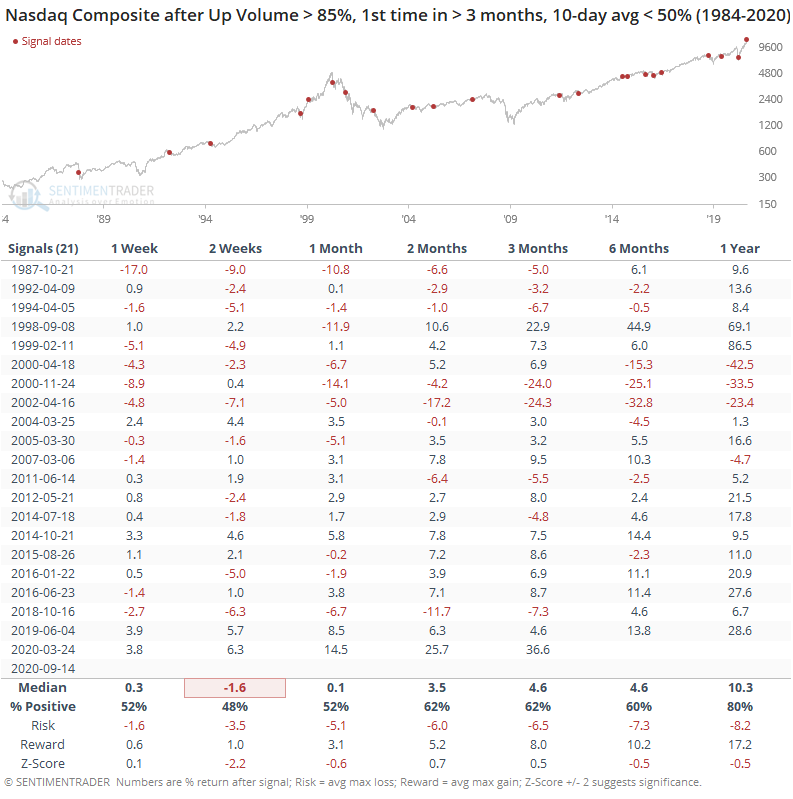
While not as extreme as Troy's study, thanks to a larger sample size, the overall pattern was the same - shorter-term weakness, medium- to long-term strength.

One of the primary reasons that the risk/reward for stocks appeared positive in March-June was the historic number and magnitude of positive breadth thrusts. Perhaps those are still exerting their influences - certainly, they have run over any and all sentiment extremes since then.

The worry over the past couple of months has been that breadth was turning questionable, with a huge number of extremely odd readings, and those have historically not turned out well. Combined with signs of astounding speculation and a neutral-at-best market environment, the risk/reward outlook was poor. If we start to see continued thrusts in some of these breadth figures, it would offset a lot of those oddities from August and make the idea of sustained gains more palatable.

Sorry, you don't have access to this report

Upgrade your subscription plan to get access
Go to Dasboard
PRODUCTS
SentimenTrader
Trading Tools
Indicators & Data API
‍
Strategies & Scanner
‍
Research Reports
FREE
RESOUrCES
Simple Backtest
Calculator
Simple Seasonality
Calculator
The Kelly Criterion
Calculator
Sentiment Geo Map
‍
Public Research Reports
‍
Pricing
Bundle pricing
‍
Announcements
‍
FAQ
COMPANY
‍
About
‍
In the News
‍
Testimonials
‍
Client Success Stories
CONTACT
‍
General Inquiries
‍
Media Inquiries
‍
Financial Professionals Inquiries
‍
© 2025 Sundial Capital Research Inc. All rights reserved.
Setsail Marketing
TermsPrivacyAffiliate Program
Risk Disclosure: Futures and forex trading contains substantial risk and is not for every investor. An investor could potentially lose all or more than the initial investment. Risk capital is money that can be lost without jeopardizing ones’ financial security or life style. Only risk capital should be used for trading and only those with sufficient risk capital should consider trading. Past performance is not necessarily indicative of future results.

Hypothetical Performance Disclosure: Hypothetical performance results have many inherent limitations, some of which are described below. No representation is being made that any account will or is likely to achieve profits or losses similar to those shown; in fact, there are frequently sharp differences between hypothetical performance results and the actual results subsequently achieved by any particular trading program. One of the limitations of hypothetical performance results is that they are generally prepared with the benefit of hindsight. In addition, hypothetical trading does not involve financial risk, and no hypothetical trading record can completely account for the impact of financial risk of actual trading. for example, the ability to withstand losses or to adhere to a particular trading program in spite of trading losses are material points which can also adversely affect actual trading results. There are numerous other factors related to the markets in general or to the implementation of any specific trading program which cannot be fully accounted for in the preparation of hypothetical performance results and all which can adversely affect trading results.

Testimonial Disclosure: Testimonials appearing on this website may not be representative of other clients or customers and is not a guarantee of future performance or success.