Products
SentimenTrader Trading Tools
‍
Backtest Engine
My Trading Toolkit
Correlation Analysis
Seasonality
Market Prediction
Indicators & Data API
‍
Proprietary Indicators & Charts
Market Data API
Strategies & Scanner
‍
50+ Trading Strategies
Smart Stock Scanner
Smart Option Scanner
Research Reports
‍
Research Solutions
Reports Library
Free Resources
Simple Backtest Calculator
Simple Seasonality Calculator
The Kelly Criterion Calculator
Sentiment Geo Map
Public Research Reports
Education
Sentiment Indicators
Technical Indicators
Pricing
Company
About
In the News
Testimonials
Client Success Stories
Contact
Log inLoginSign up
< BACK TO ALL REPORTS

Das is a goot time to keep an eye on EWG

Jay Kaeppel
2024-03-20
The German stock market has gained almost no ground in nearly a quarter of a century. Despite this, a short-term trading opportunity may be in the offing thanks to a confluence of seasonal and price action. We highlight the history of this setup herein.

Key points

  • The German stock market has been treading water for seventeen years (albeit in an extensive range)
  • The late March through April period has tended to witness favorable results
  • Ticker EWG has been trending well in recent months
  • The combination of favorable seasonality and price action may offer an opportunity for short-term traders

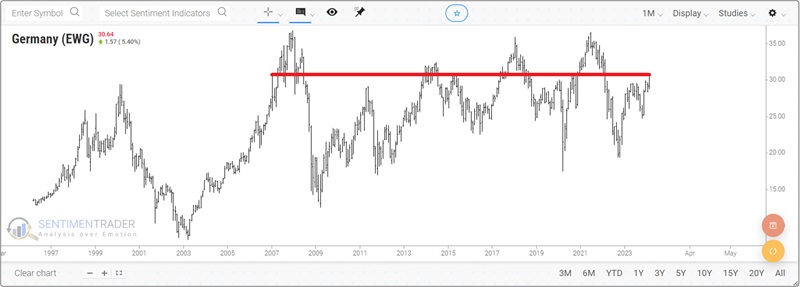
German stock market has been "dead money" for 17 years

The chart below tells you everything you need to know regarding the German stock market as a long-term investment. The iShares MSCI Germany ETF (ticker EWG) is literally unchanged in price from its level 17 years ago. In fact, as of a month ago, it was trading at the same price as it was in February 2000.

Several policy decisions by the German government have purportedly hamstrung long-term economic growth. However, analyzing geopolitics and their implications is not our strong suit. Our goal is to find and exploit potential opportunities regarding the German stock market.

The chart below shows that since the October low in 2022 and the October low in 2024, ticker EWG has been on the upswing. 

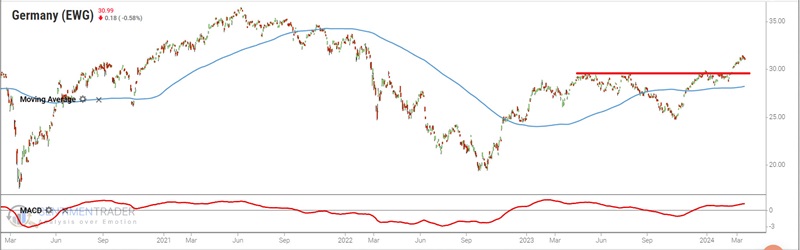
Can this advance continue? The annual seasonal trend for EWG shown below suggests the answer may be "Yes, and soon."

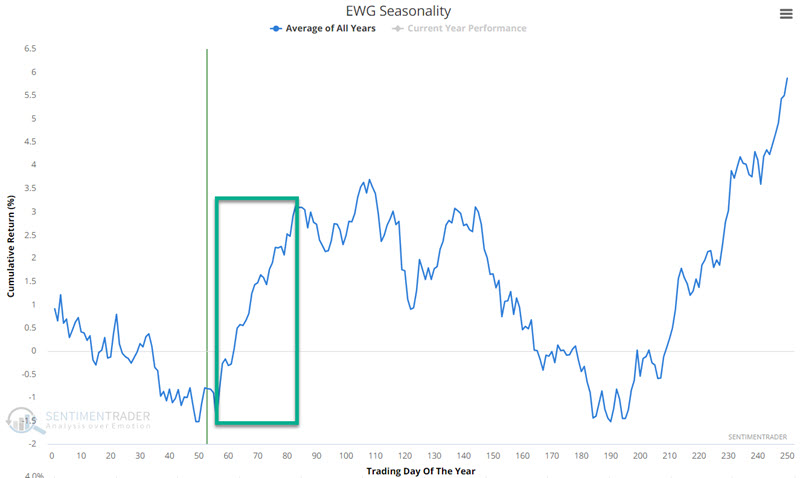
A look back at late March through April

The chart above highlights the period that extends from the close on Trading Day of the Year (TDY) #56 through TDY #83. For 2024, this period extends from the close on 2024-03-21 through 2024-04-30.

The chart below displays the hypothetical growth of $1 invested in ticker EWG only during this period every year EWG started trading in 1996.

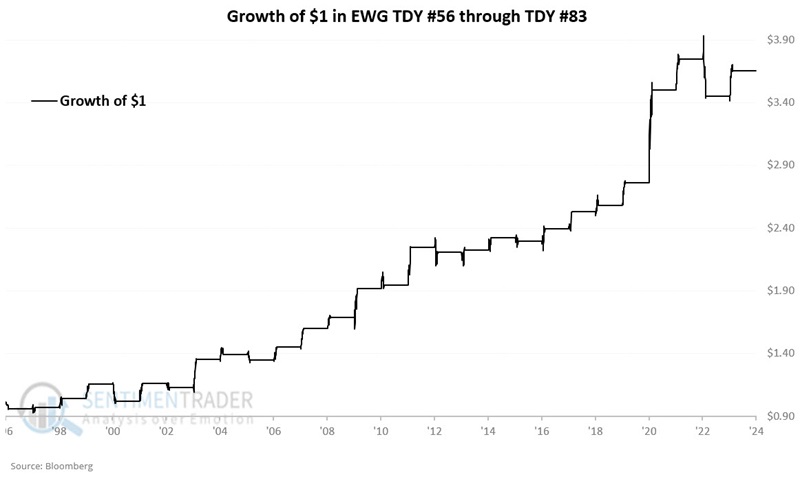
The table below summarizes historical EWG performance during this period.

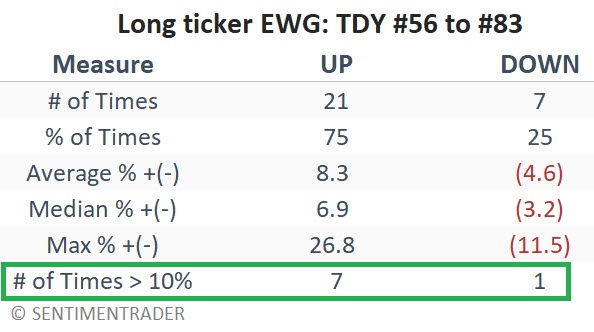
Historical seasonal results skew to the favorable side, with 3 out of 4 years showing a gain during the TDY #56 to #83 period. Likewise, regarding moves greater than 10% or more during this period, favor the winning side by 7 to 1. Conversely, the worst TDY #56 to #83 decline for EWG was -11.5% in 2000, and the second worst loss was -7.8% in 2022.

What the research tells us…

The good news is that the German stock market is already in an established uptrend as a favorable seasonal period approaches. This is the preferred setup for exploiting any seasonal trend (i.e., price is "doing what it is supposed to be doing.") That said, no seasonal pattern is guaranteed to follow its historical norm. 

Based on these results, momentum traders should be looking for an opportunity in ticker EWG between now and the end of April. Nevertheless, this trend is not a sure thing, so each trader must make decisions regarding capital allocation and risk management. 

PRODUCTS
SentimenTrader
Trading Tools
Indicators & Data API
‍
Strategies & Scanner
‍
Research Reports
FREE
RESOUrCES
Simple Backtest
Calculator
Simple Seasonality
Calculator
The Kelly Criterion
Calculator
Sentiment Geo Map
‍
Public Research Reports
‍
Education
Sentiment Indicators
‍
Technical Indicators
‍
Pricing
Bundle pricing
‍
FAQ
‍
Announcements
‍
COMPANY
‍
About
‍
In the News
‍
Testimonials
‍
Client Success Stories
CONTACT
‍
General Inquiries
‍
Media Inquiries
‍
Financial Professionals Inquiries
‍
© 2026 Sundial Capital Research Inc. All rights reserved.
Setsail Marketing
TermsPrivacyAffiliate Program
Risk Disclosure: The information and tools provided are for research and analytical purposes only and are not intended as investment advice. Market analysis involves uncertainty, and outcomes may differ from expectations. Users should conduct their own due diligence and consider their individual circumstances before making any financial decisions. Past performance is not necessarily indicative of future results.

Hypothetical Performance Disclosure: Hypothetical performance results have many inherent limitations, some of which are described below. No representation is being made that any account will or is likely to achieve profits or losses similar to those shown; in fact, there are frequently sharp differences between hypothetical performance results and the actual results subsequently achieved by any particular trading program. One of the limitations of hypothetical performance results is that they are generally prepared with the benefit of hindsight. In addition, hypothetical trading does not involve financial risk, and no hypothetical trading record can completely account for the impact of financial risk of actual trading. for example, the ability to withstand losses or to adhere to a particular trading program in spite of trading losses are material points which can also adversely affect actual trading results. There are numerous other factors related to the markets in general or to the implementation of any specific trading program which cannot be fully accounted for in the preparation of hypothetical performance results and all which can adversely affect trading results.

Testimonial Disclosure: Testimonials appearing on this website may not be representative of other clients or customers and is not a guarantee of future performance or success.