Headlines
|
|
Wall Street is taking the other side of individuals' pessimism:
As we head into year-end and Wall Street strategists update their year-ahead price targets, they expect the S&P 500 to continue to rally. At this time of year, when the index is near a high and strategists expect it to continue to rally, it usually does.
|
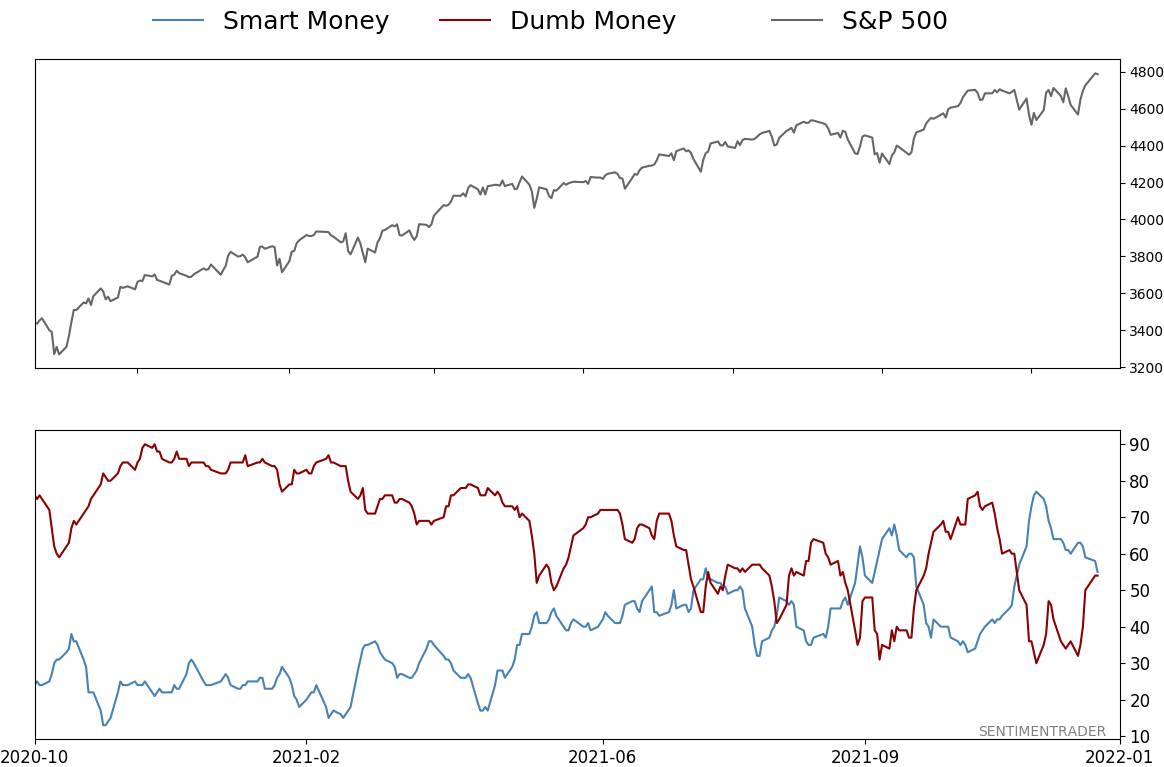
Smart / Dumb Money Confidence
|
Smart Money Confidence: 55%
Dumb Money Confidence: 54%
|
|
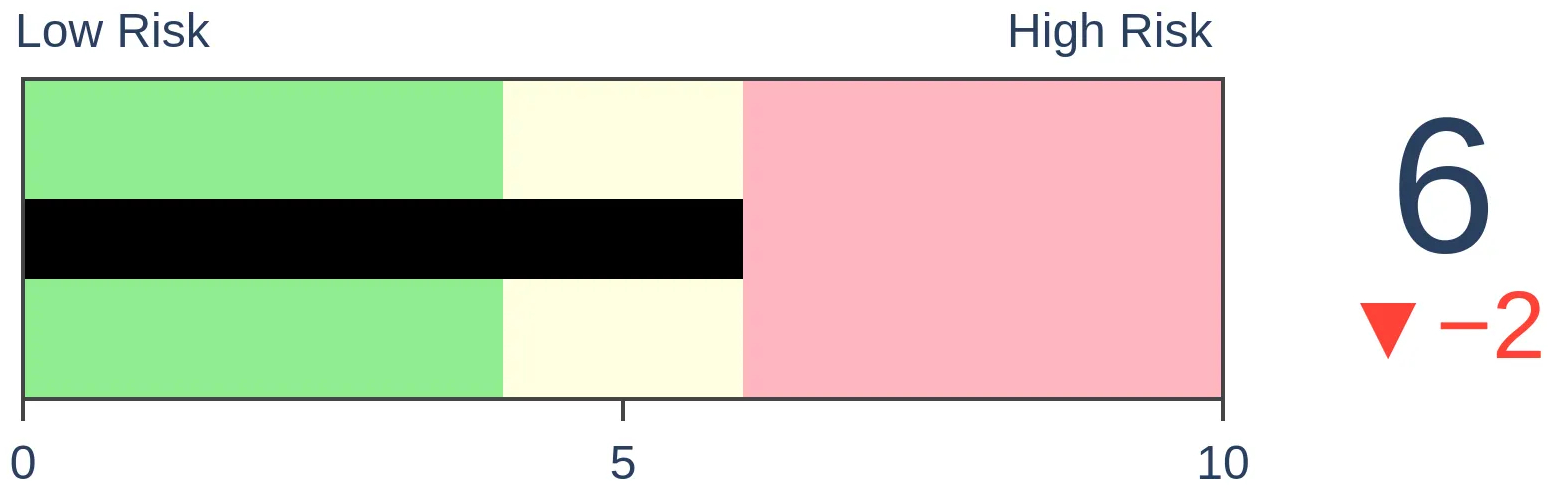
Risk Levels
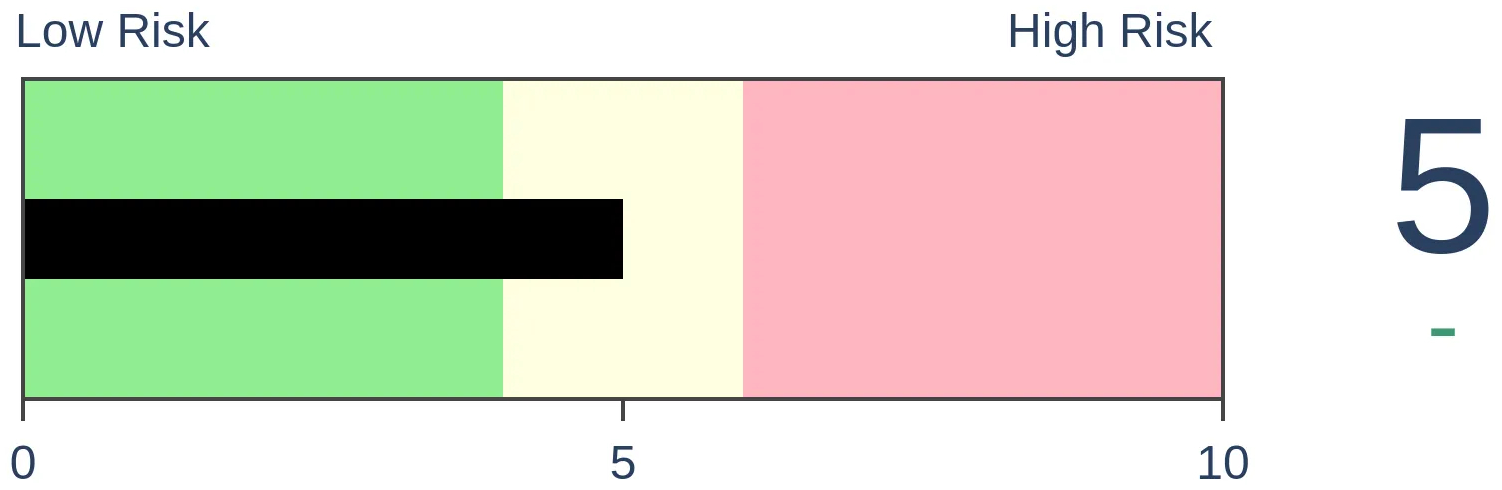
Stocks Short-Term
|
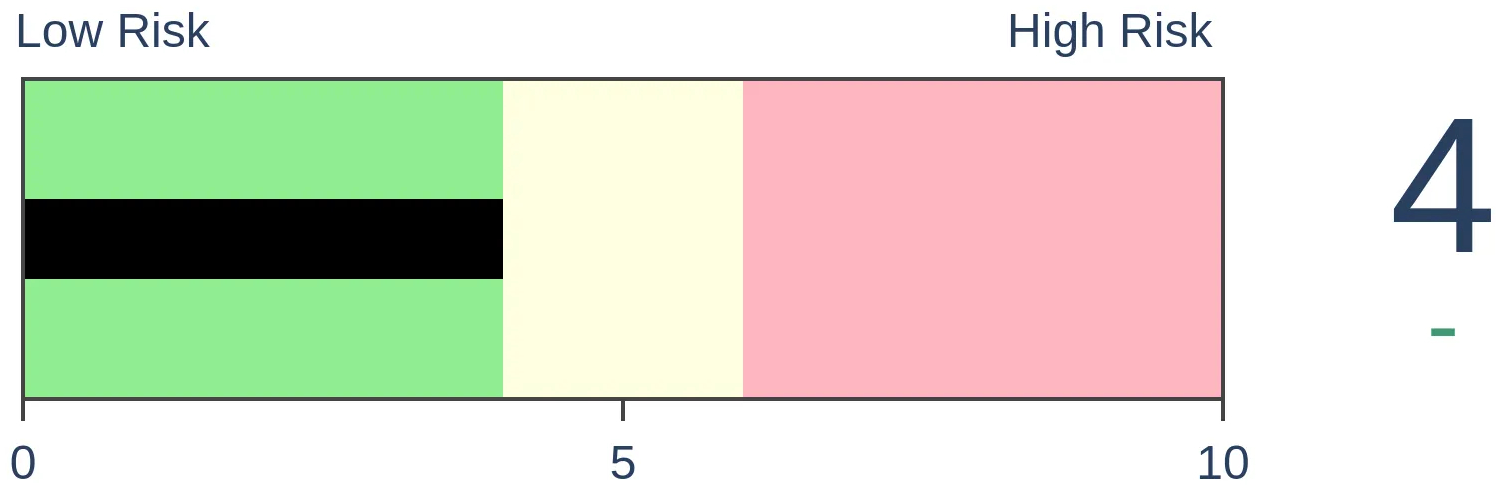
Stocks Medium-Term
|
|
Bonds

|
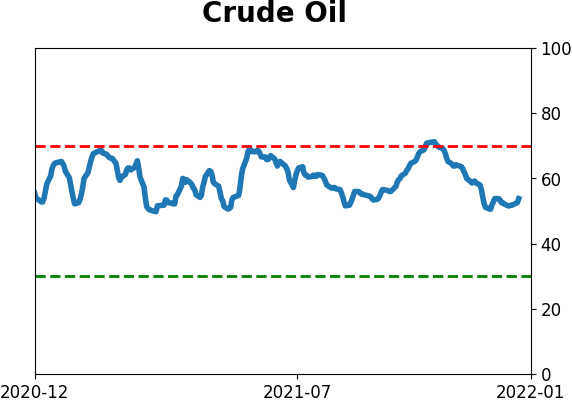
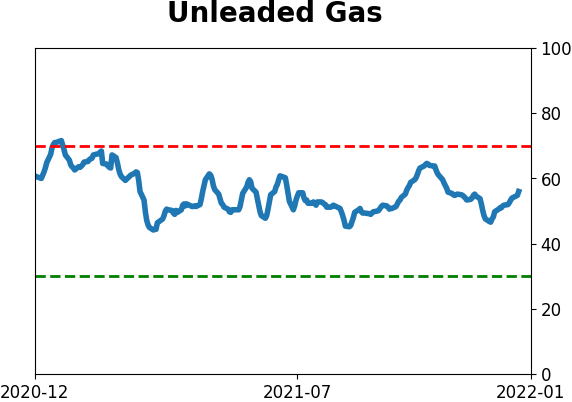
Crude Oil
|
|
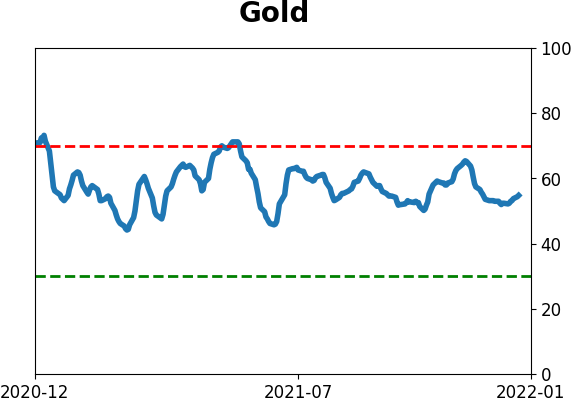
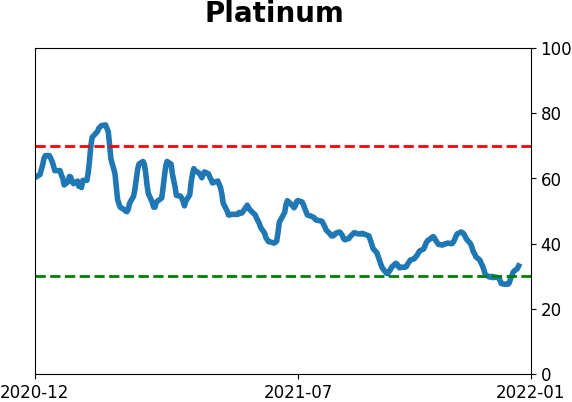
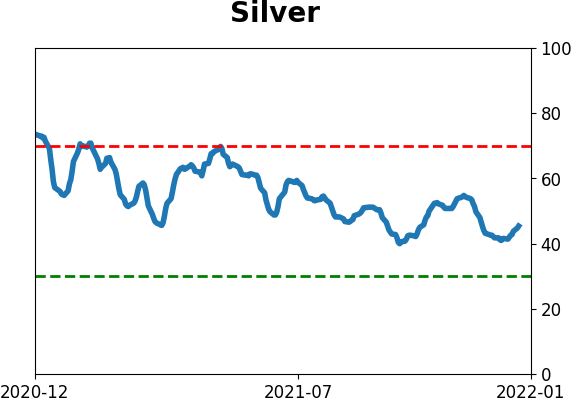
Gold

|
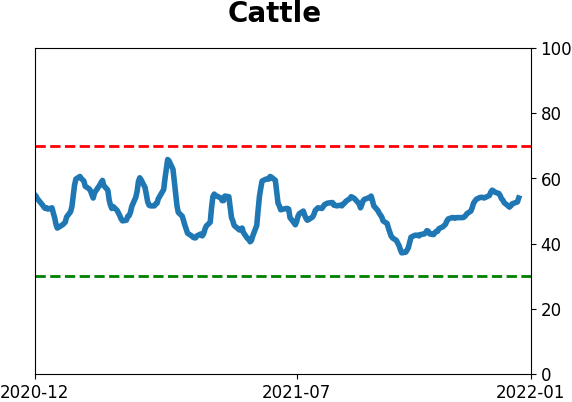
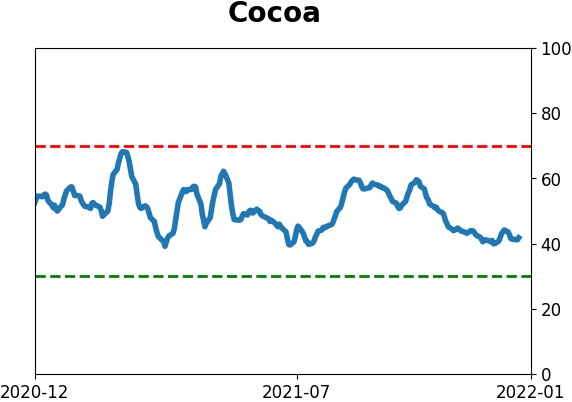
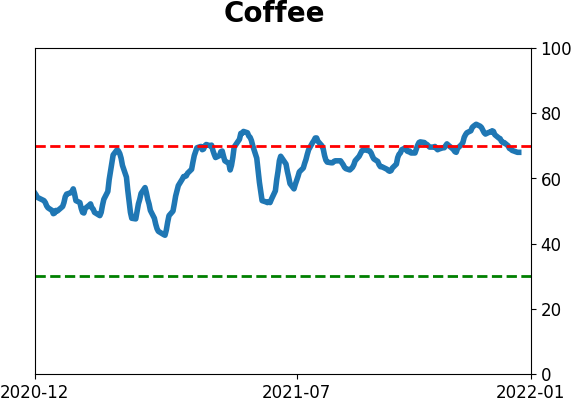
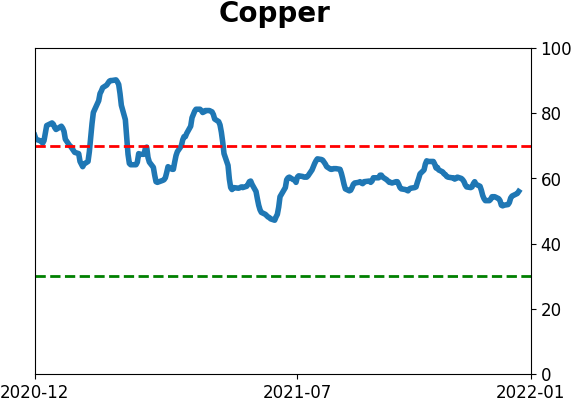
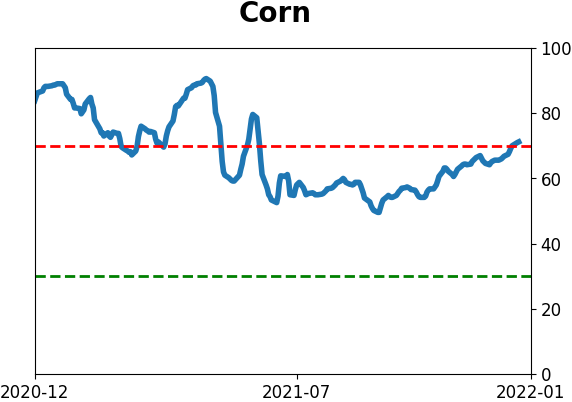
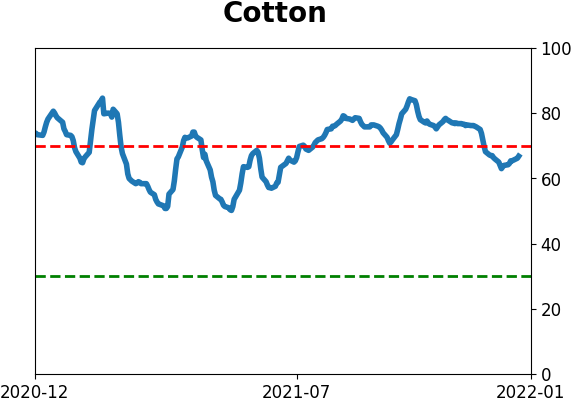
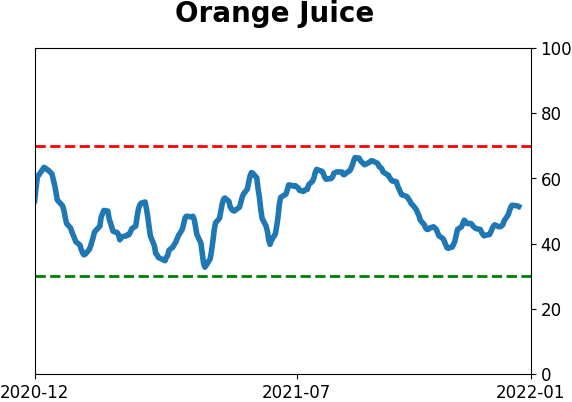
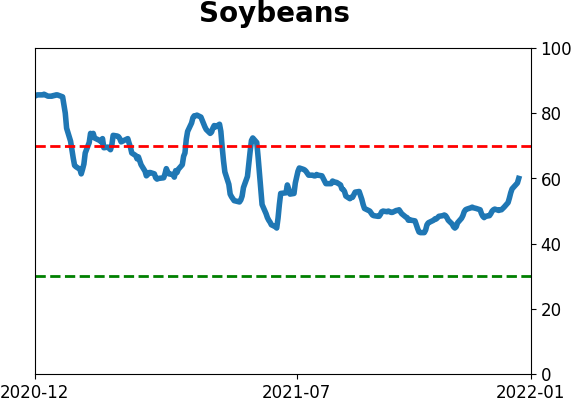
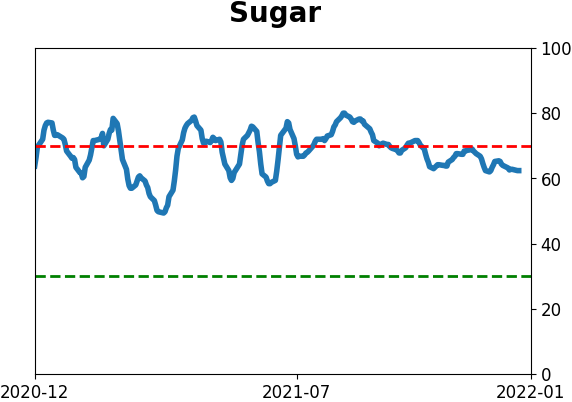
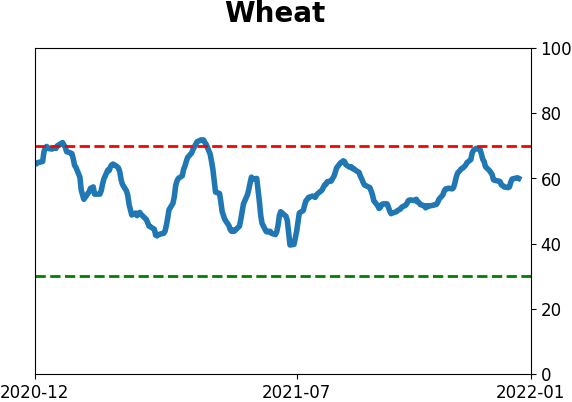
Agriculture

|
|
Research
By Jason Goepfert
BOTTOM LINE
As we head into year-end and Wall Street strategists update their year-ahead price targets, they expect the S&P 500 to continue to rally. At this time of year, when the index is near a high and strategists expect it to continue to rally, it usually does.
FORECAST / TIMEFRAME
None
|
Key points:
- Wall Street strategists expect the S&P 500 to gain about 5% over the next year
- Nearing year-end, this kind of discount has tended to lead to higher prices for the index
Strategists have modest (but positive) expectations for the S&P 500
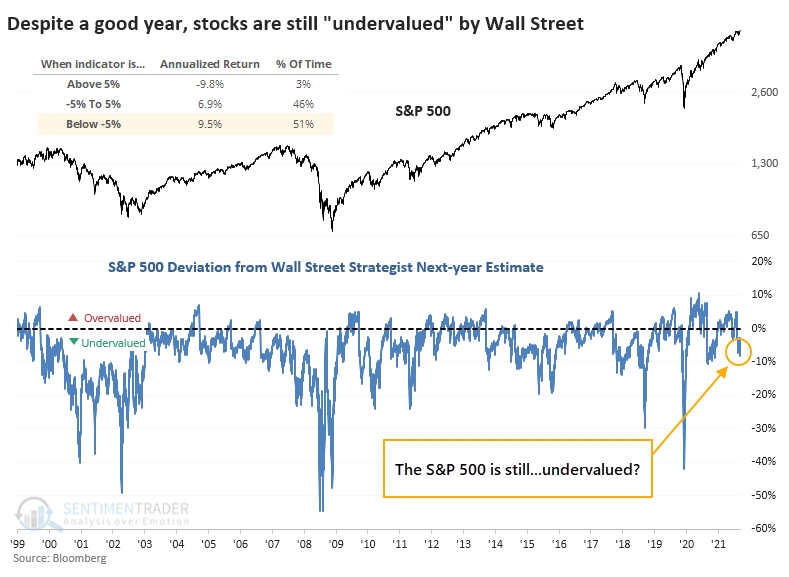
We saw on Monday that individual investors are pessimistic. Wall Street isn't - analysts are busy upgrading price targets, and strategists expect the S&P 500 to add to its gains in the new year. Strategists' average price target for the S&P 500 over the next year is nearly 5% higher than where the S&P was on Monday, suggesting the index is undervalued. LOL.
There are a whole host of caveats with this, including that Bloomberg only sporadically surveys Wall Street, so this could change quickly, but their estimates would likely be increased, not decreased.
Based on current figures, when the S&P is more than 4.5% below strategists' year-ahead estimated price, the index returned an annualized +9.5%, versus a wretched -9.8% when the index was at least 4.5% above strategists' estimate.
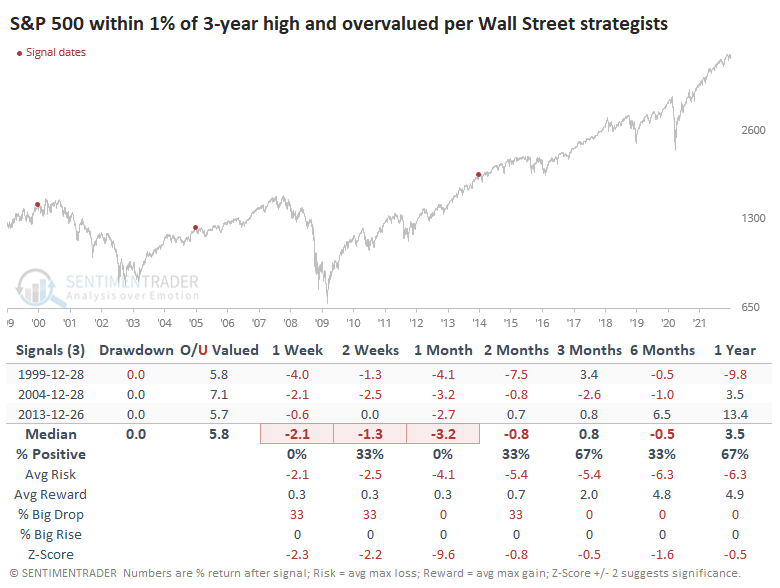
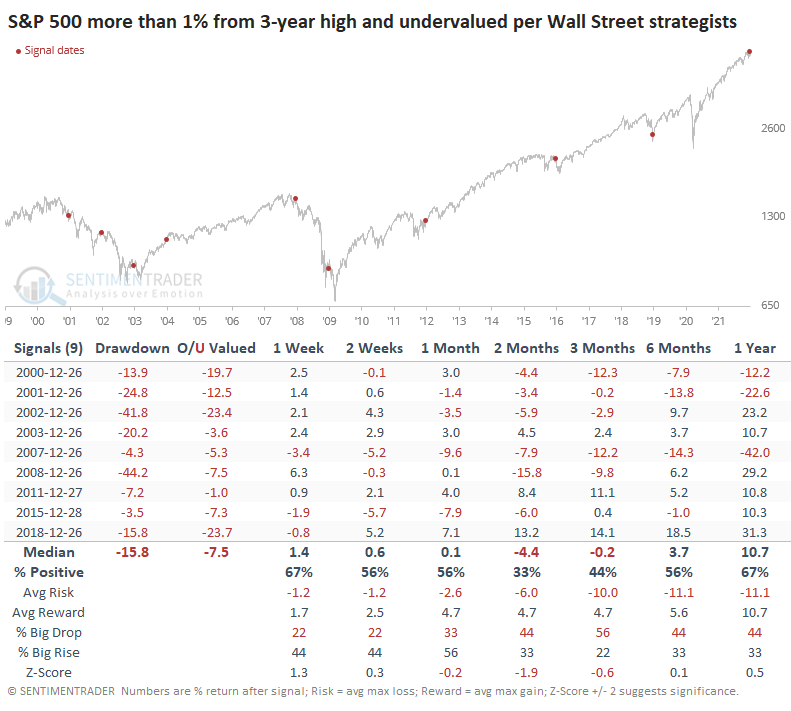
Looking at all years when there were 3 trading days left in the year, and the S&P was within 1% of a multi-year high, this is one of a handful that shows the S&P was still undervalued. And that was mostly a good sign for forward returns, especially in the first couple weeks of the new year. The only loser, in early 2015, reversed its losses in February.
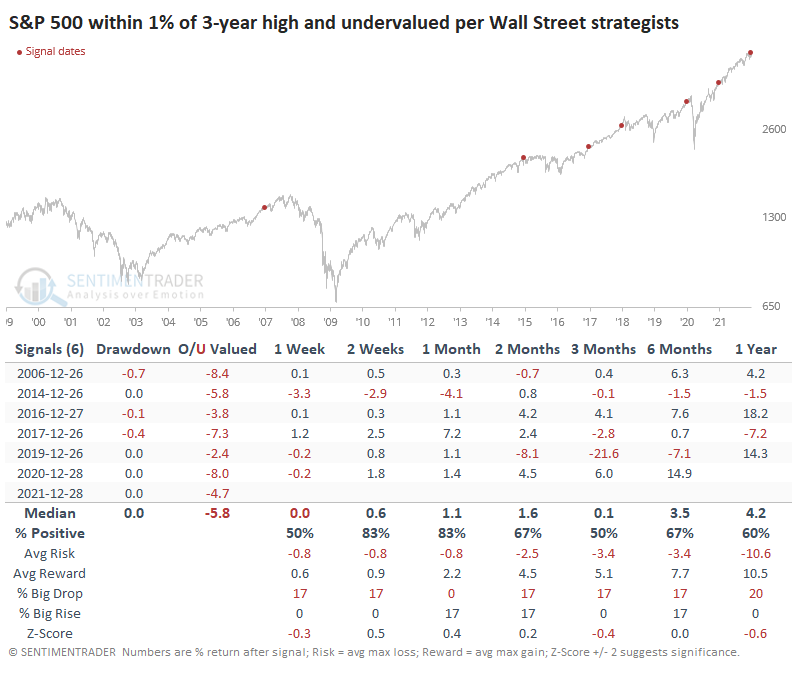
There were only 3 years when the S&P was within 1% of a high, and strategists thought the index was overvalued. All preceded declines.
When the S&P was further from a high (mostly bear market environments), forward returns were significantly worse even if strategists thought the index was undervalued.
What the research tells us...
Wall Street analysts and strategists are considered among the smartest of smart money. That isn't always the case, but when it comes to strategists, the S&P 500 does tend to revert toward their price targets over time. Granted, they have a 9% return as a baseline and rarely stray too far. When the S&P gets too far above or below their estimates, the index tends to snap back. The idea that it's currently about 5% below strategists' estimates suggests it has more room to rally.
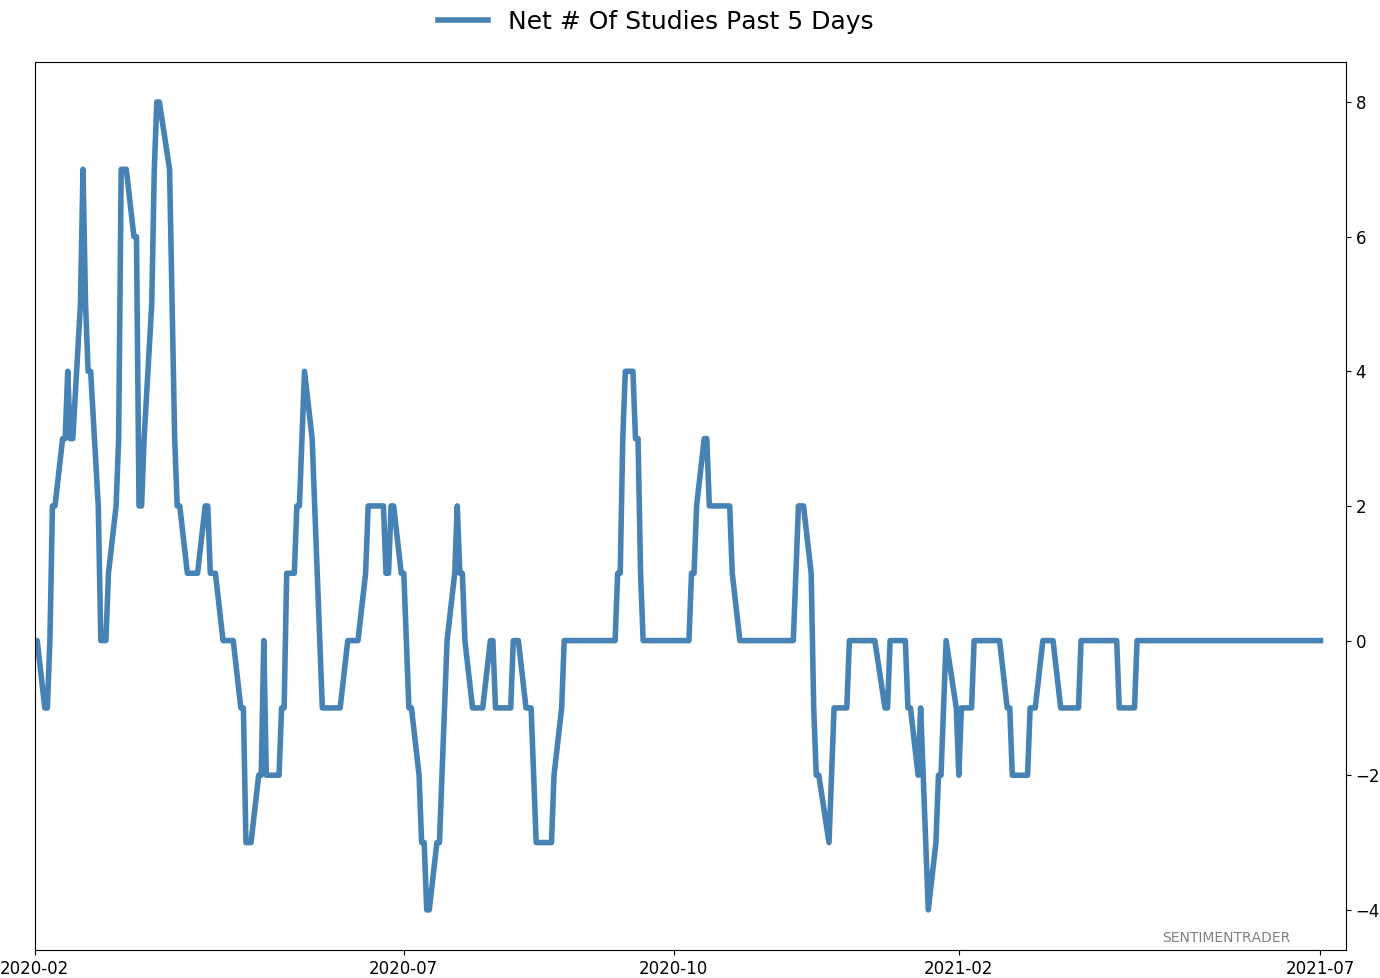
Active Studies
| Time Frame | Bullish | Bearish | | Short-Term | 1 | 0 | | Medium-Term | 9 | 2 | | Long-Term | 9 | 4 |
|
Indicators at Extremes
Portfolio
| Position | Description | Weight % | Added / Reduced | Date | | Stocks | RSP | 10.7 | Added 6.4% | 2021-10-01 | | Bonds | 32.7% BND, 7.1% SCHP | 39.8 | Added 8.3% | 2021-10-26 | | Commodities | GCC | 2.4 | Reduced 2.1%
| 2020-09-04 | | Precious Metals | GDX | 4.6 | Reduced 4.2% | 2021-05-19 | | Special Situations | 9.8% KWEB, 4.7% XLE, 2.9% PSCE | 17.3 | Added 9.78% | 2021-10-01 | | Cash | | 24.1 | | |
|
Updates (Changes made today are underlined)
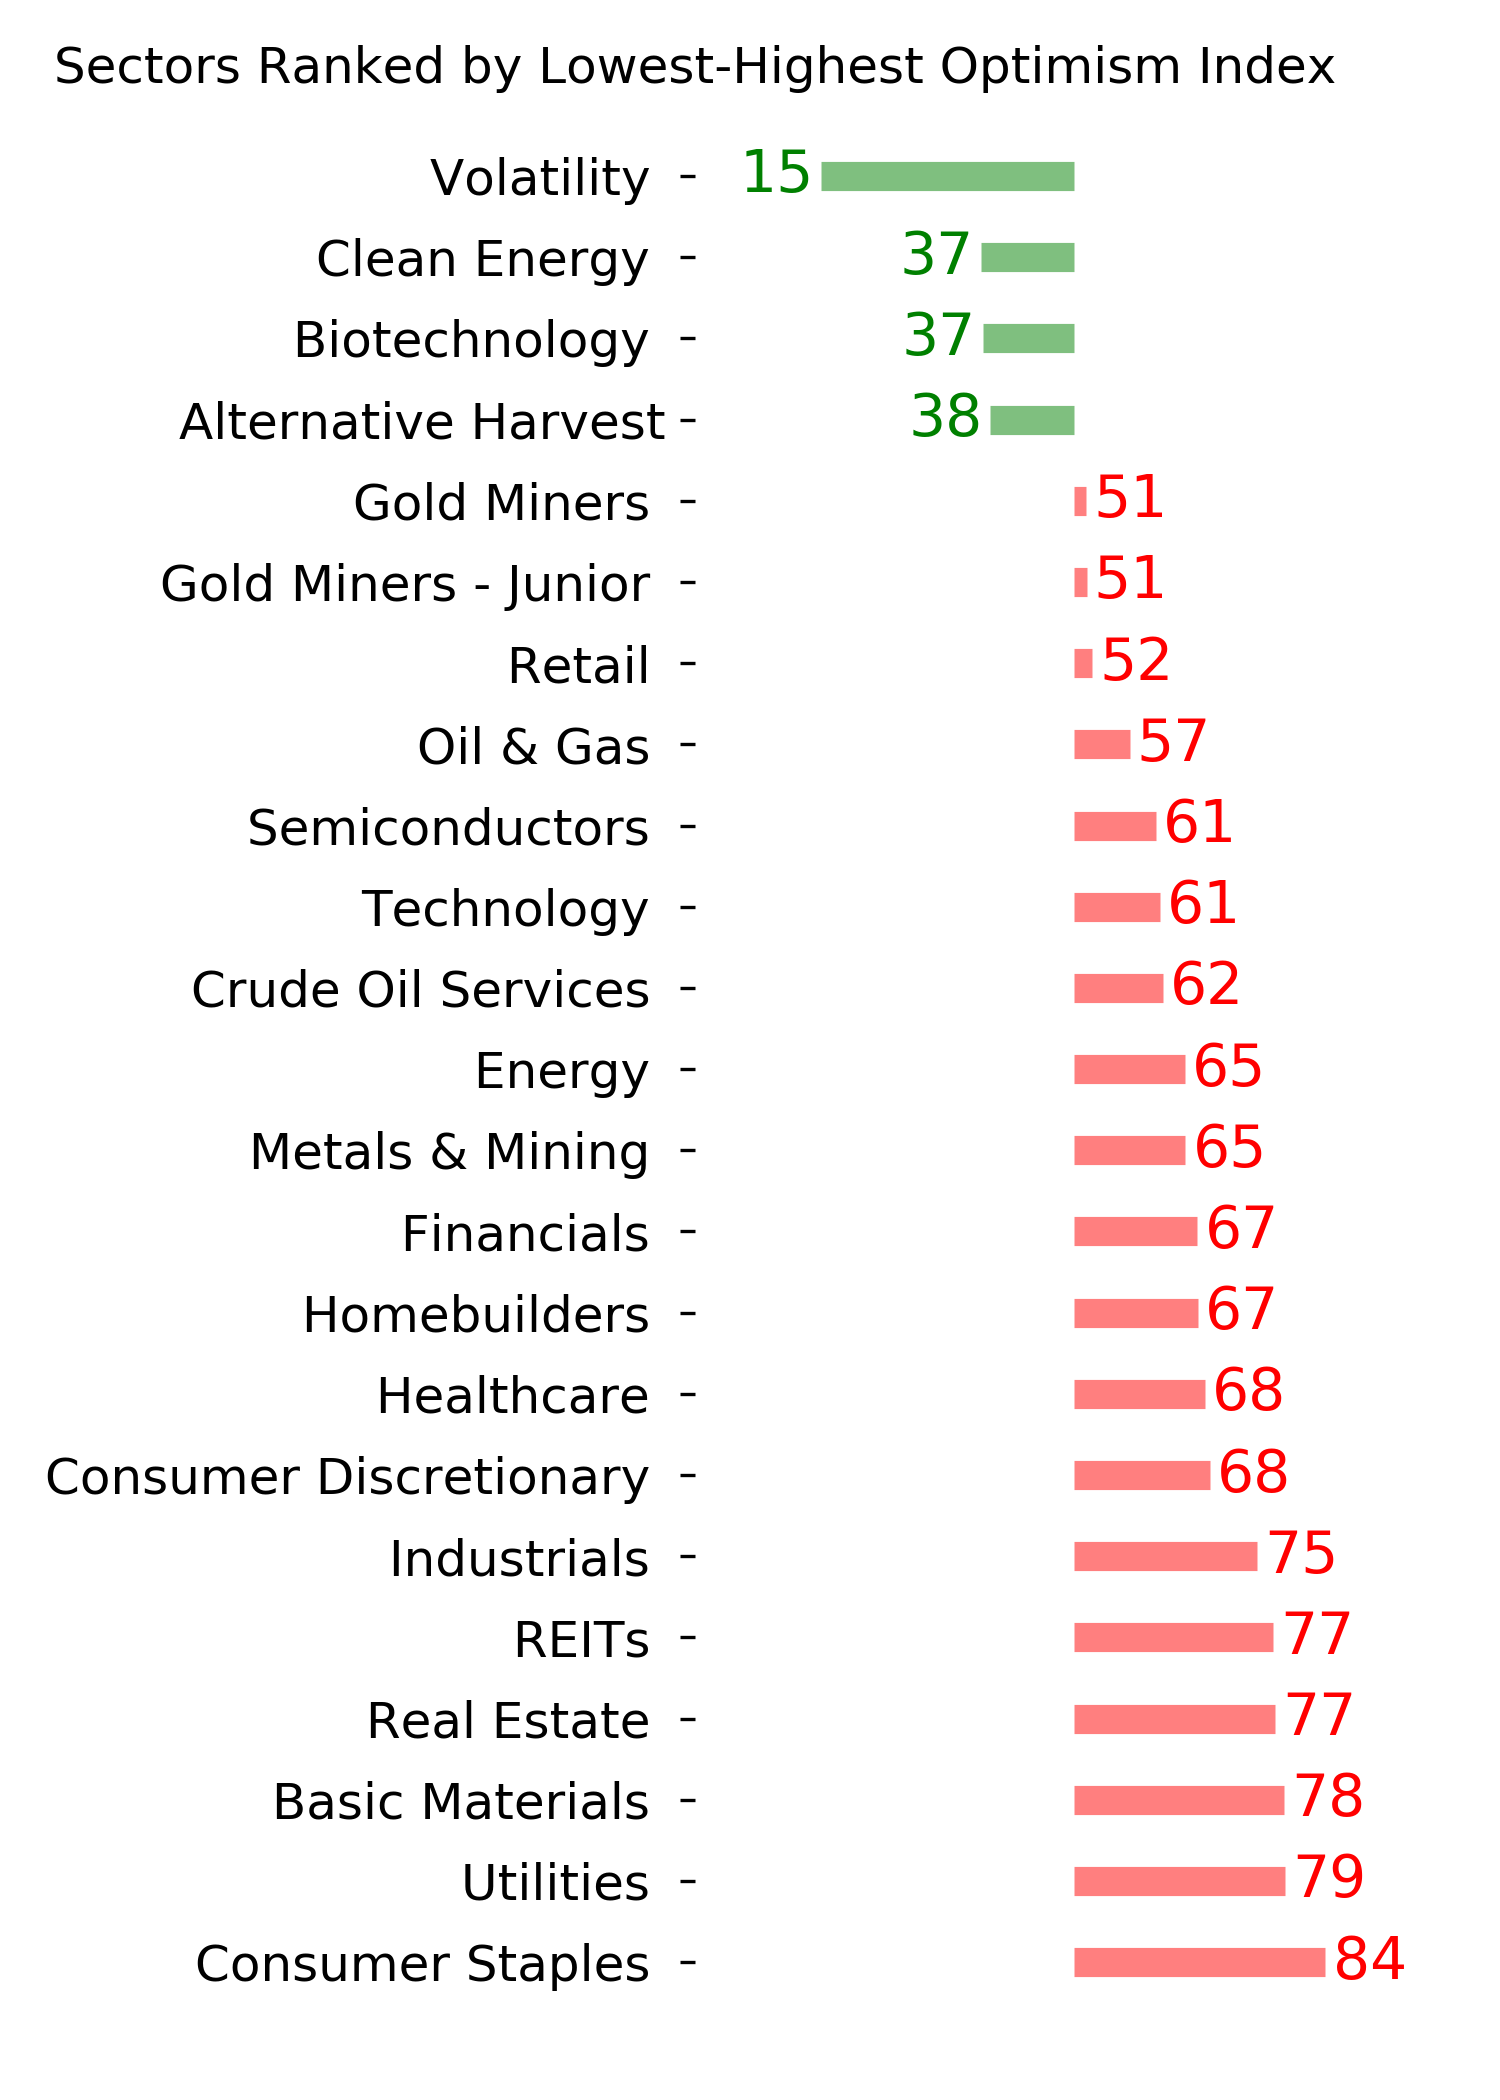
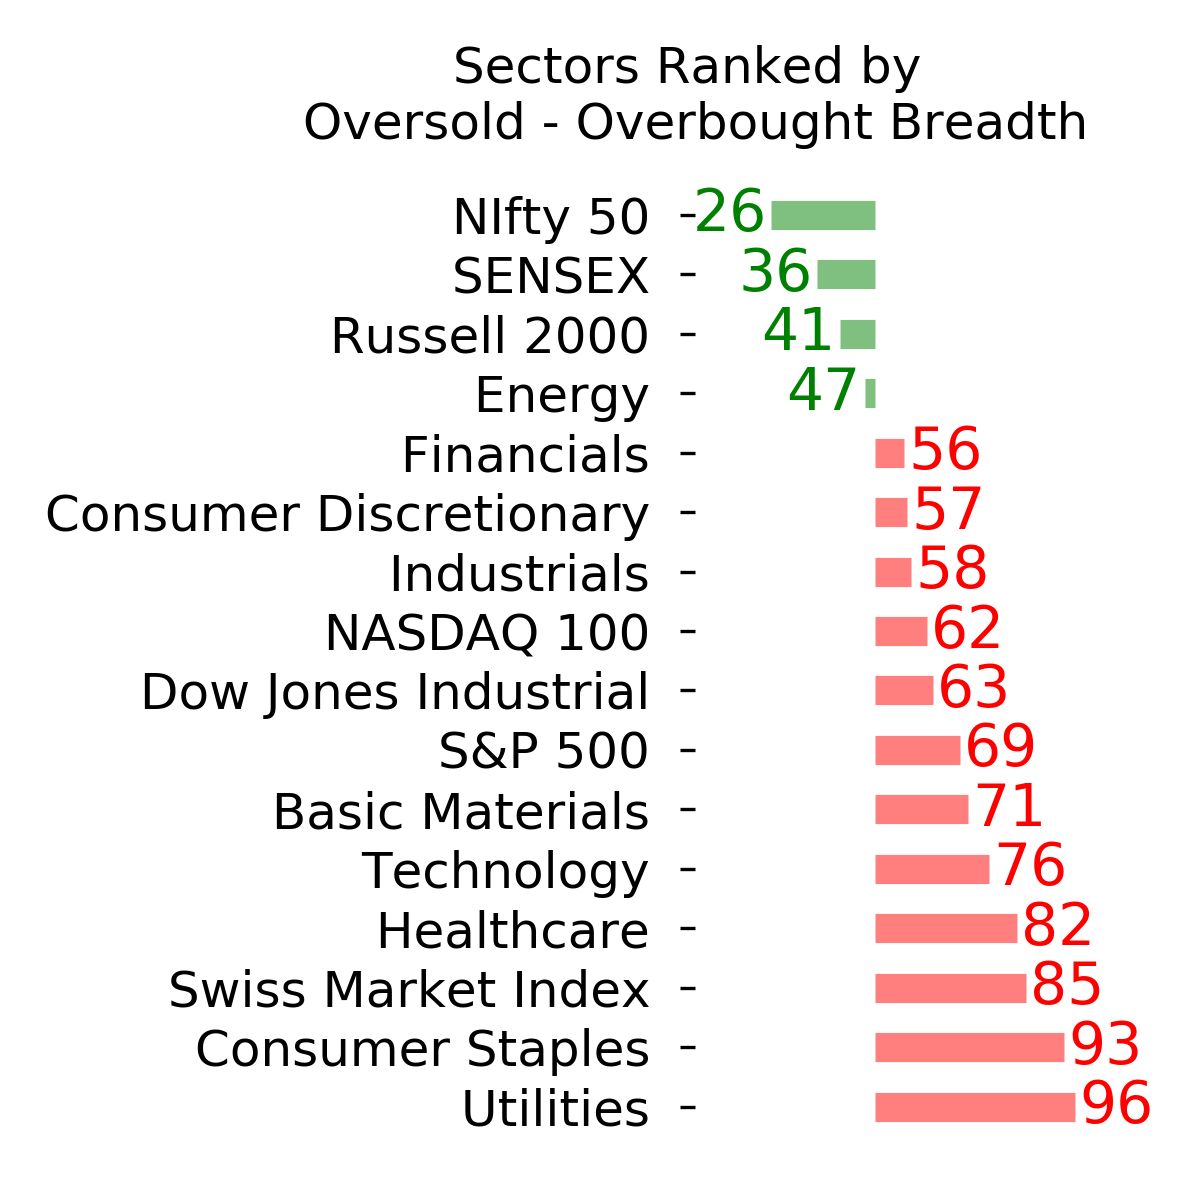
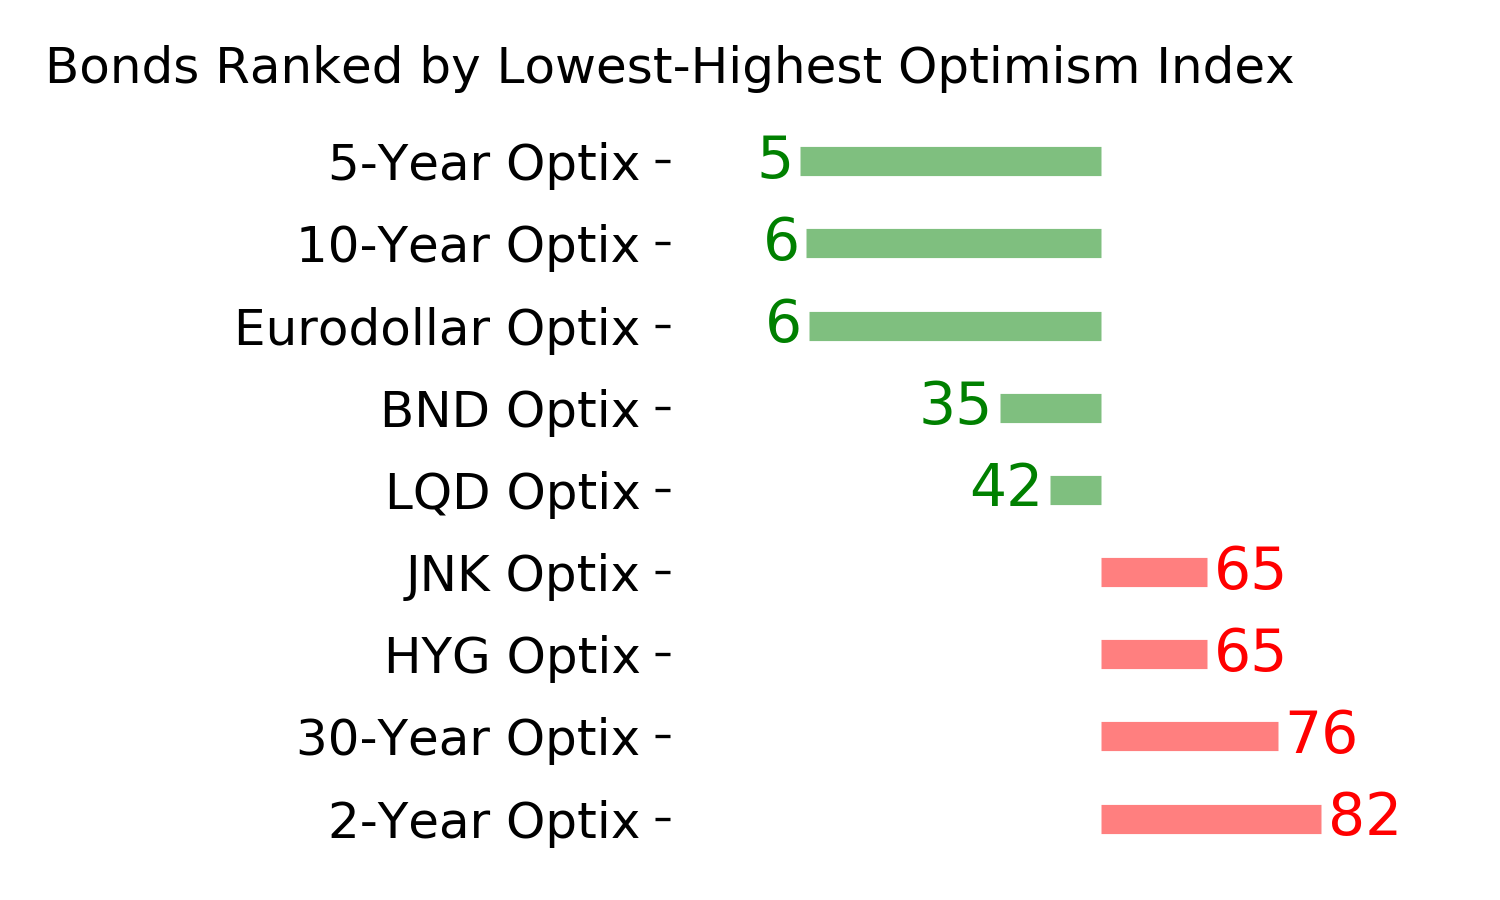
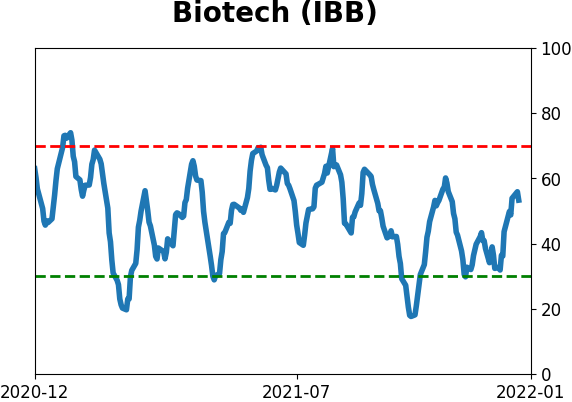
No surprise for 2021, but we're seeing conflicting messages in some of what has developed lately. There was a jump in pessimism heading into December, which has been relieved to some degree. The subsequent breadth thrust has extremely positive implications for forward returns, especially longer-term. The negatives are mostly sector-related, especially the negative divergences among Nasdaq 100 stocks. Consumer Staples have seen an impressive surge, and Biotech may be oversold, but otherwise there are a whole lot of crosscurrents and seemingly not much edge. Bond sentiment is trying to recover from a recent bout of pessimism, and gold stocks are doing their thing which is not much at all. They've been flat for six months. Chinese tech stocks were doing exactly what they're supposed to do, then did *not* by plunging to new lows. This is troubling on a shorter-term time frame, but this was never meant for a trade, rather a multi-year investment. Recent behavior is troubling and I will not be adding any exposure as long as that's the case. RETURN YTD: 8.0% 2020: 8.1%, 2019: 12.6%, 2018: 0.6%, 2017: 3.8%, 2016: 17.1%, 2015: 9.2%, 2014: 14.5%, 2013: 2.2%, 2012: 10.8%, 2011: 16.5%, 2010: 15.3%, 2009: 23.9%, 2008: 16.2%, 2007: 7.8%
|
|
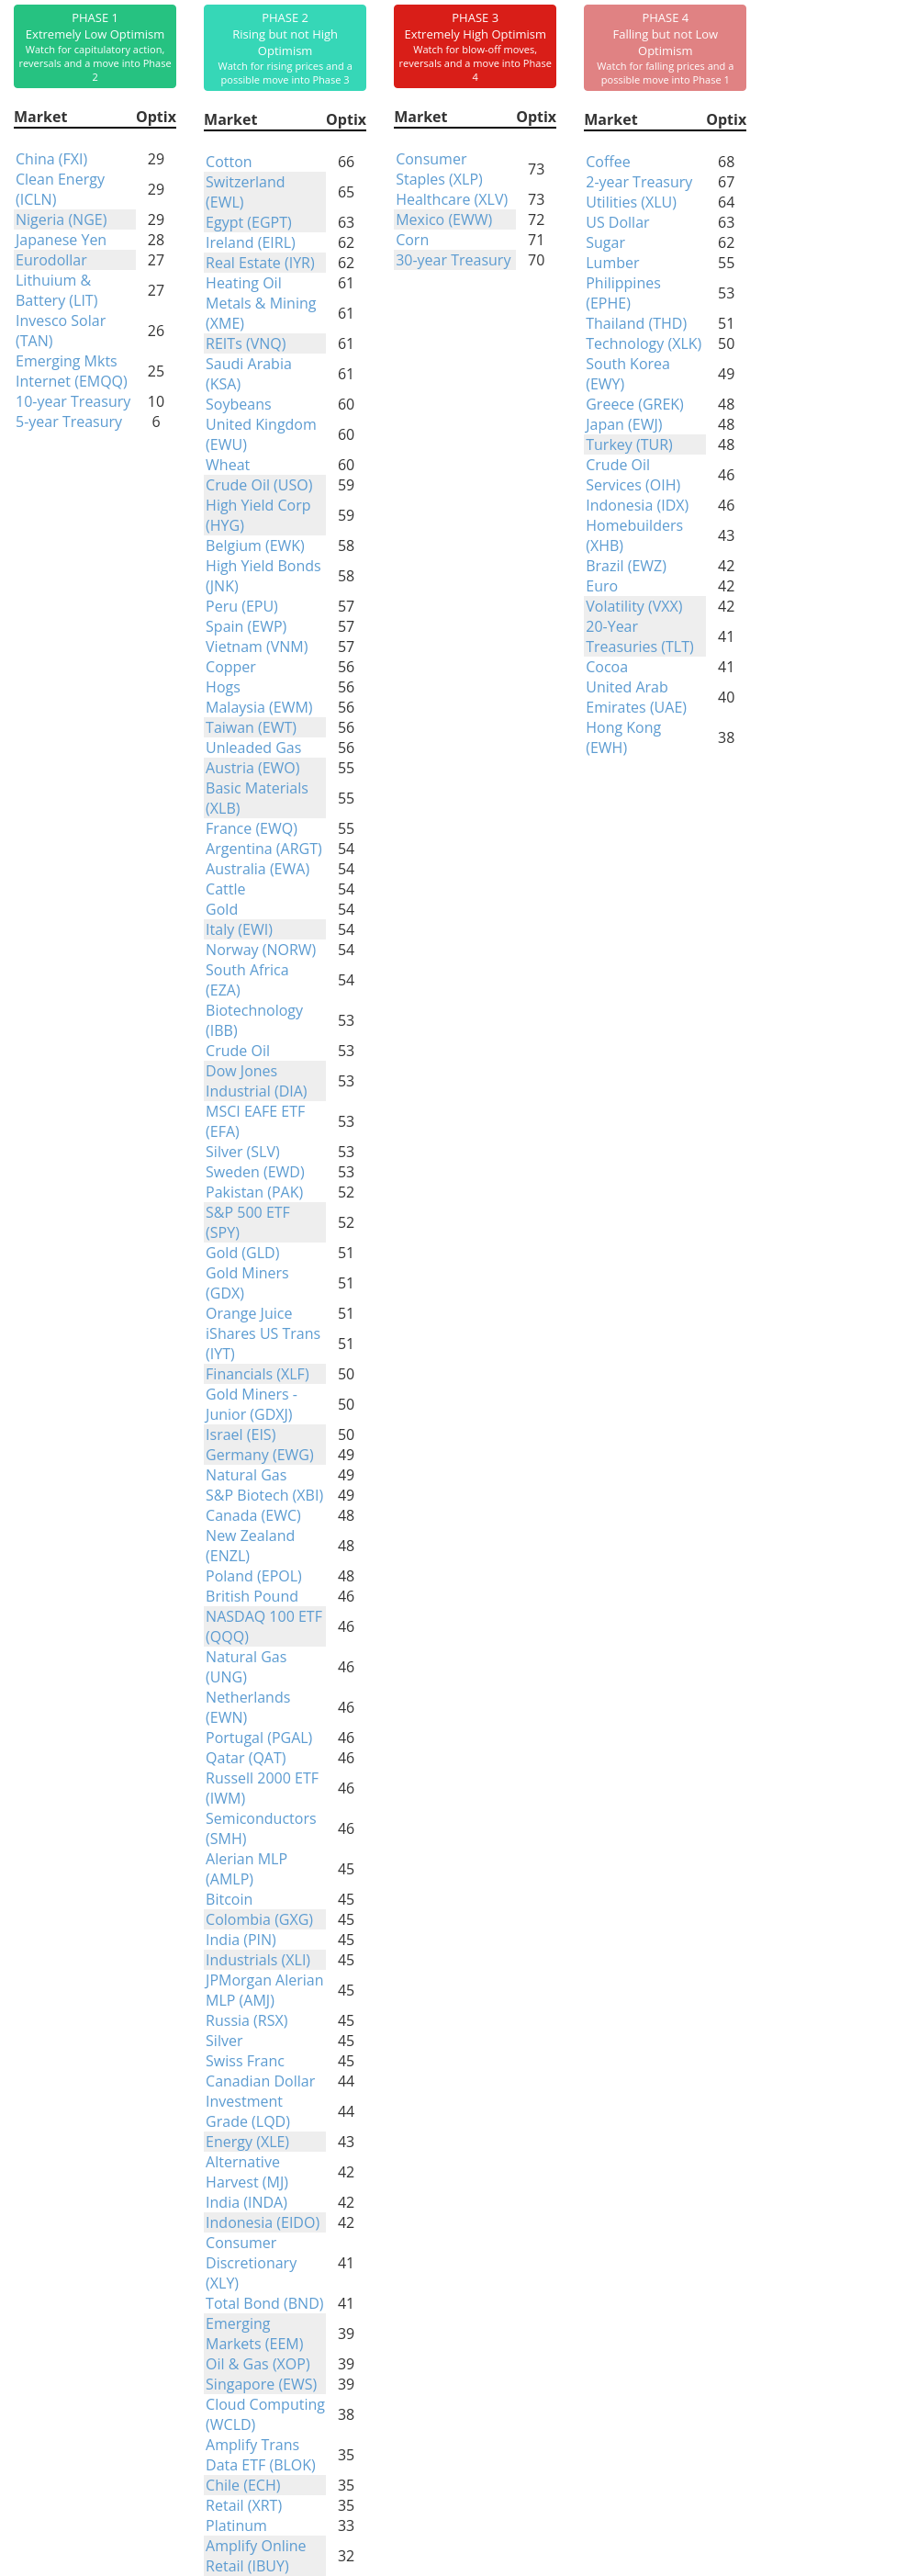
Phase Table
Ranks
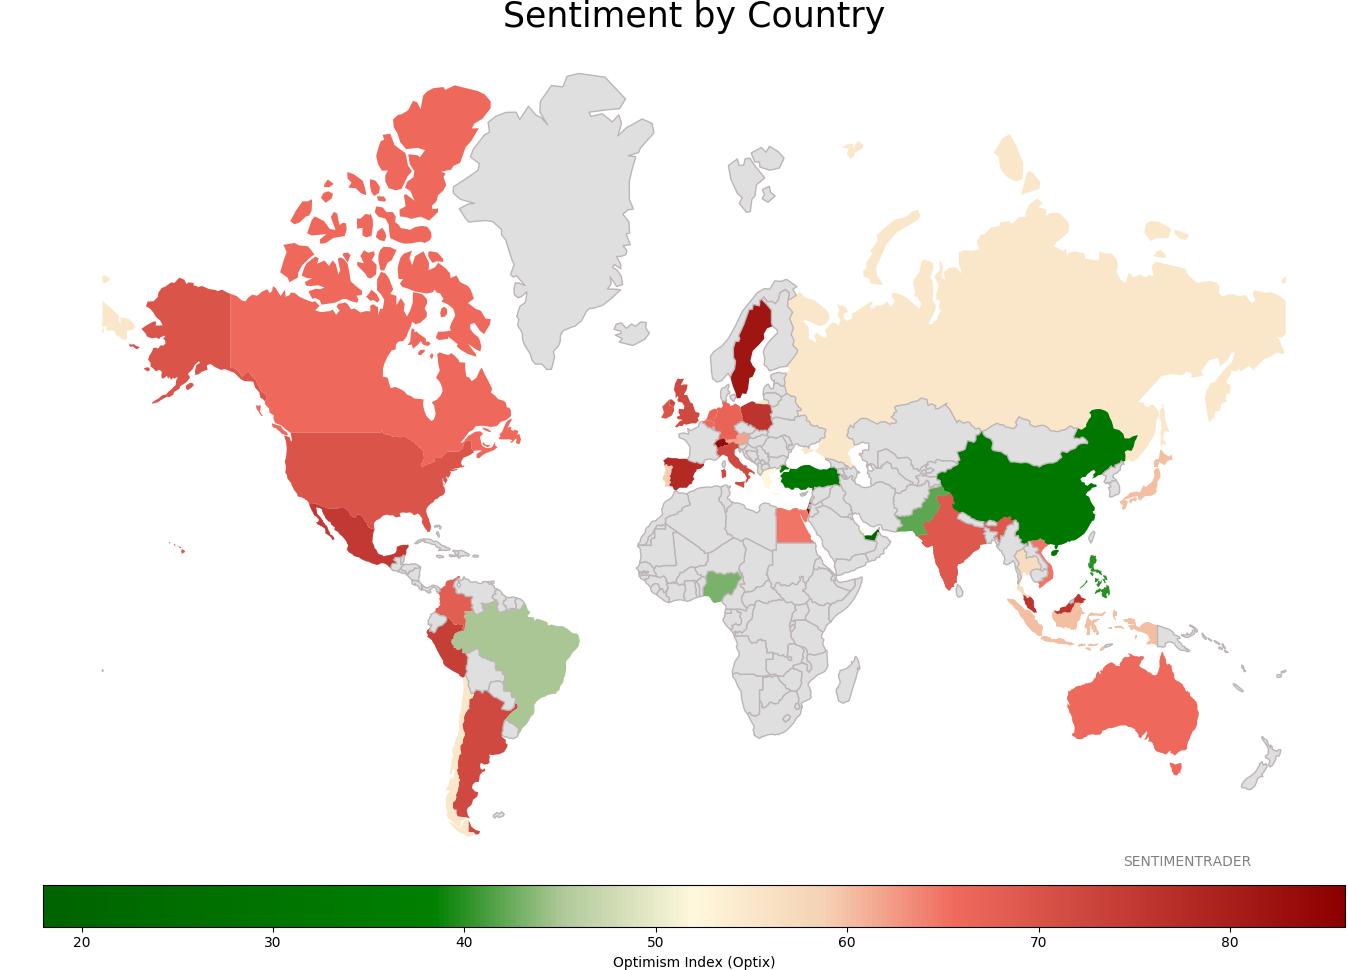
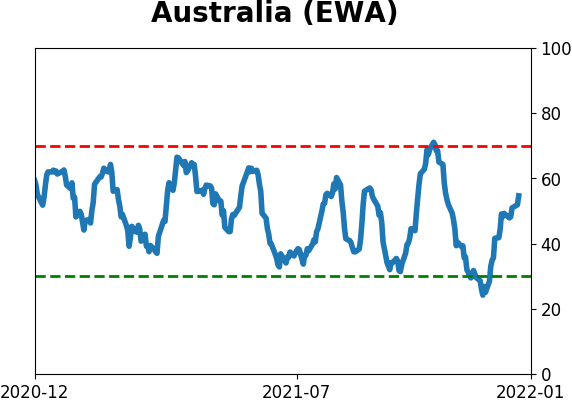
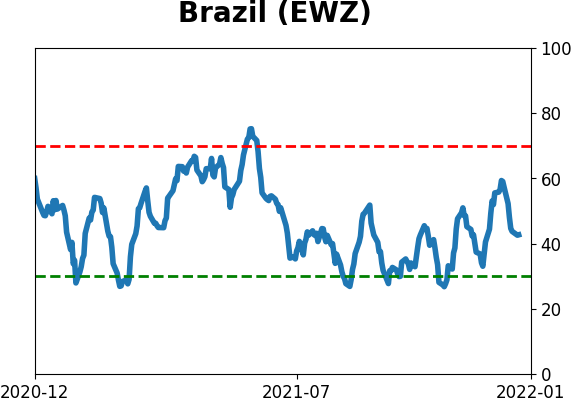
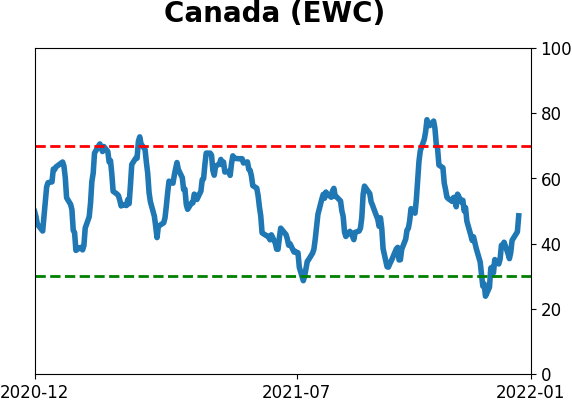
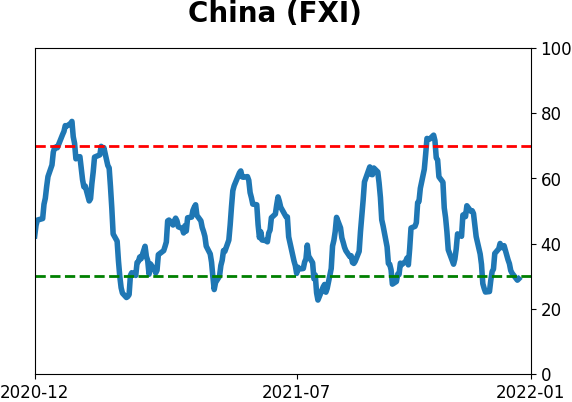
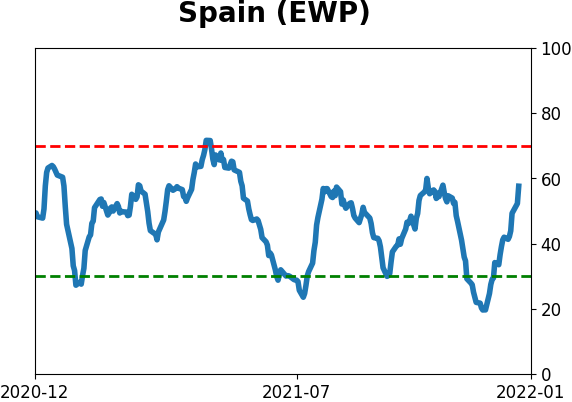
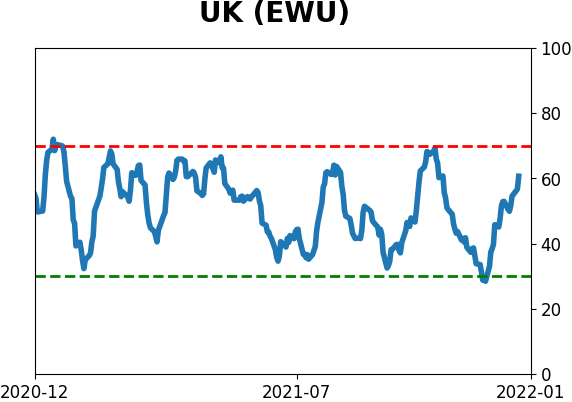
Sentiment Around The World
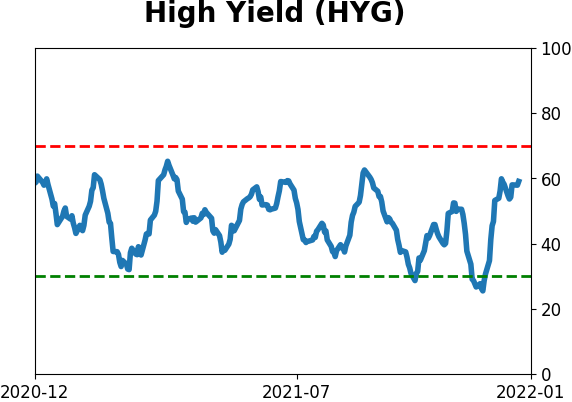
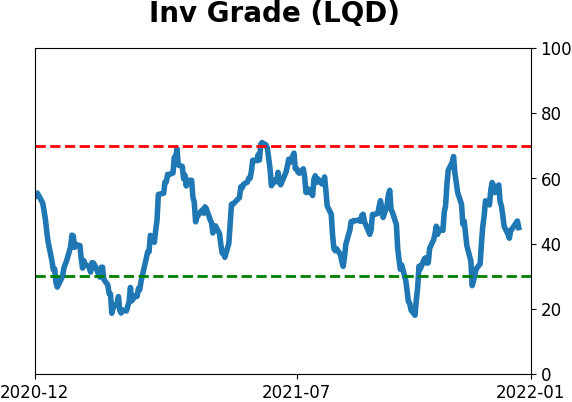
Optimism Index Thumbnails
|
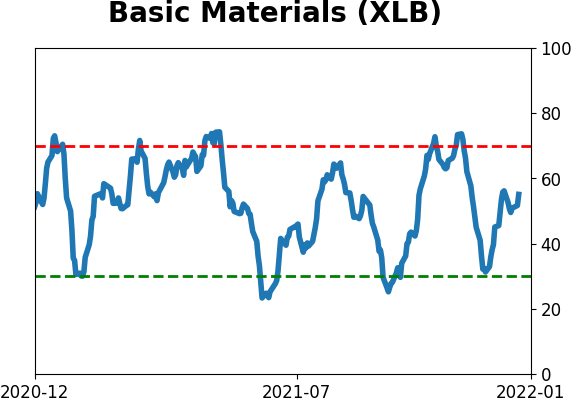
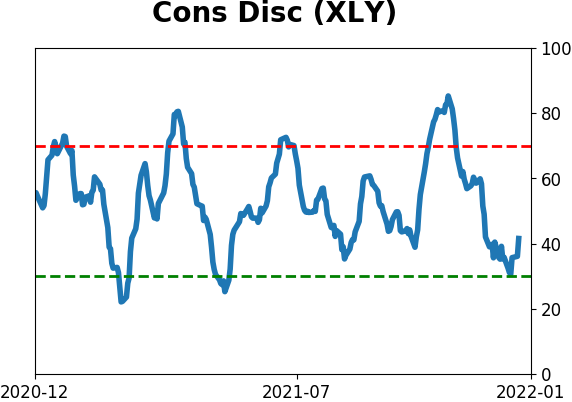
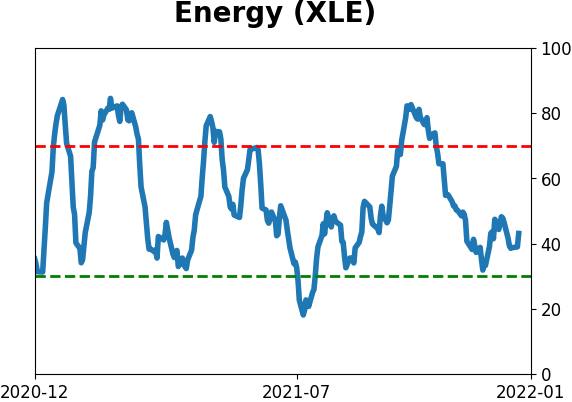
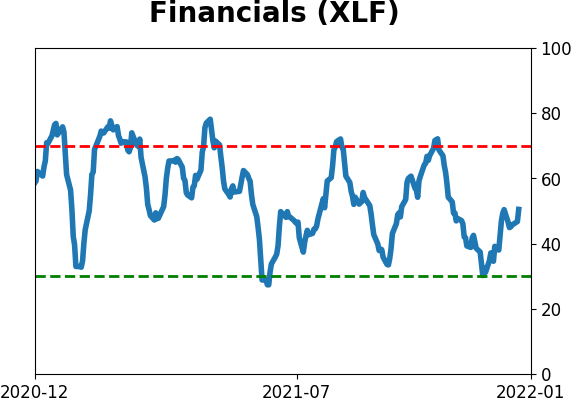
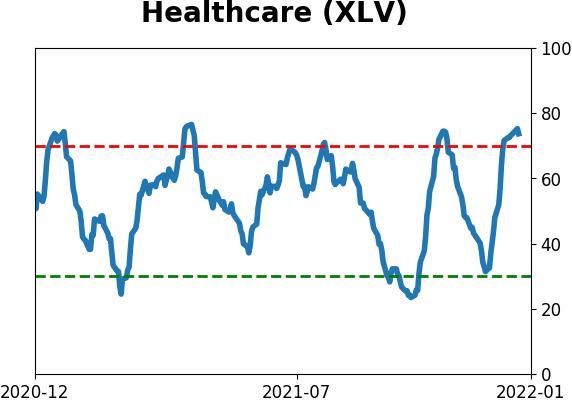
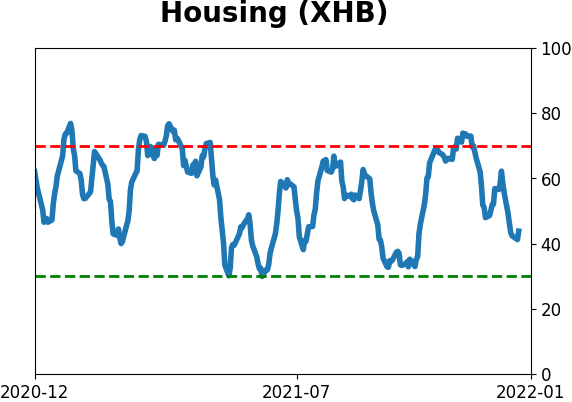
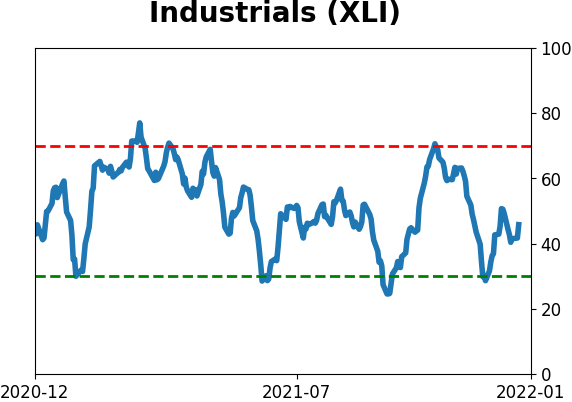
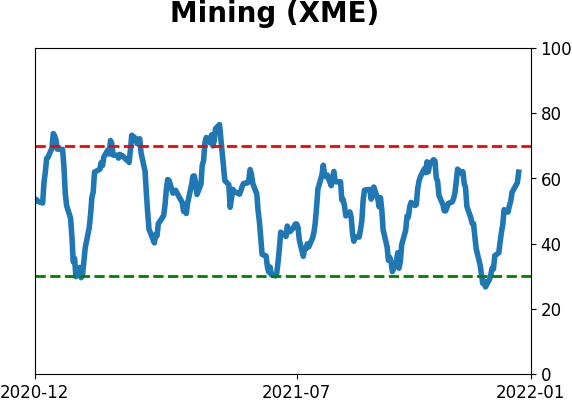
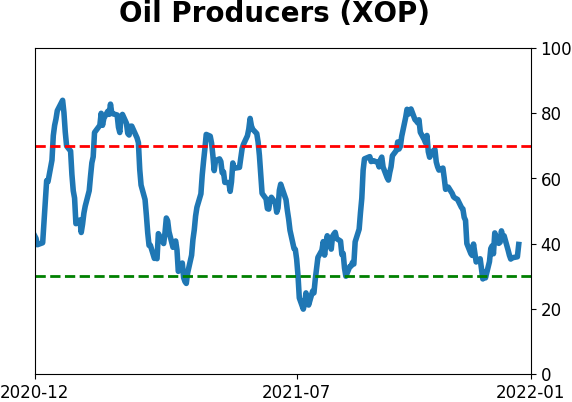
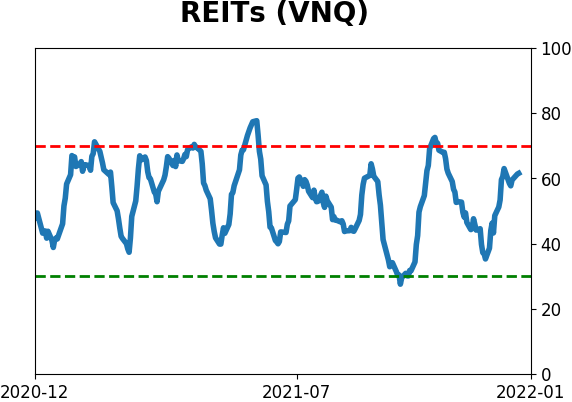
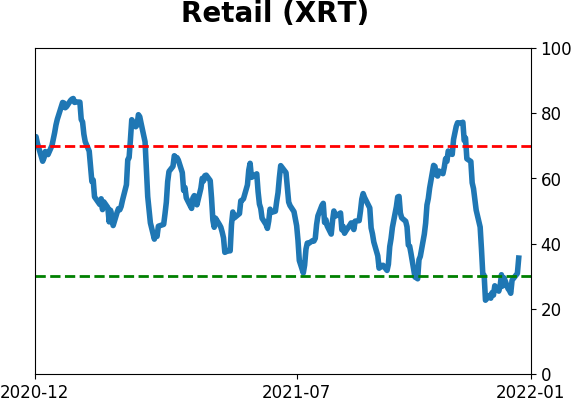
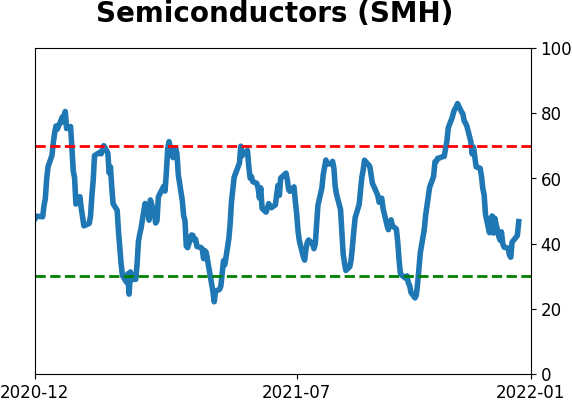
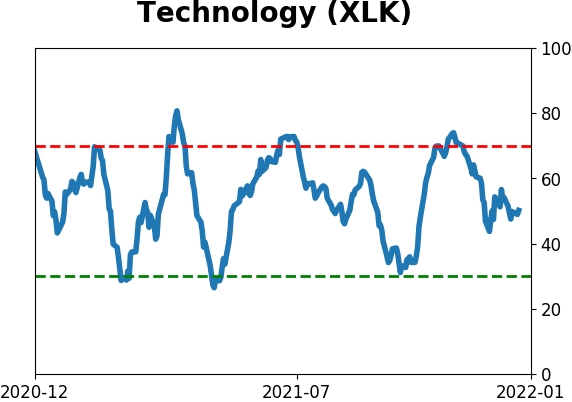
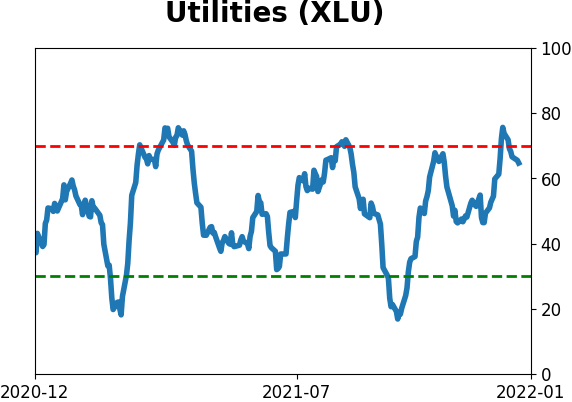
Sector ETF's - 10-Day Moving Average
|
|
|
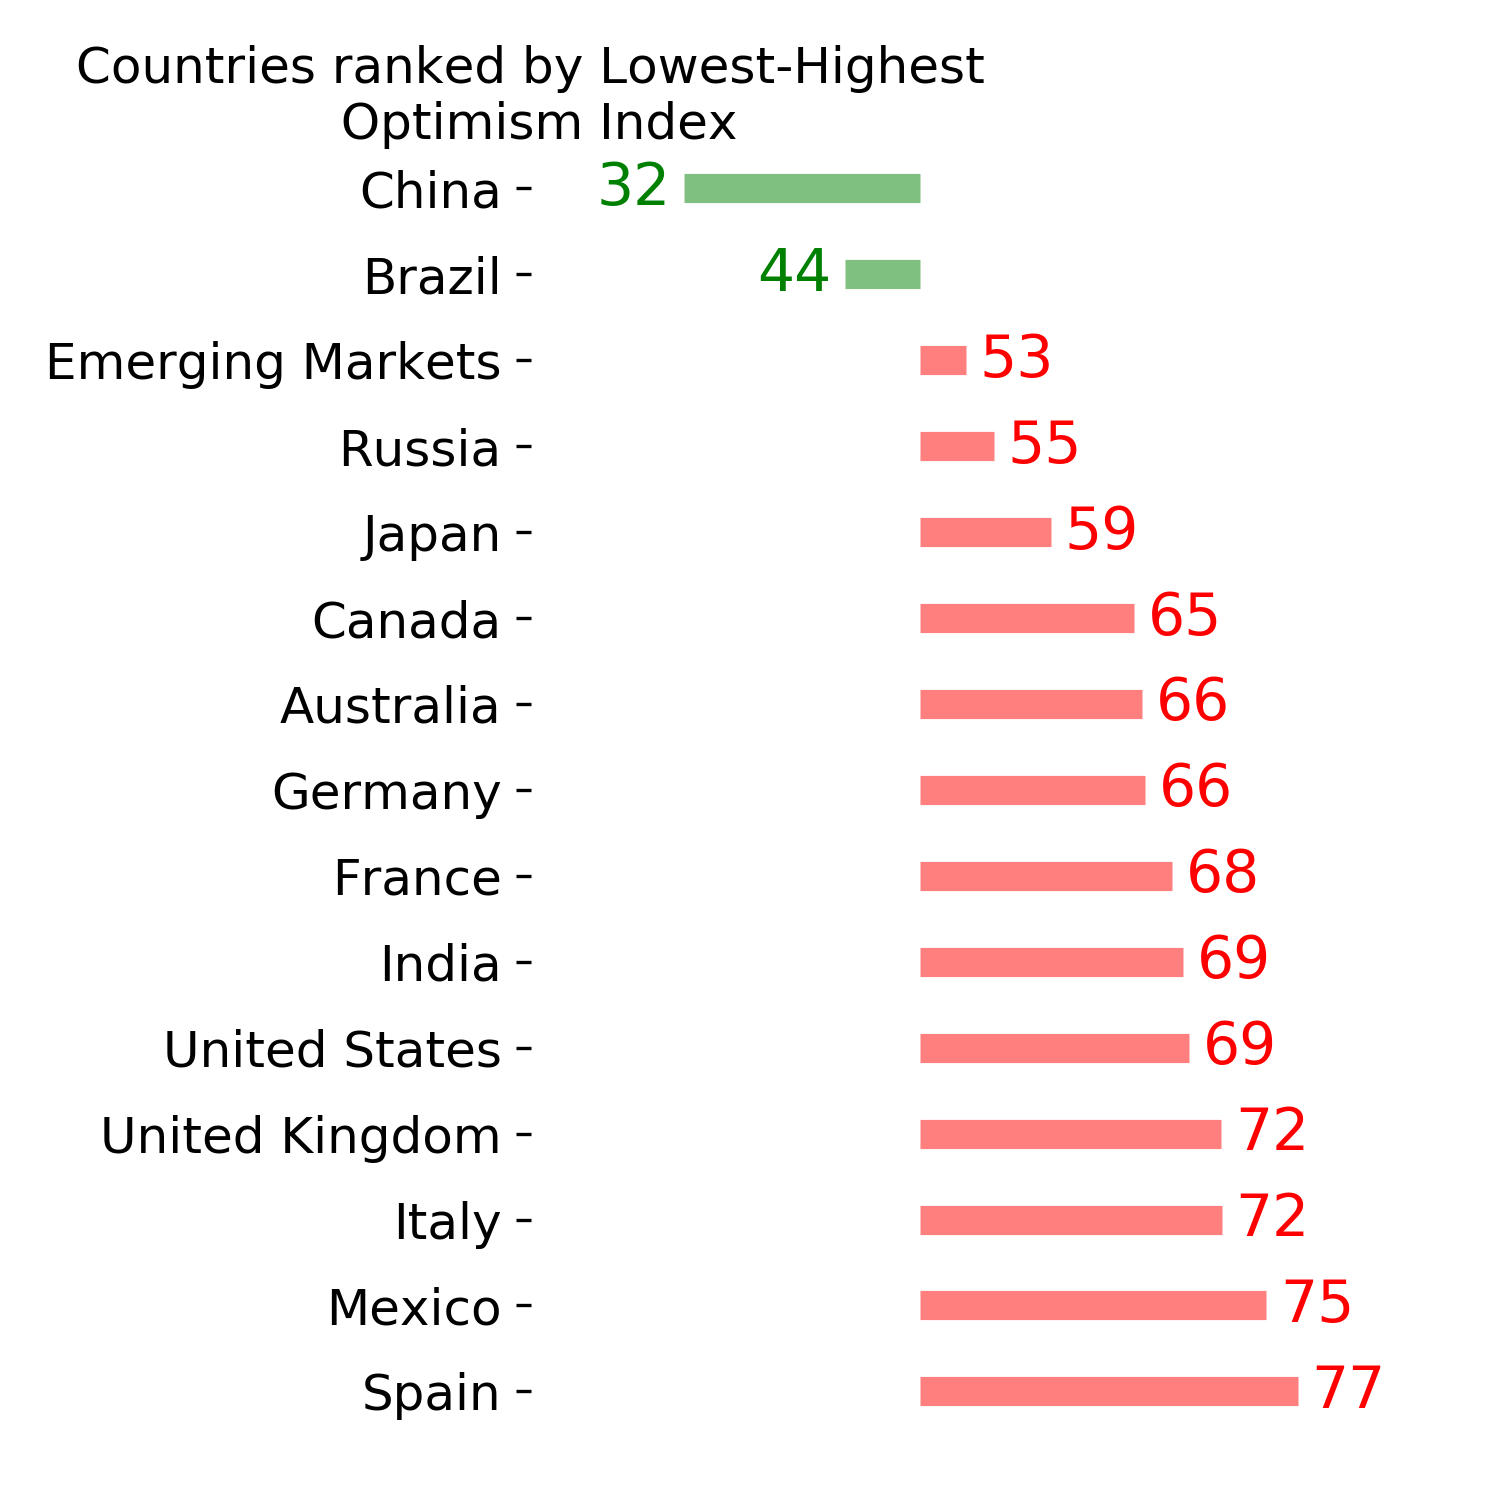
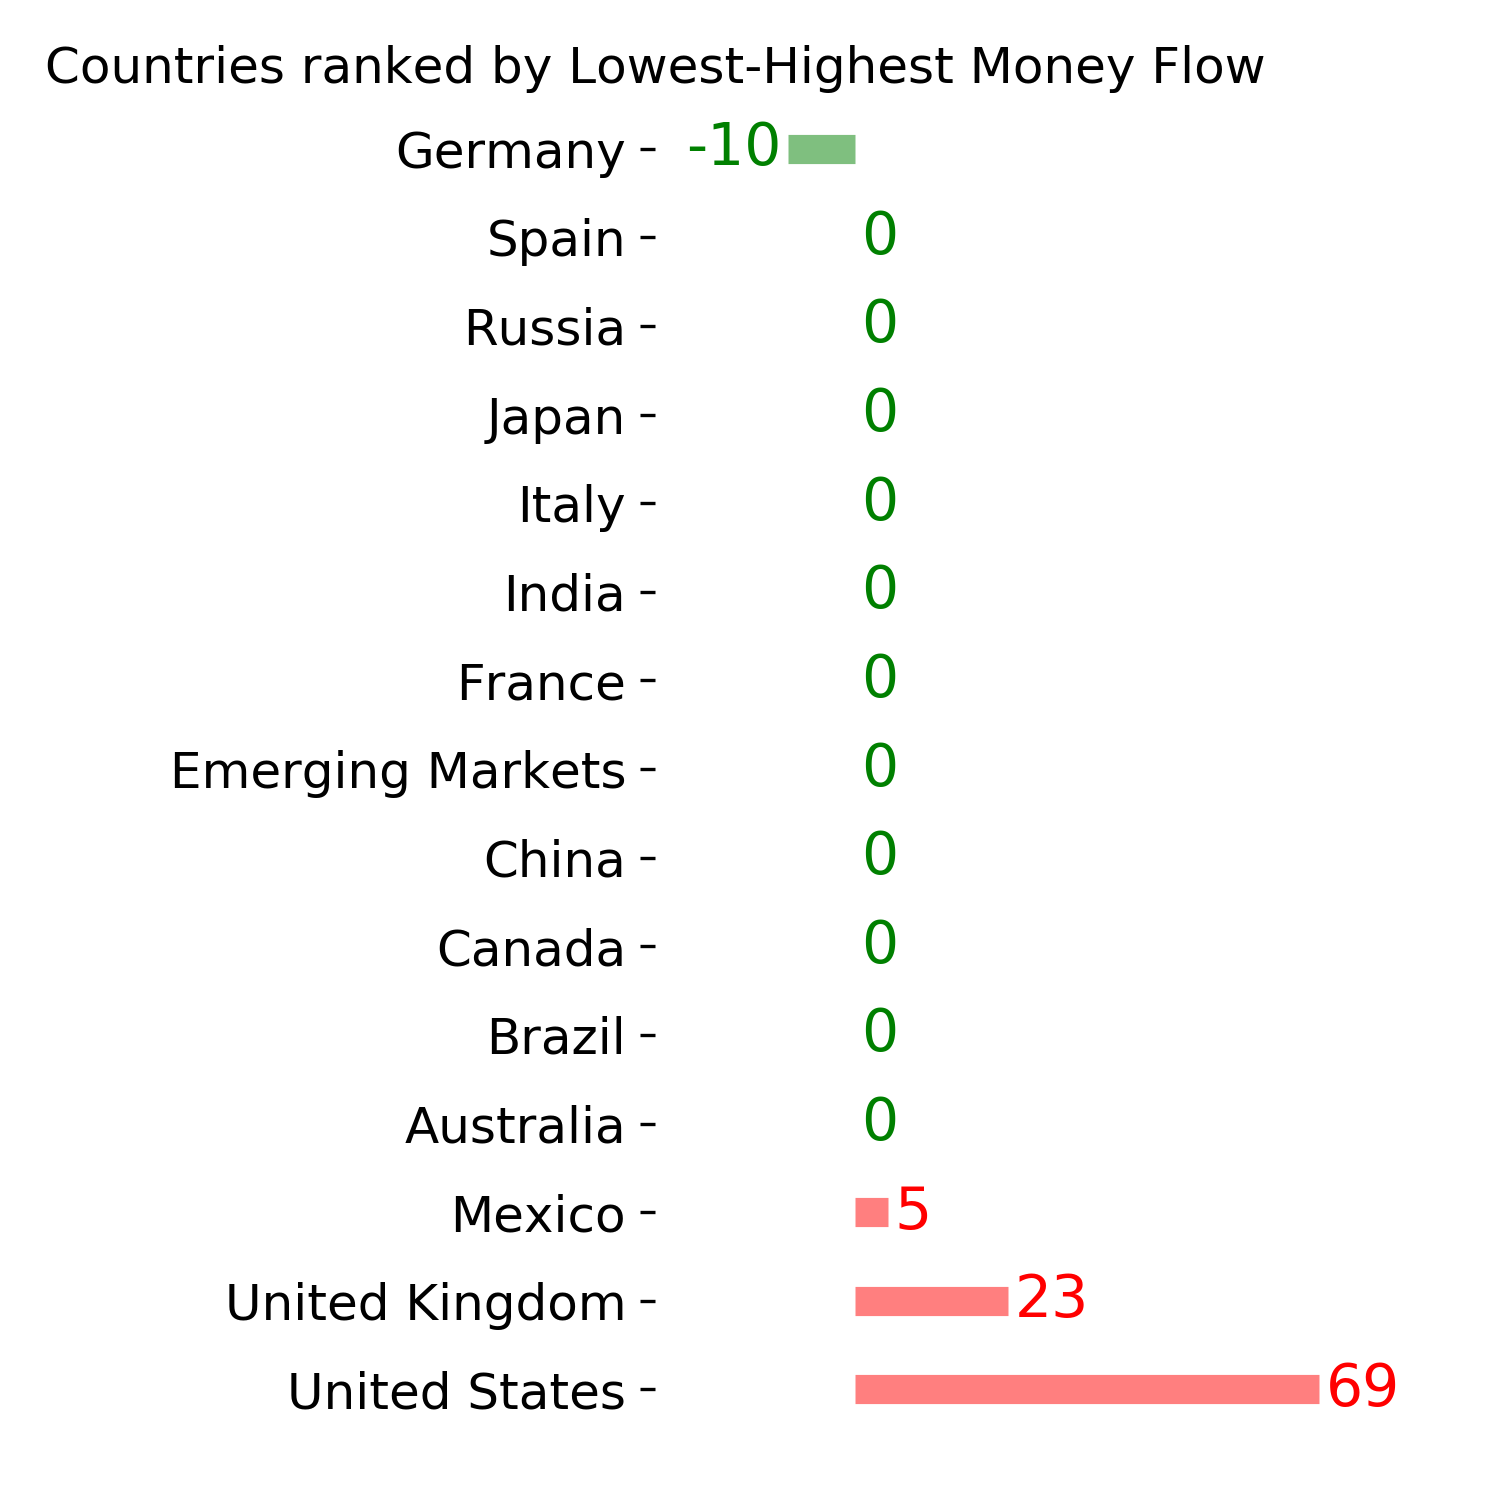
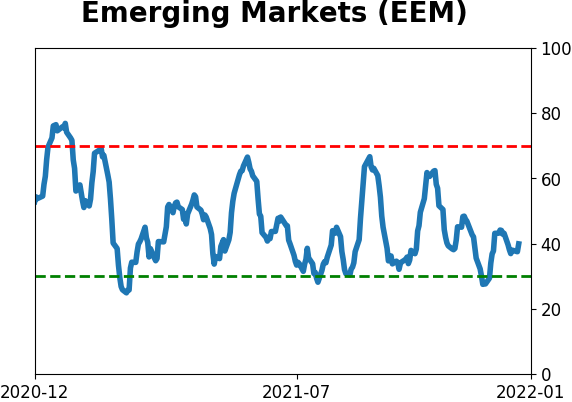
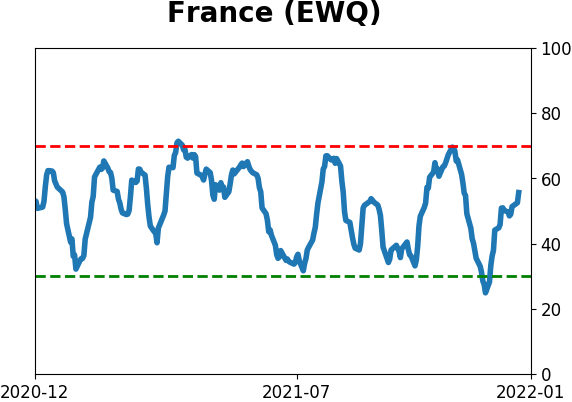
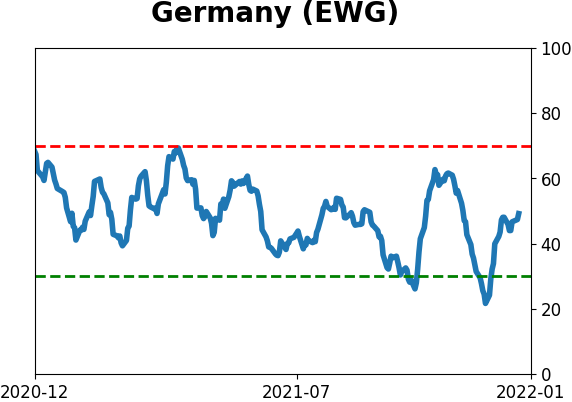
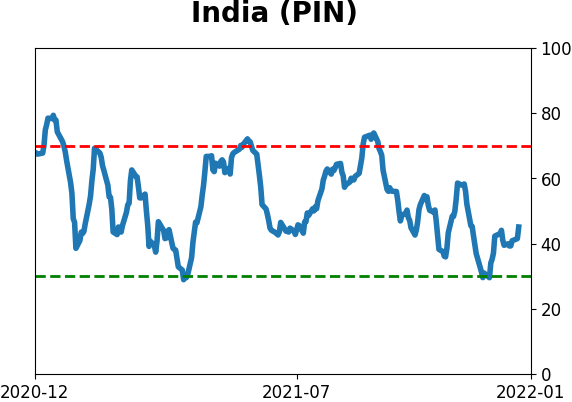
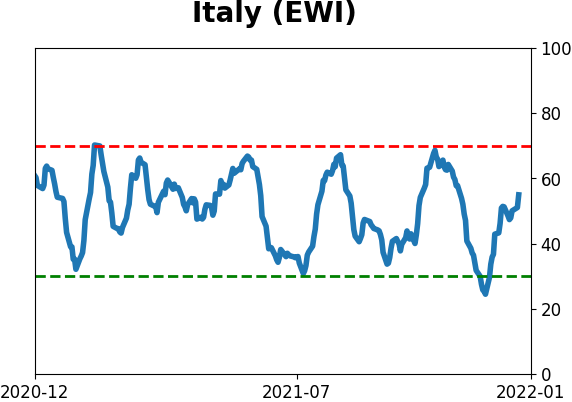
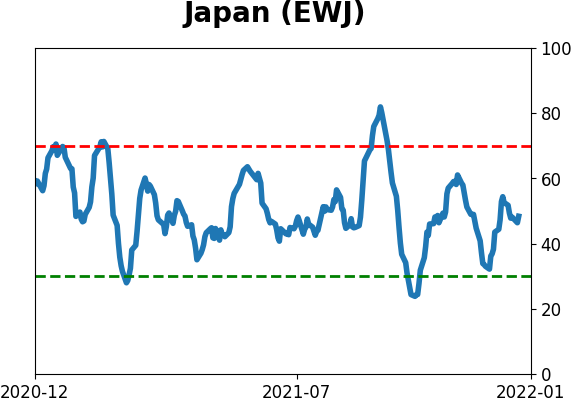
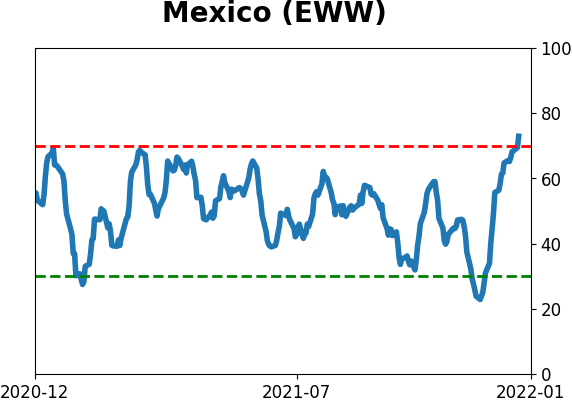
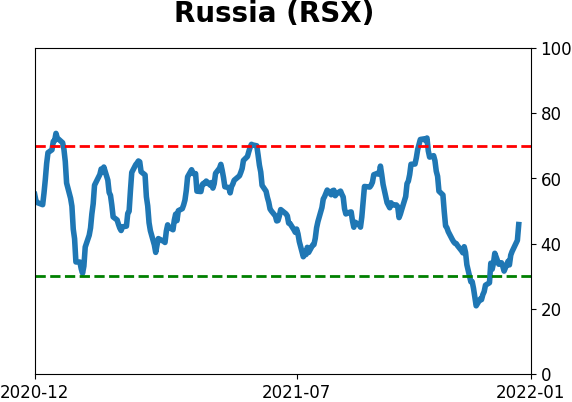
Country ETF's - 10-Day Moving Average
|
|
|
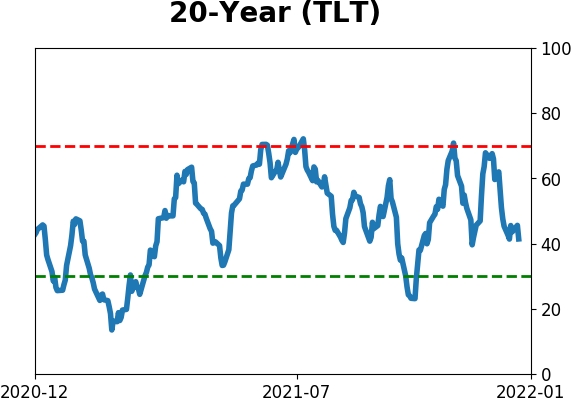
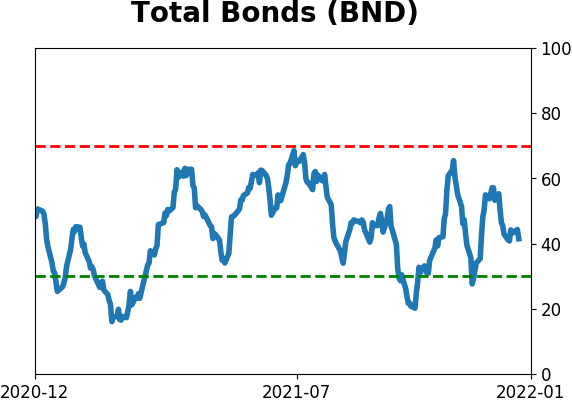
Bond ETF's - 10-Day Moving Average
|
|
|
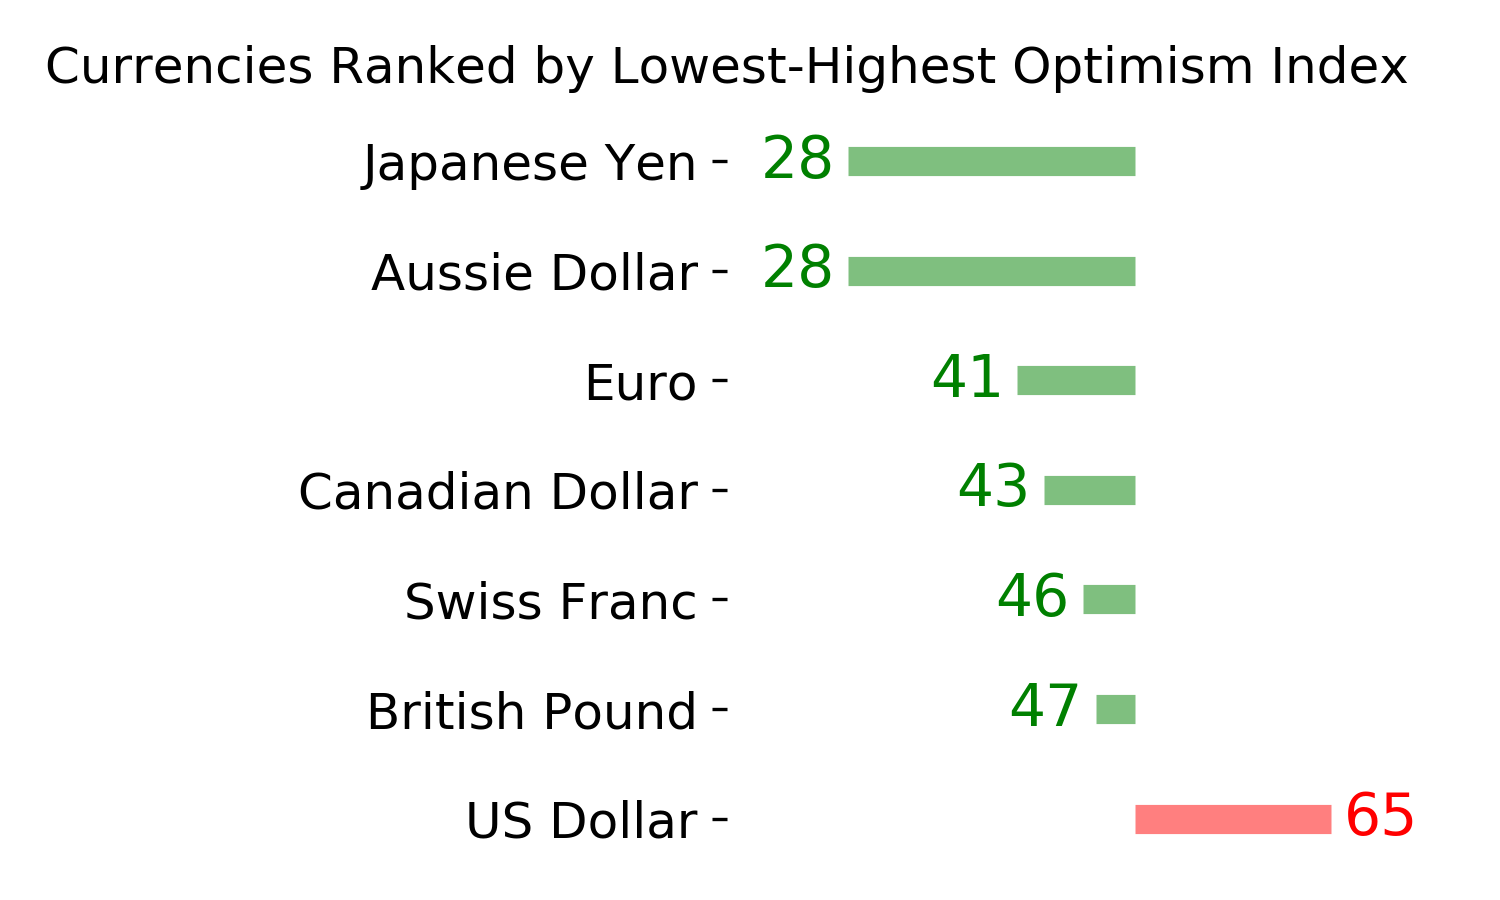
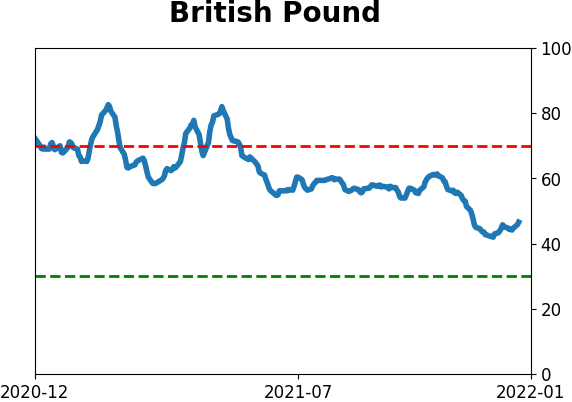
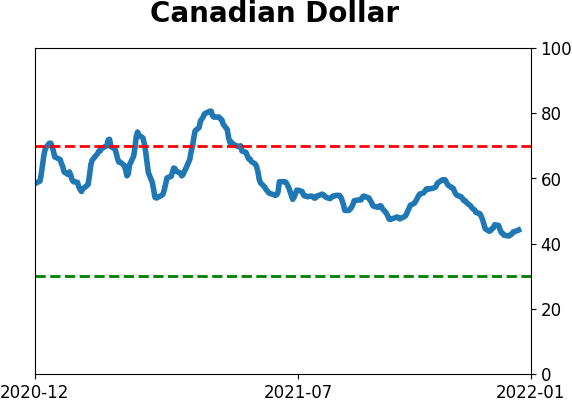
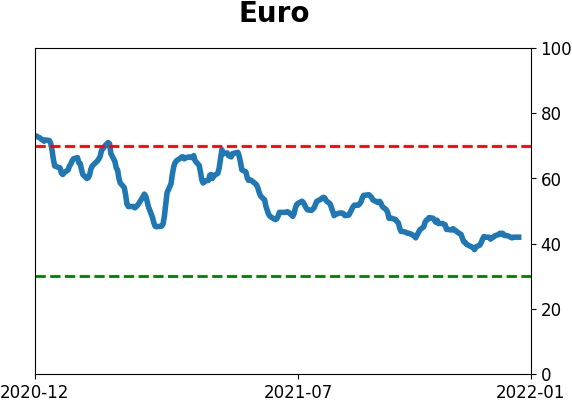
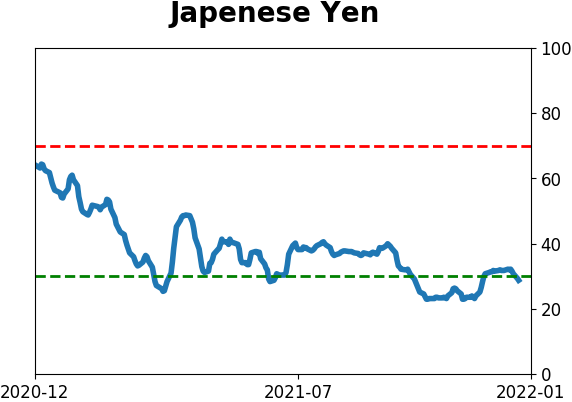
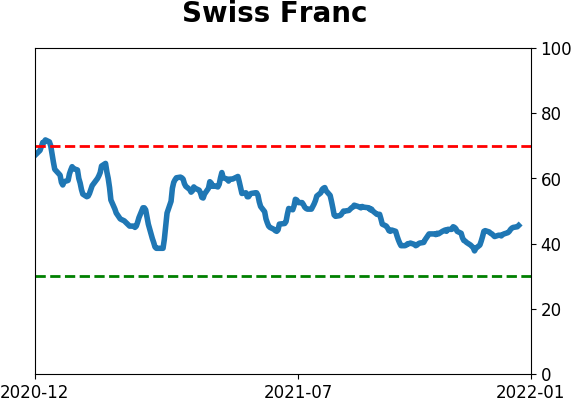
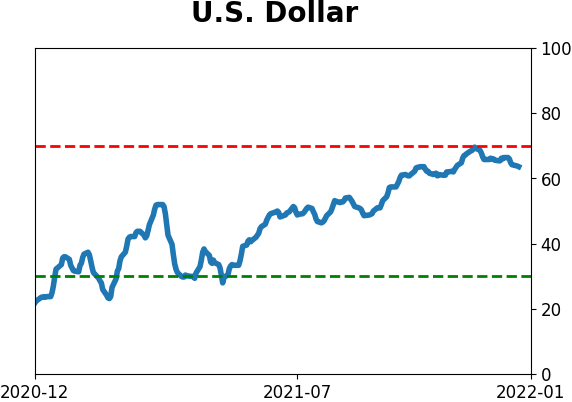
Currency ETF's - 5-Day Moving Average
|
|
|
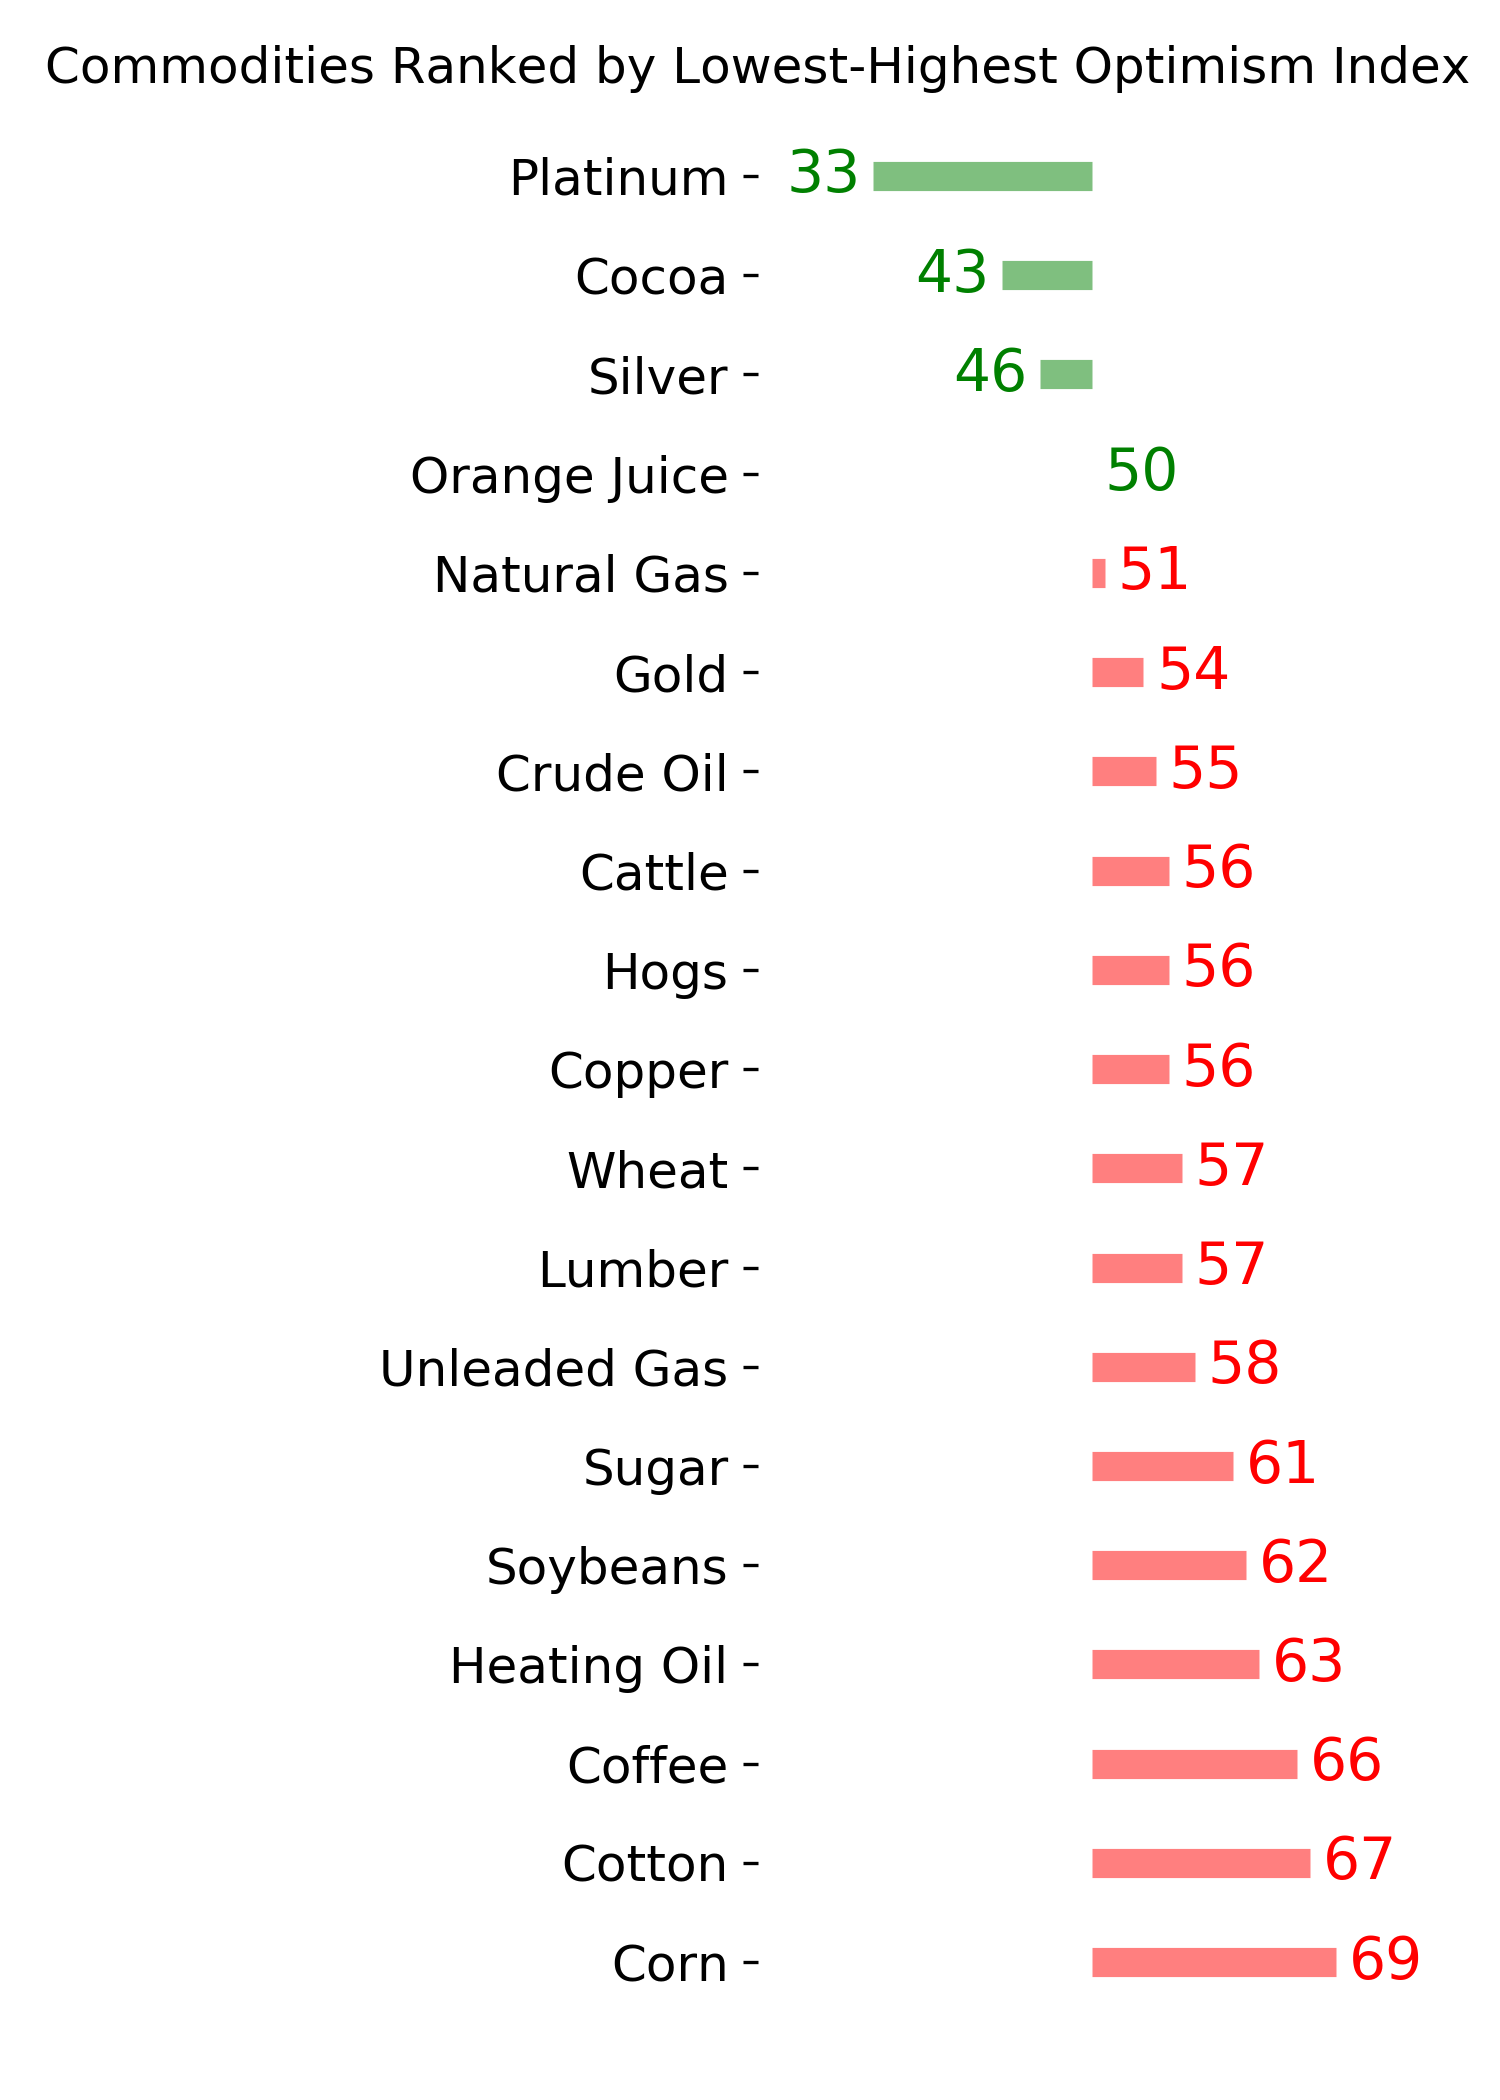
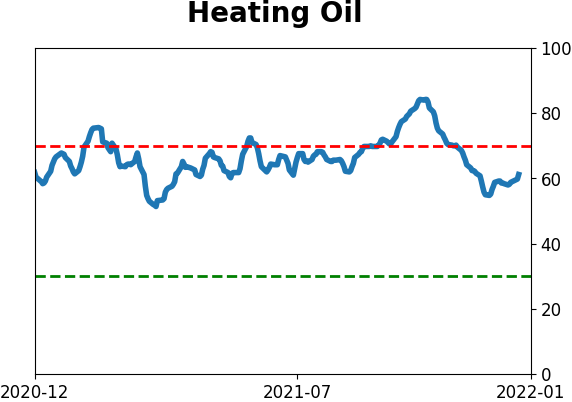
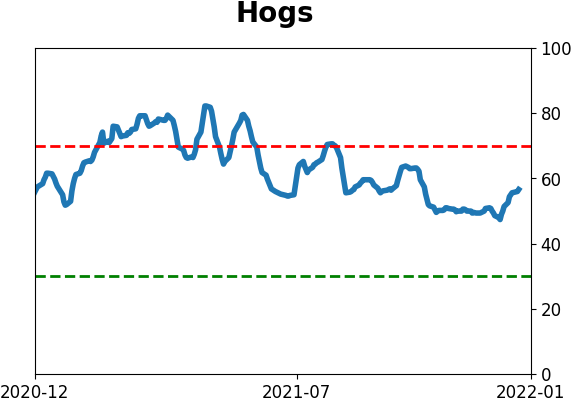
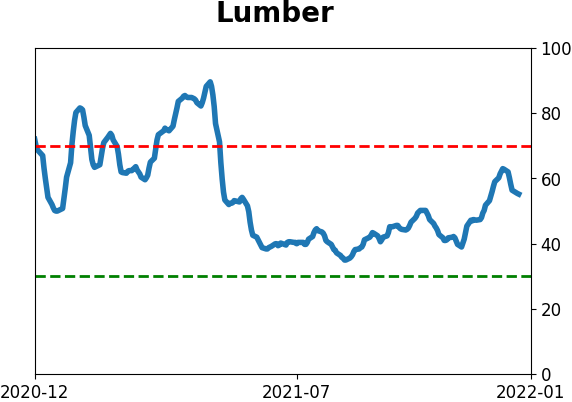
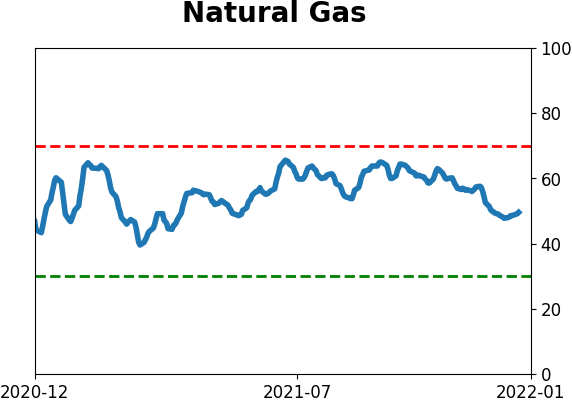
Commodity ETF's - 5-Day Moving Average
|
|