Headlines
|
|
Margin debt, and other leverage, hits record high:
The rise in stocks has given confidence among investors to add leverage. In November, margin debt, borrowed against stock holdings, rose to a record high. It's troubling that the rate of growth in debt has spiked so much, even relative to the growth in stocks.
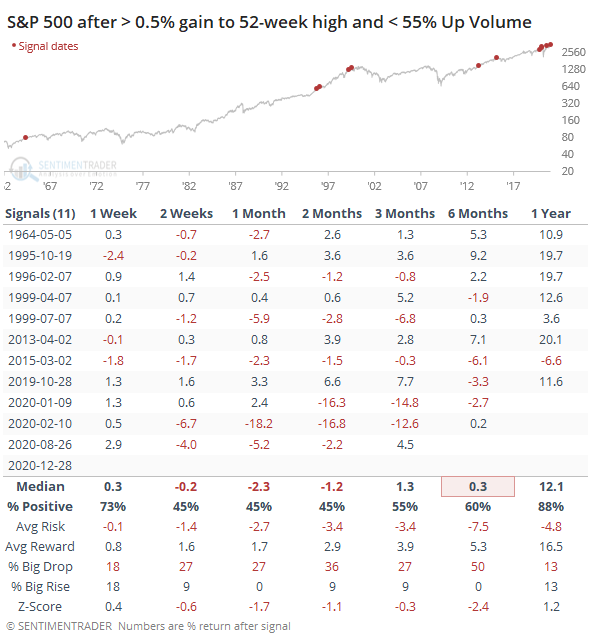
Another odd day: For most of the past 4 months, breadth has been excellent, with broad participation, almost everything in gear, punctuated by impressive thrusts. Only recently, like the past couple of weeks, we've seen more oddities pile up. Mostly that's due to small-cap stocks, with some days seeing weakness while other parts of the market show strength. Monday was one of those days. The S&P 500 rose more than 0.5% to close at a new high, yet the NYSE Up Volume Ratio was below 50% (more volume flowing into declining than advancing securities). That's happened only 4 other times since 1962 (1995-10-19, 1999-07-07, 2013-04-02, and 2020-08-26), all leading to some weakness over the next 1-2 weeks. If we relax that to 55% or less Up Volume, we still mostly saw weakness over the next 2-8 weeks.
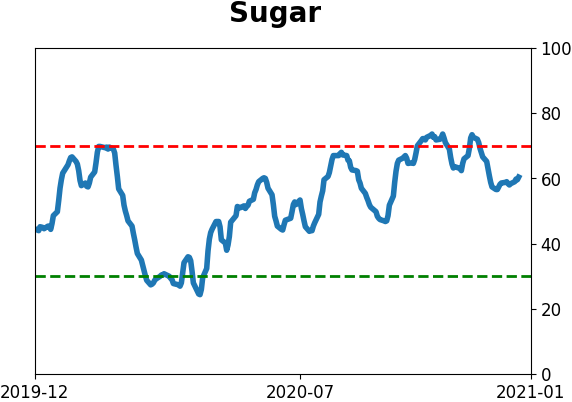
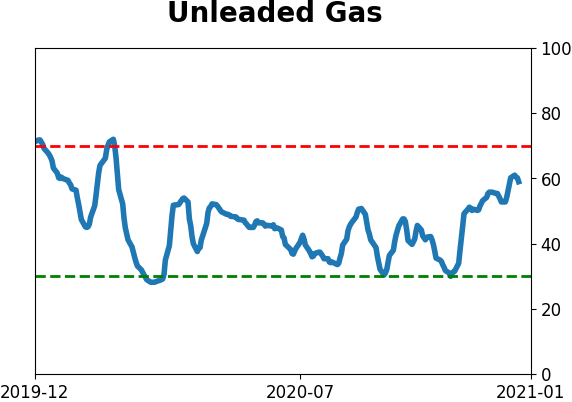
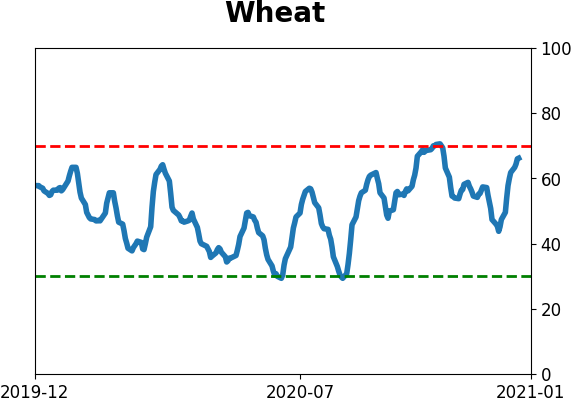
The latest Commitments of Traders report was released, covering positions through Tuesday: Due to the Christmas holiday, there was a delay in the release of last week's Commitments of Traders data. The 3-Year Min/Max Screen shows that "smart money" commercial hedgers established a new extreme short position in the broader commodity complex, coupled with decade-high long exposure to the U.S. dollar. The latter hasn't been a very effective indicator, as we've discussed multiple times over the past several months. The former position, a large short against commodities, has been more effective. Every time hedgers held more than 100,000 contracts net short, the CRB index declined in the months ahead. Recent months have been an exception, increasing the probability that a structural shift has occurred and commodities are in a new bull phase. In stocks, hedgers reduced their positions and are holding about $15 billion net short, about in the middle of their recent range.
Bottom Line:
- The market environment is pristine, but with near-historic optimism, gains tend to be muted, with a high probability of being reversed at some point over the ensuing weeks.
|
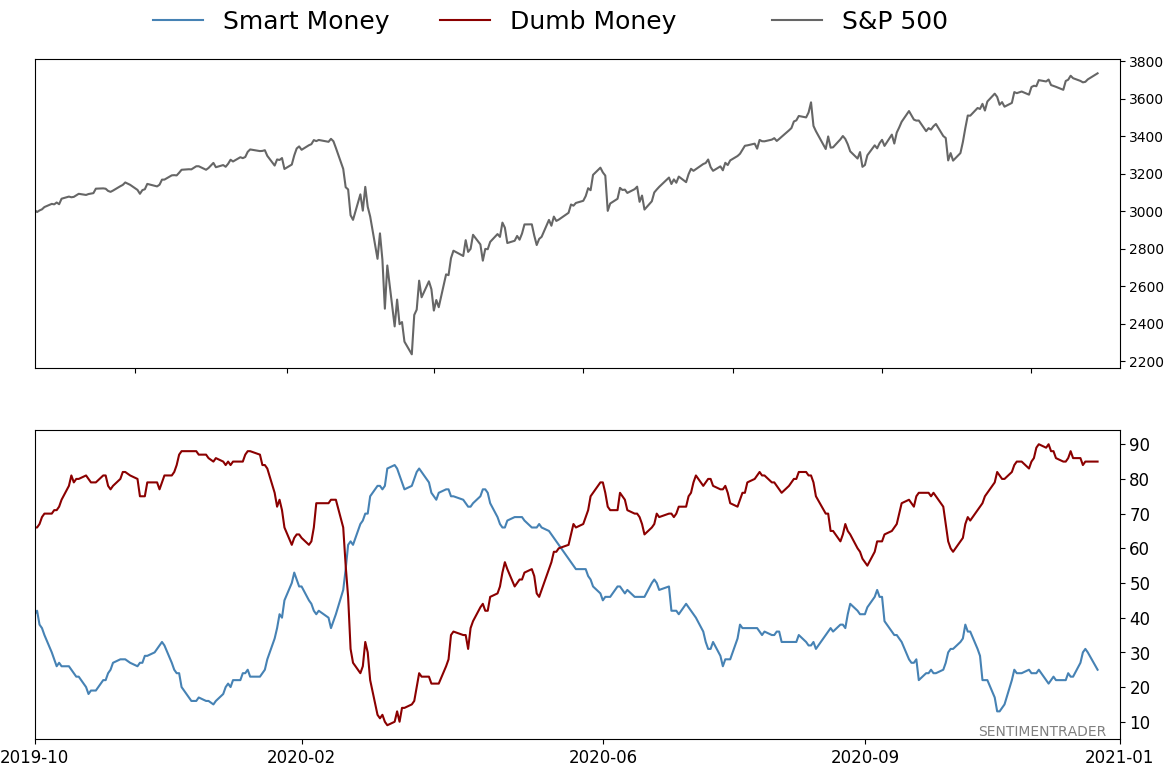
Smart / Dumb Money Confidence
|
Smart Money Confidence: 25%
Dumb Money Confidence: 85%
|
|
Risk Levels
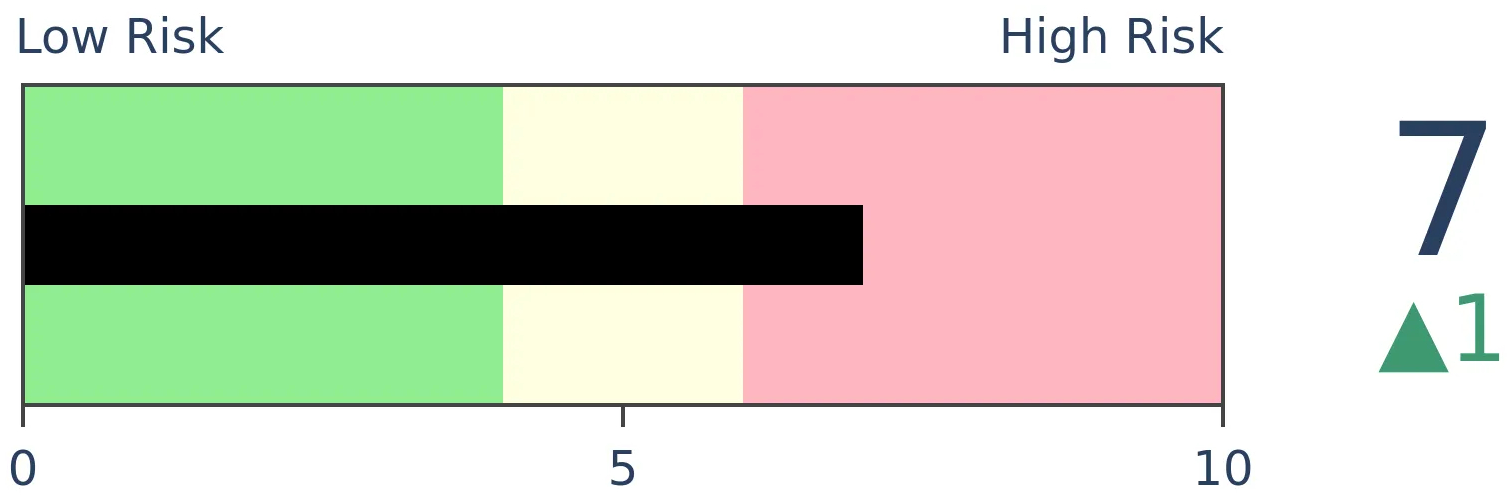
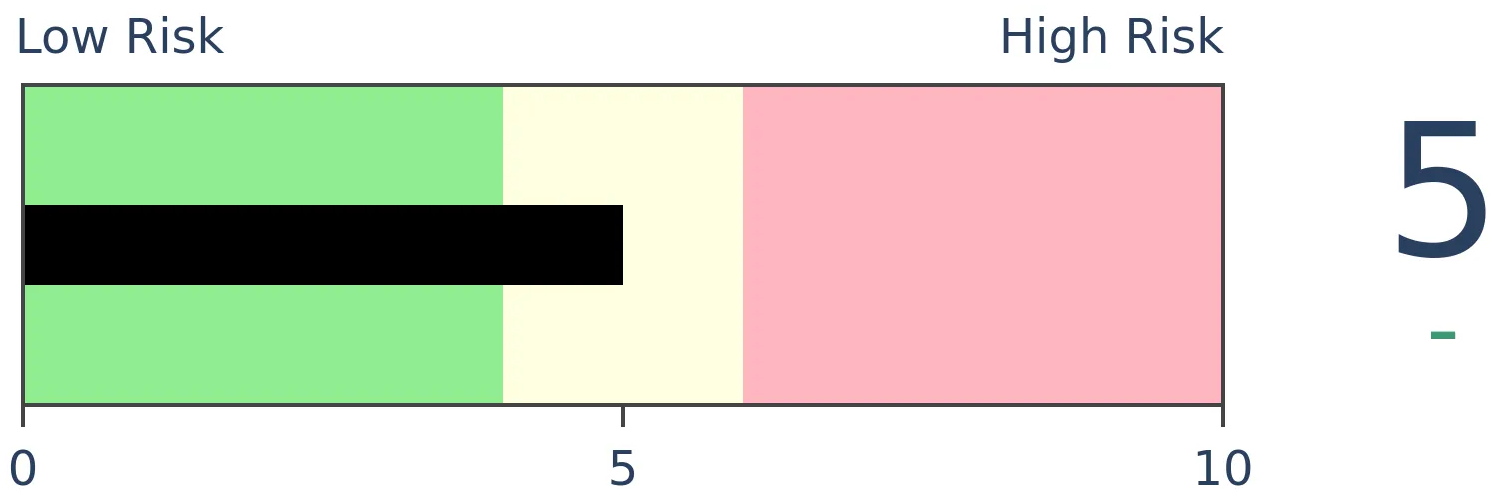
Stocks Short-Term
|
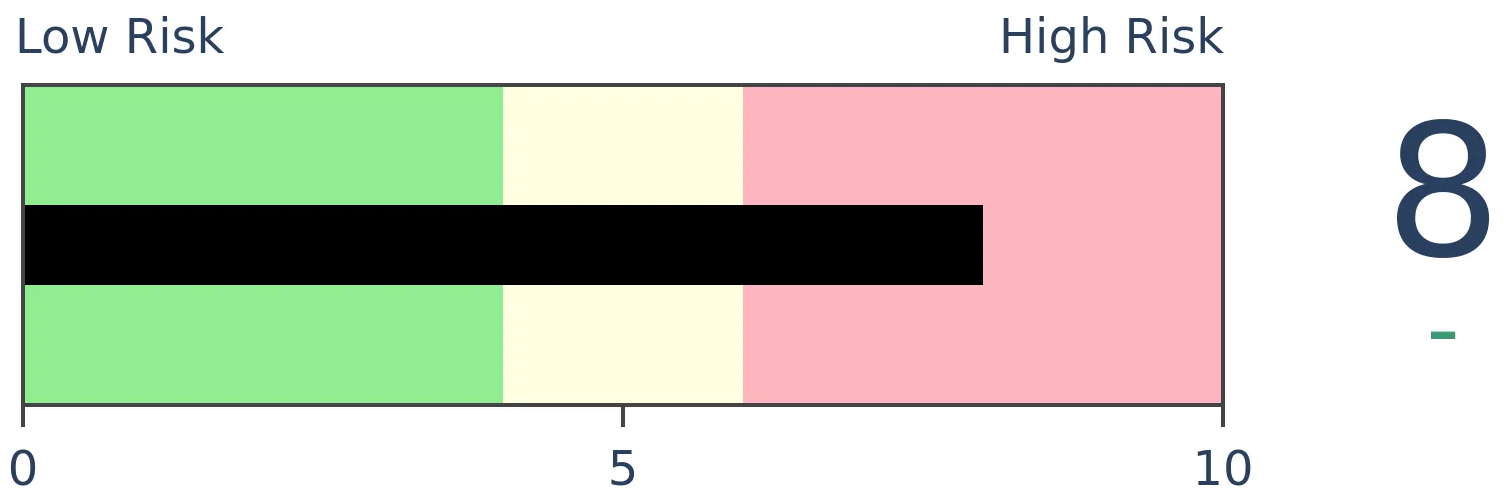
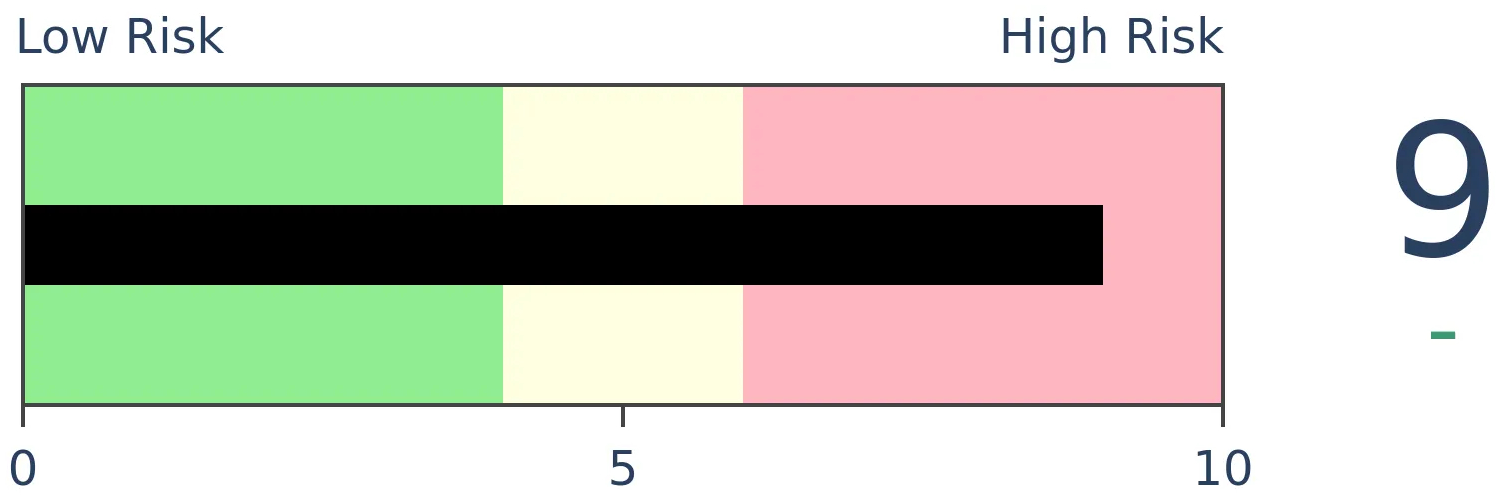
Stocks Medium-Term
|
|
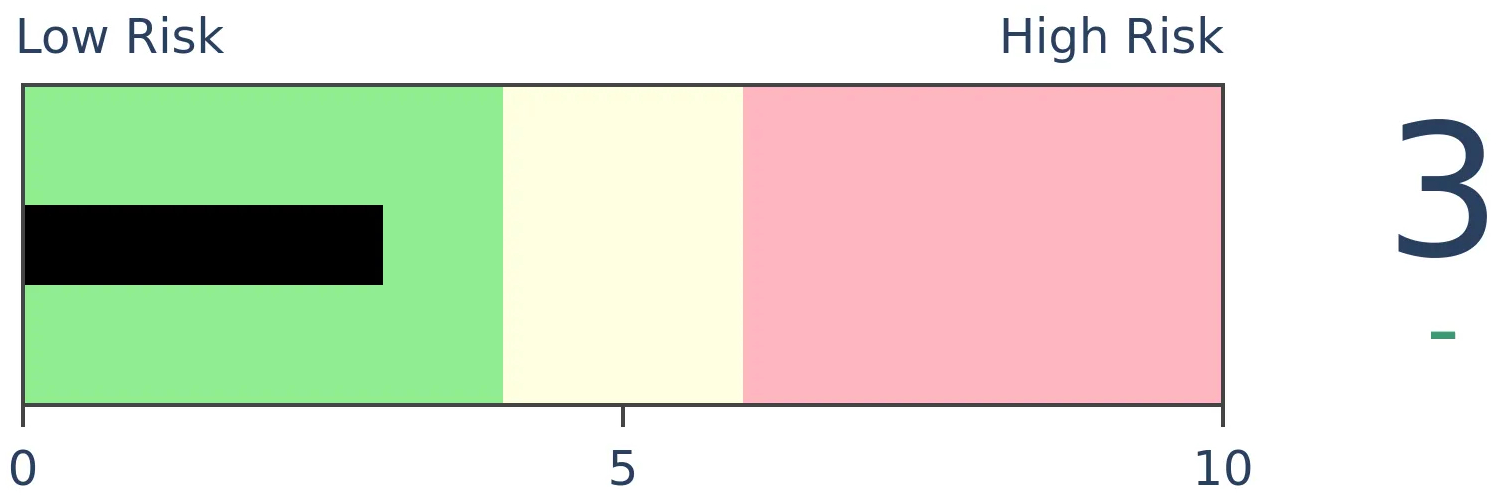
Bonds
|
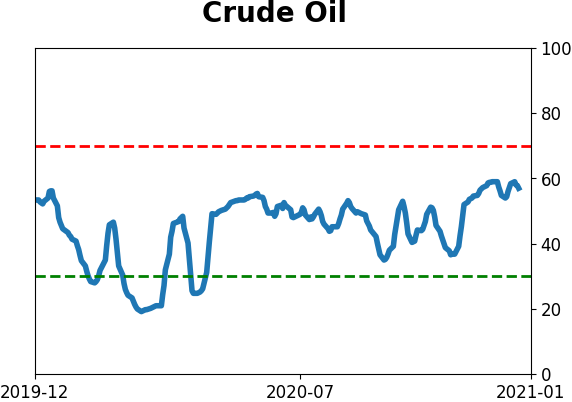
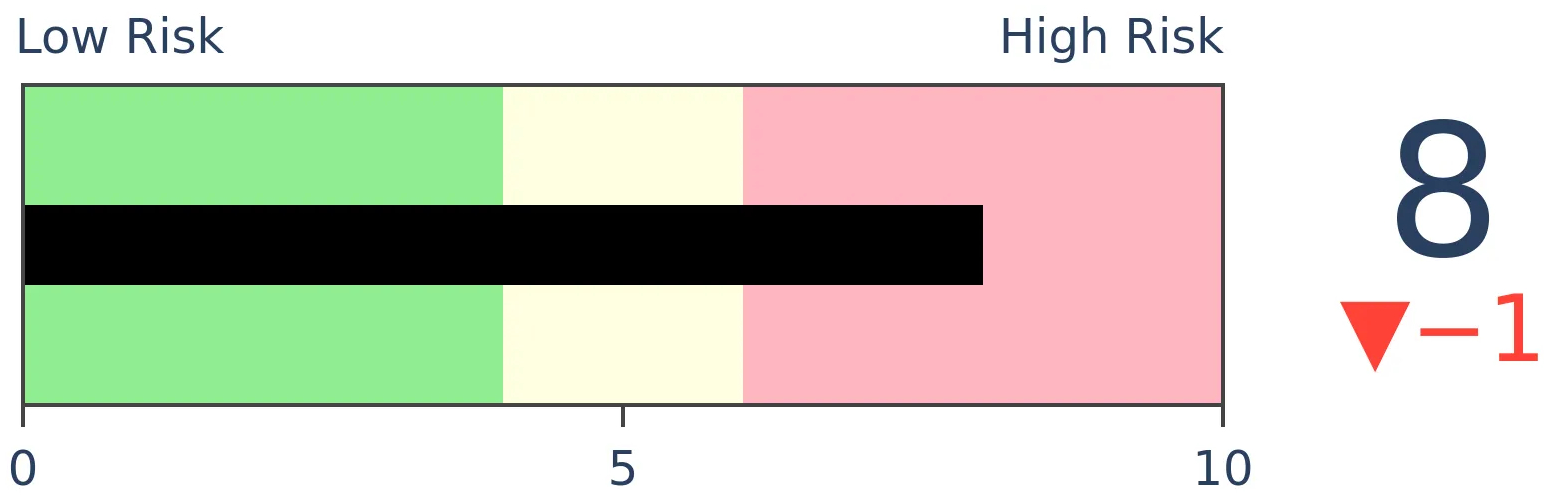
Crude Oil
|
|
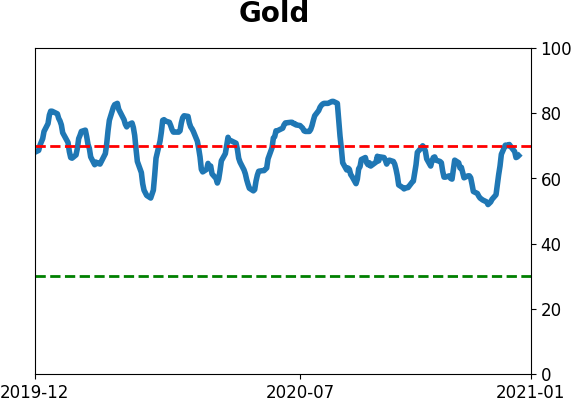
Gold
|
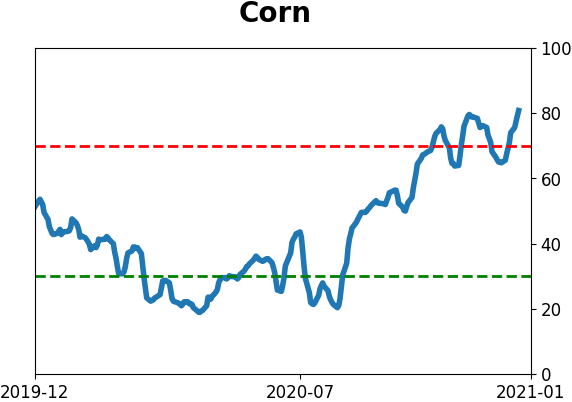
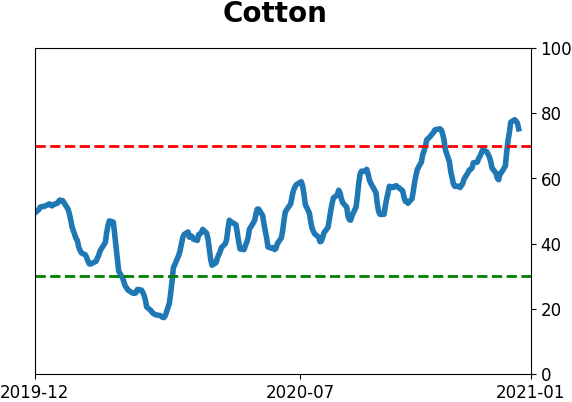
Agriculture
|
|
Research
BOTTOM LINE
The rise in stocks has given confidence among investors to add leverage. In November, margin debt, borrowed against stock holdings, rose to a record high. It's troubling that the rate of growth in debt has spiked so much, even relative to the growth in stocks.
FORECAST / TIMEFRAME
SPY -- Down, Long-Term
|
At various points over the past several years, the topic of margin debt has come up as a sign of investor excess. Every time we've looked at it, though, it hasn't suggested a reason for concern. Debt as a percentage of stock market capitalization has remained low, and more importantly, the rate of growth of that debt had been about in line with that of stocks.
With the latest release of the margin debt figures, there are some anecdotal concerns. As the Wall Street Journal points out, the gains in stocks, and highflyers like Tesla, in particular, have emboldened a new generation of investors testing the limits of what leverage can do (emphasis added).
She says she doesn’t think she will see another year of gains quite like 2020 soon. But she has no plans to sell any of her Tesla stock either and is open to the idea of borrowing more against her portfolio.
“This is what wealthy people do,” Ms. Roberts said.
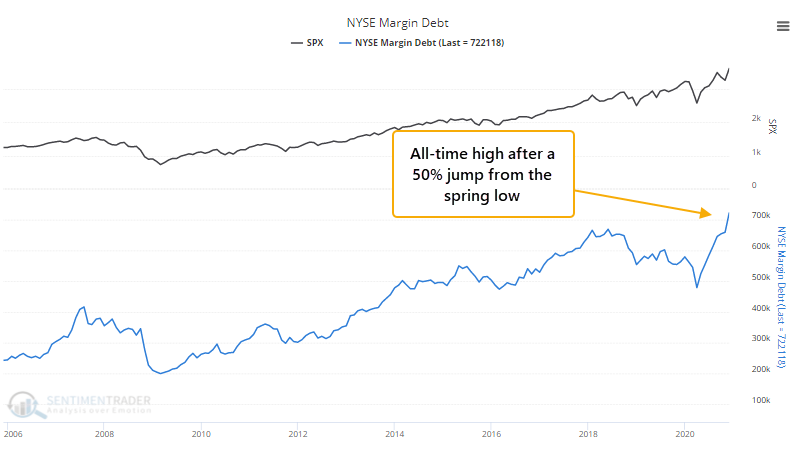
Bears will likely start to grumble about this once again because debt jumped again in November to a record high. Investors have over $722 billion in loans borrowed against the value of their stock holdings.
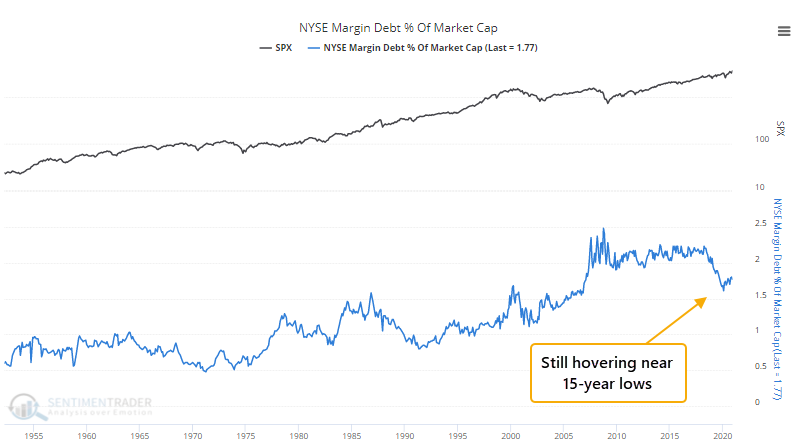
Like it has been in recent years, though, debt is still very low relative to the value of the overall stock market. When we've looked at it this way in the past, it hasn't been an effective measure, especially at peaks and it has become even less useful over the past 15 years or so.
Even though margin debt is relatively low as a percentage of market capitalization, its growth has been picking up and is outpacing the growth in stocks. We've looked at this many times in the past, and seen that a high growth rate in debt relative to the growth in stocks was an ominous signal in 2000 and 2007, but it has been tame since then.
Now, it's starting to percolate. Over the past year, margin debt has grown nearly 13% faster than has the S&P 500, the widest spread in 7 years.
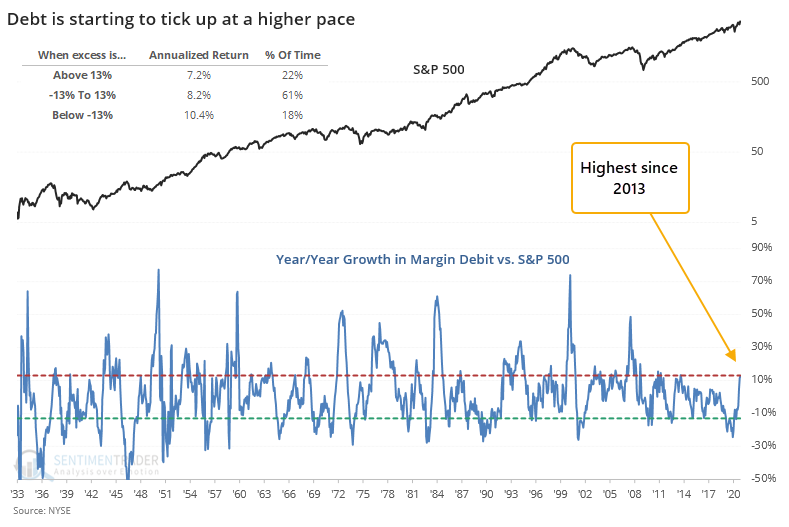
This hasn't been too much of a warning sign, though. When the growth in debt was more than 13% higher than the growth in the S&P, the S&P returned an annualized +7.2%, slightly below average. The biggest yellow flags have flown when the rate of change in debt exceeded the S&P's by 30% or more, and it would take a huge jump in margin balances to accomplish that any time soon.
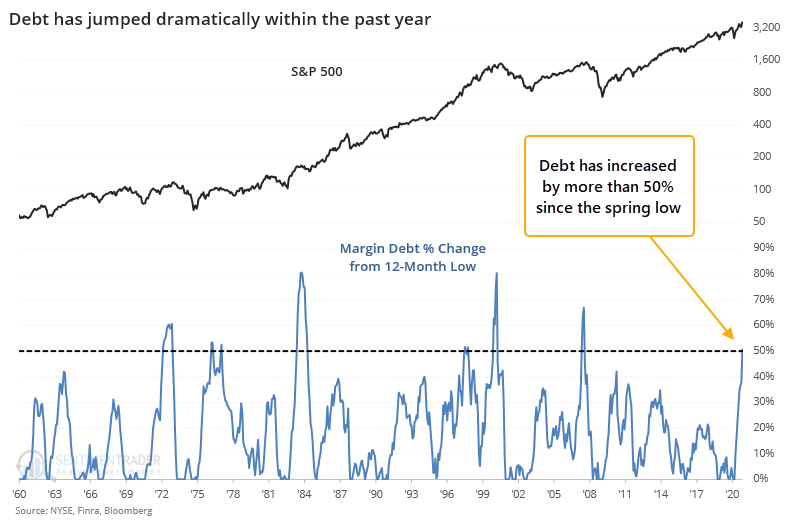
It's more disturbing just how quickly that investors have been willing to add this kind of leverage to their investments. Thanks to the massive rebound in stocks, investors have gained enough confidence to add debt at more than an equal pace, and margin balances are now more than 50% higher than they were within the past year. That's one of the largest and quickest rebounds in debt in 60 years. The figures were extremely volatile prior to 1960ish so we cut it off then.
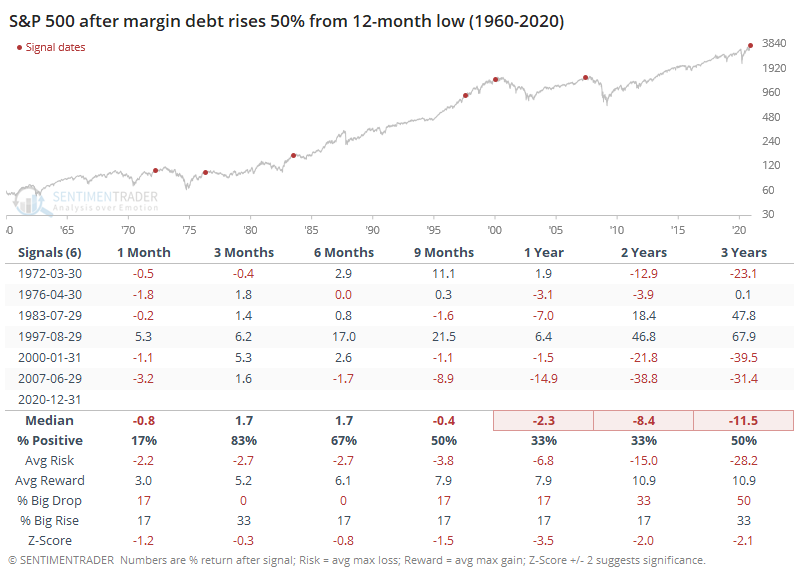
Other times when margin debt jumped by more than 50% from its low within a year, forward returns in the S&P were subpar.
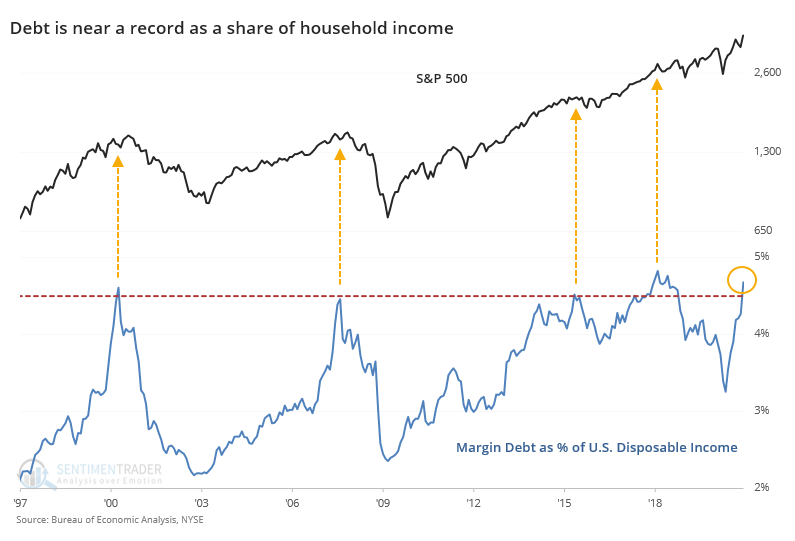
As a share of household income, margin debt is nearing a record high, as noted by Hedgopia. This is a rough way at looking at whether households have the capacity to service their debt, though it doesn't take into account the collateral they have securing it (their investment portfolios).
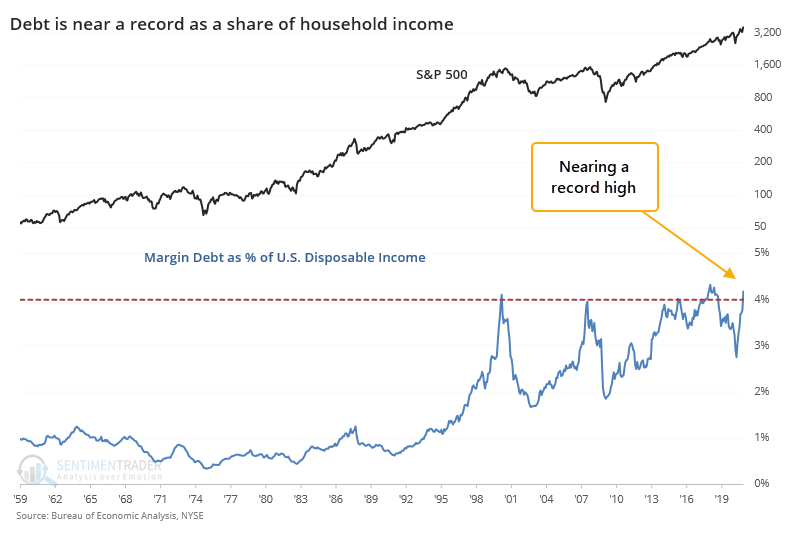
Zooming in on the past 20 or so years, we can see how it lines up against stocks, which is not encouraging.
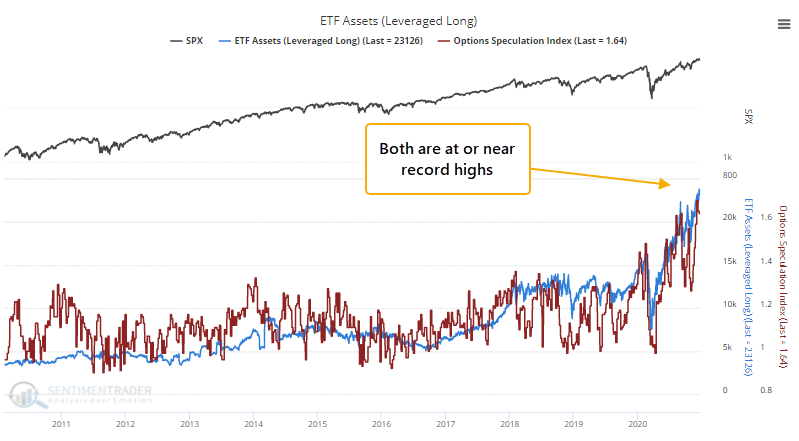
The kind of confidence mentioned by the Journal is enough to make any contrarian shudder because it's the exact type of sentiment that's regularly expressed right before a punishment. There is an increased - even record - comfort among investors in using leveraged instruments. Margin debt is one reflection of that. So are the uses of leveraged ETFs and speculative options strategies.
Over the past 5 years, all the "sell now!" statements from those bearish on the market, using margin debt as an excuse, haven't had much empirical support. Debt levels just weren't that high relative to stocks' value (and still aren't) and the rate of growth was tame. That latter point is starting to shift, and there is more of an argument now that it's starting to become a warning sign. A minor one, still, but a warning nonetheless.
Active Studies
| Time Frame | Bullish | Bearish | | Short-Term | 0 | 0 | | Medium-Term | 2 | 1 | | Long-Term | 14 | 2 |
|
Indicators at Extremes
Portfolio
| Position | Description | Weight % | Added / Reduced | Date | | Stocks | 10.4% VWO, 9.1% XLE, 8.5% RSP, 6.6% PSCE | 34.5 | Reduced 6.7% | 2020-12-14 | | Bonds | 10% BND, 10% SCHP, 10% ANGL | 28.4 | Reduced 0.1% | 2020-10-02 | | Commodities | GCC | 2.4 | Reduced 2.1%
| 2020-09-04 | | Precious Metals | GDX | 8.9 | Added 4.8% | 2020-12-01 | | Special Situations | | 0.0 | Reduced 5% | 2020-10-02 | | Cash | | 25.8 | | |
|
Updates (Changes made today are underlined)
Quite a few of the studies that have been triggering for stocks have showed a poor risk/reward skew over a short- to medium-term time frame, even though many of them have also been quite positive over medium- to long-term time frames. We're in a very favorable seasonal window, so it would be somewhat odd to see a substantial pullback in the next few weeks. Leave it to 2020 to do just that, I suppose, but the calendar is a point in bulls' favor. Even so, record-high-and-declining sentiment, coupled with early signs of a reversal were enough that I reduced my S&P 500 position a bit. I fully expect that the energy funds will suffer some losses in the coming weeks, but as I noted when buying them, they're intended as long-term positions and almost by definition they're going to be volatile. RETURN YTD: 7.3% 2019: 12.6%, 2018: 0.6%, 2017: 3.8%, 2016: 17.1%, 2015: 9.2%, 2014: 14.5%, 2013: 2.2%, 2012: 10.8%, 2011: 16.5%, 2010: 15.3%, 2009: 23.9%, 2008: 16.2%, 2007: 7.8%
|
|
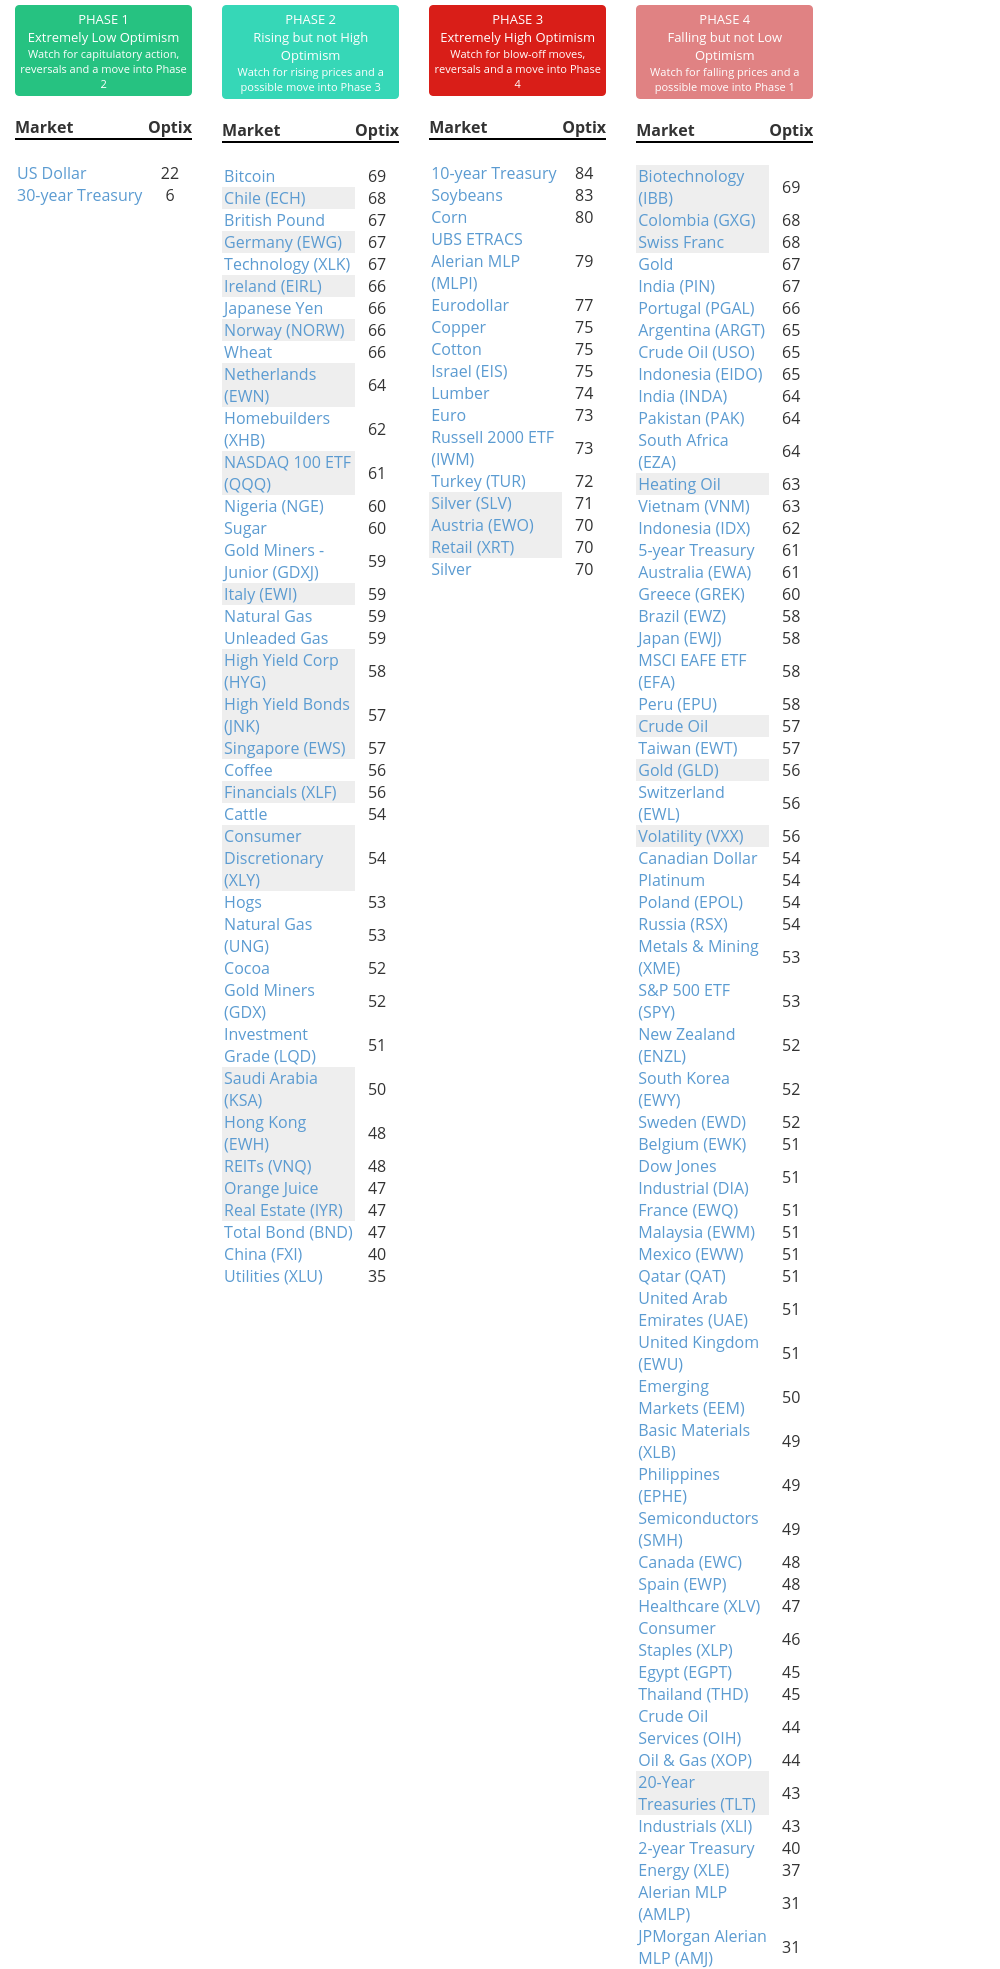
Phase Table
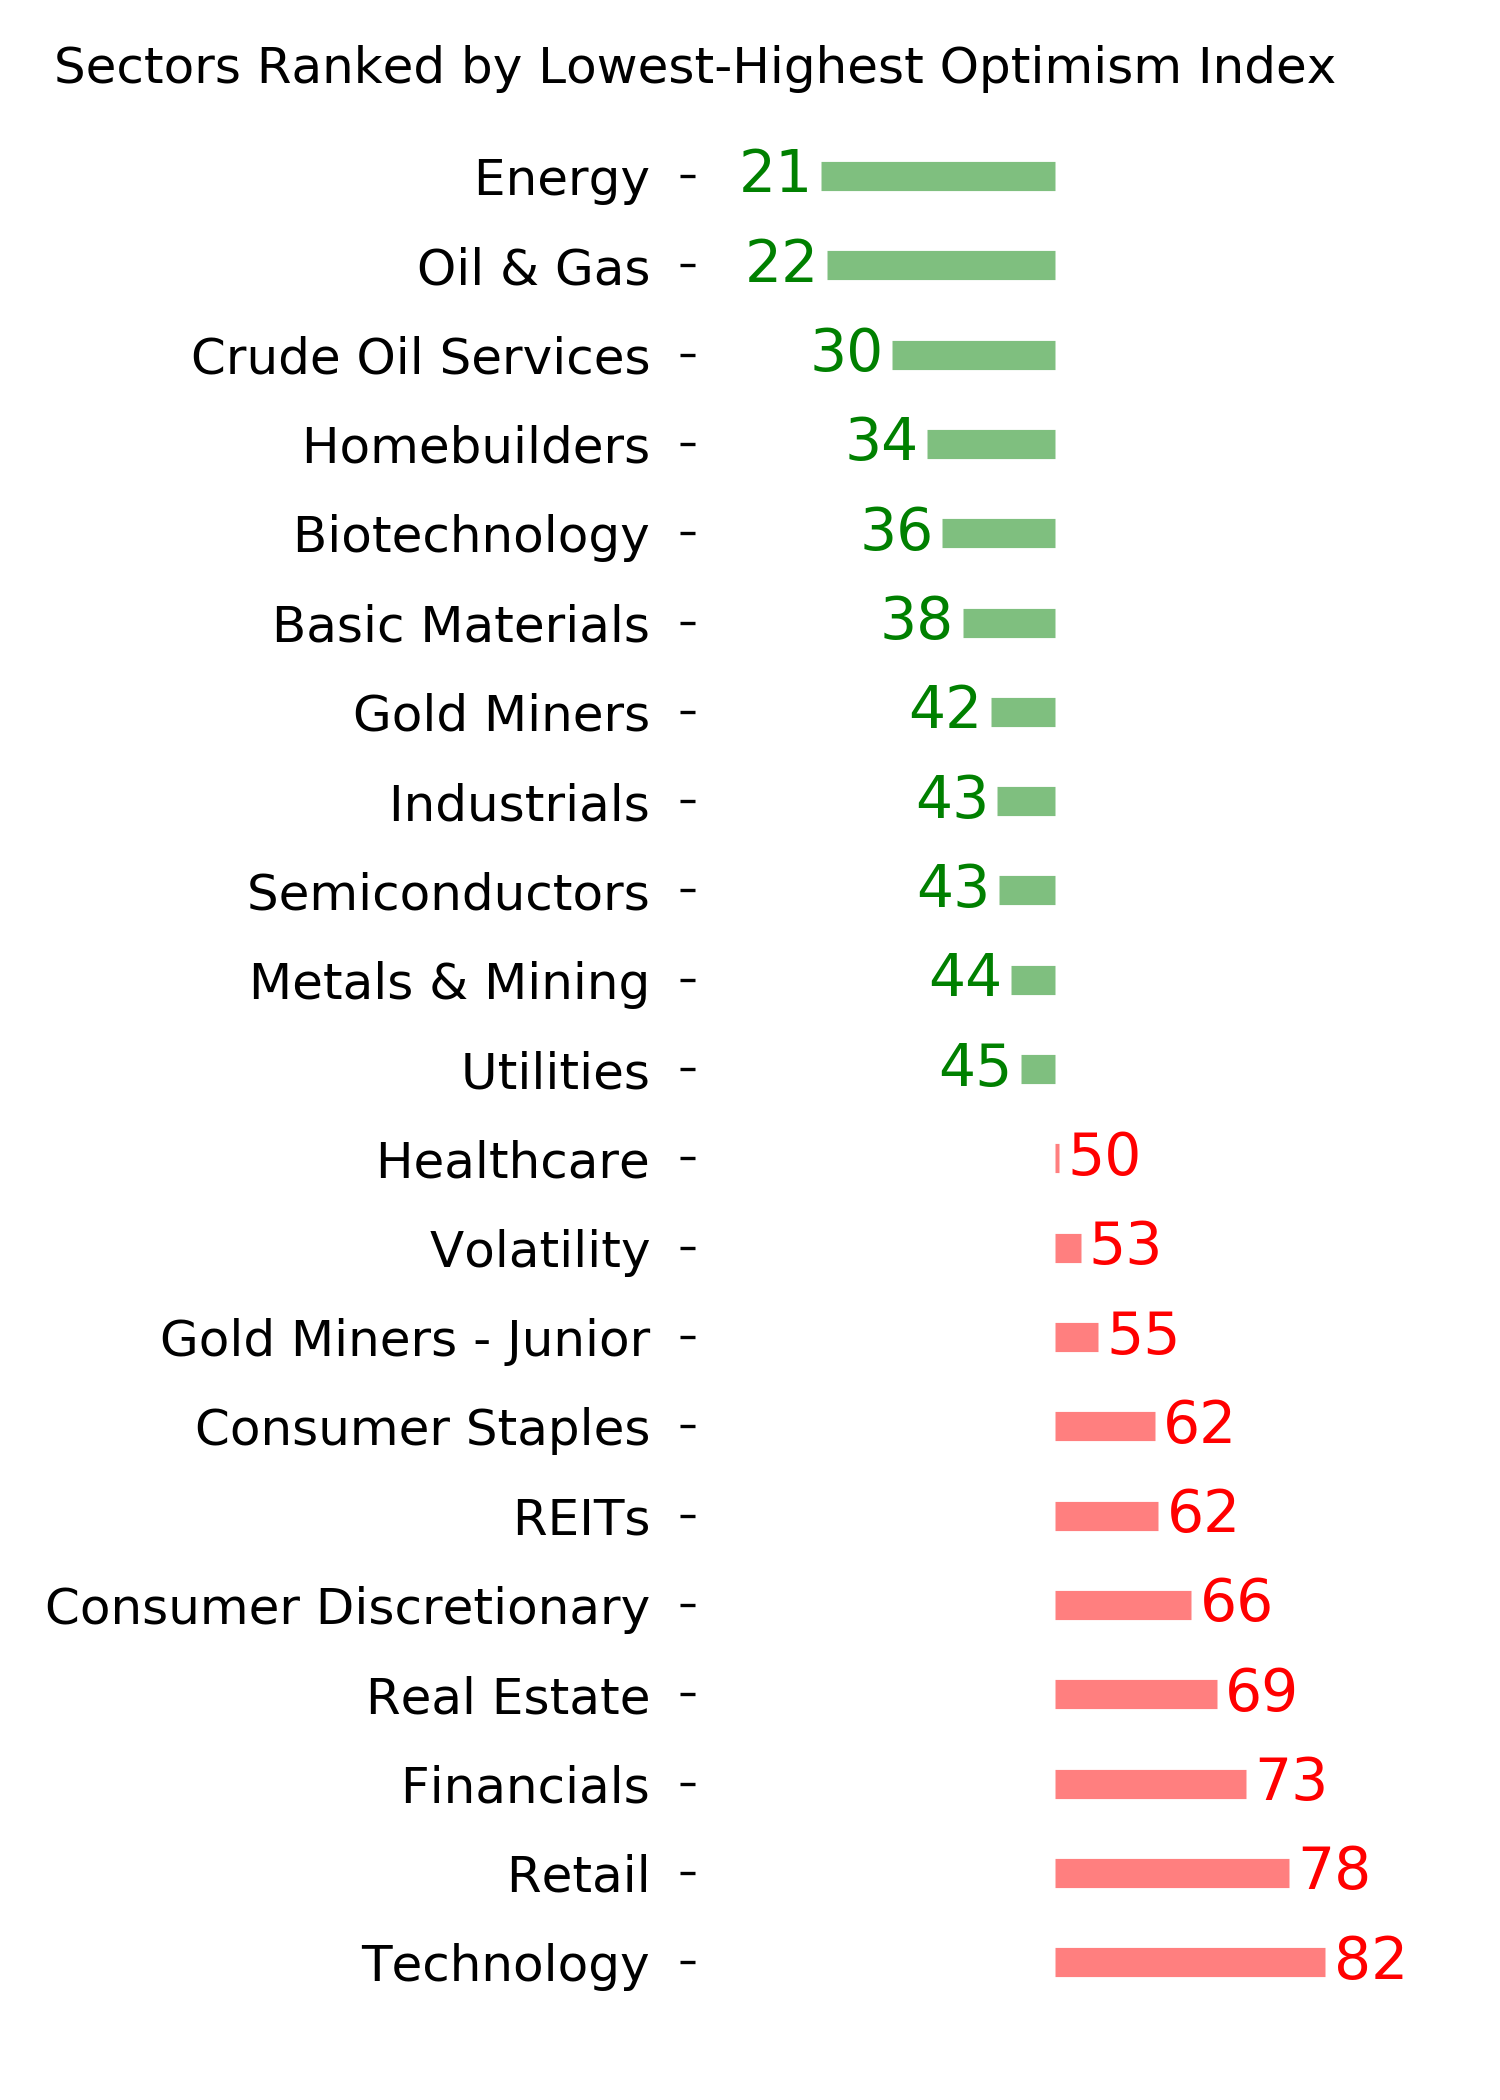
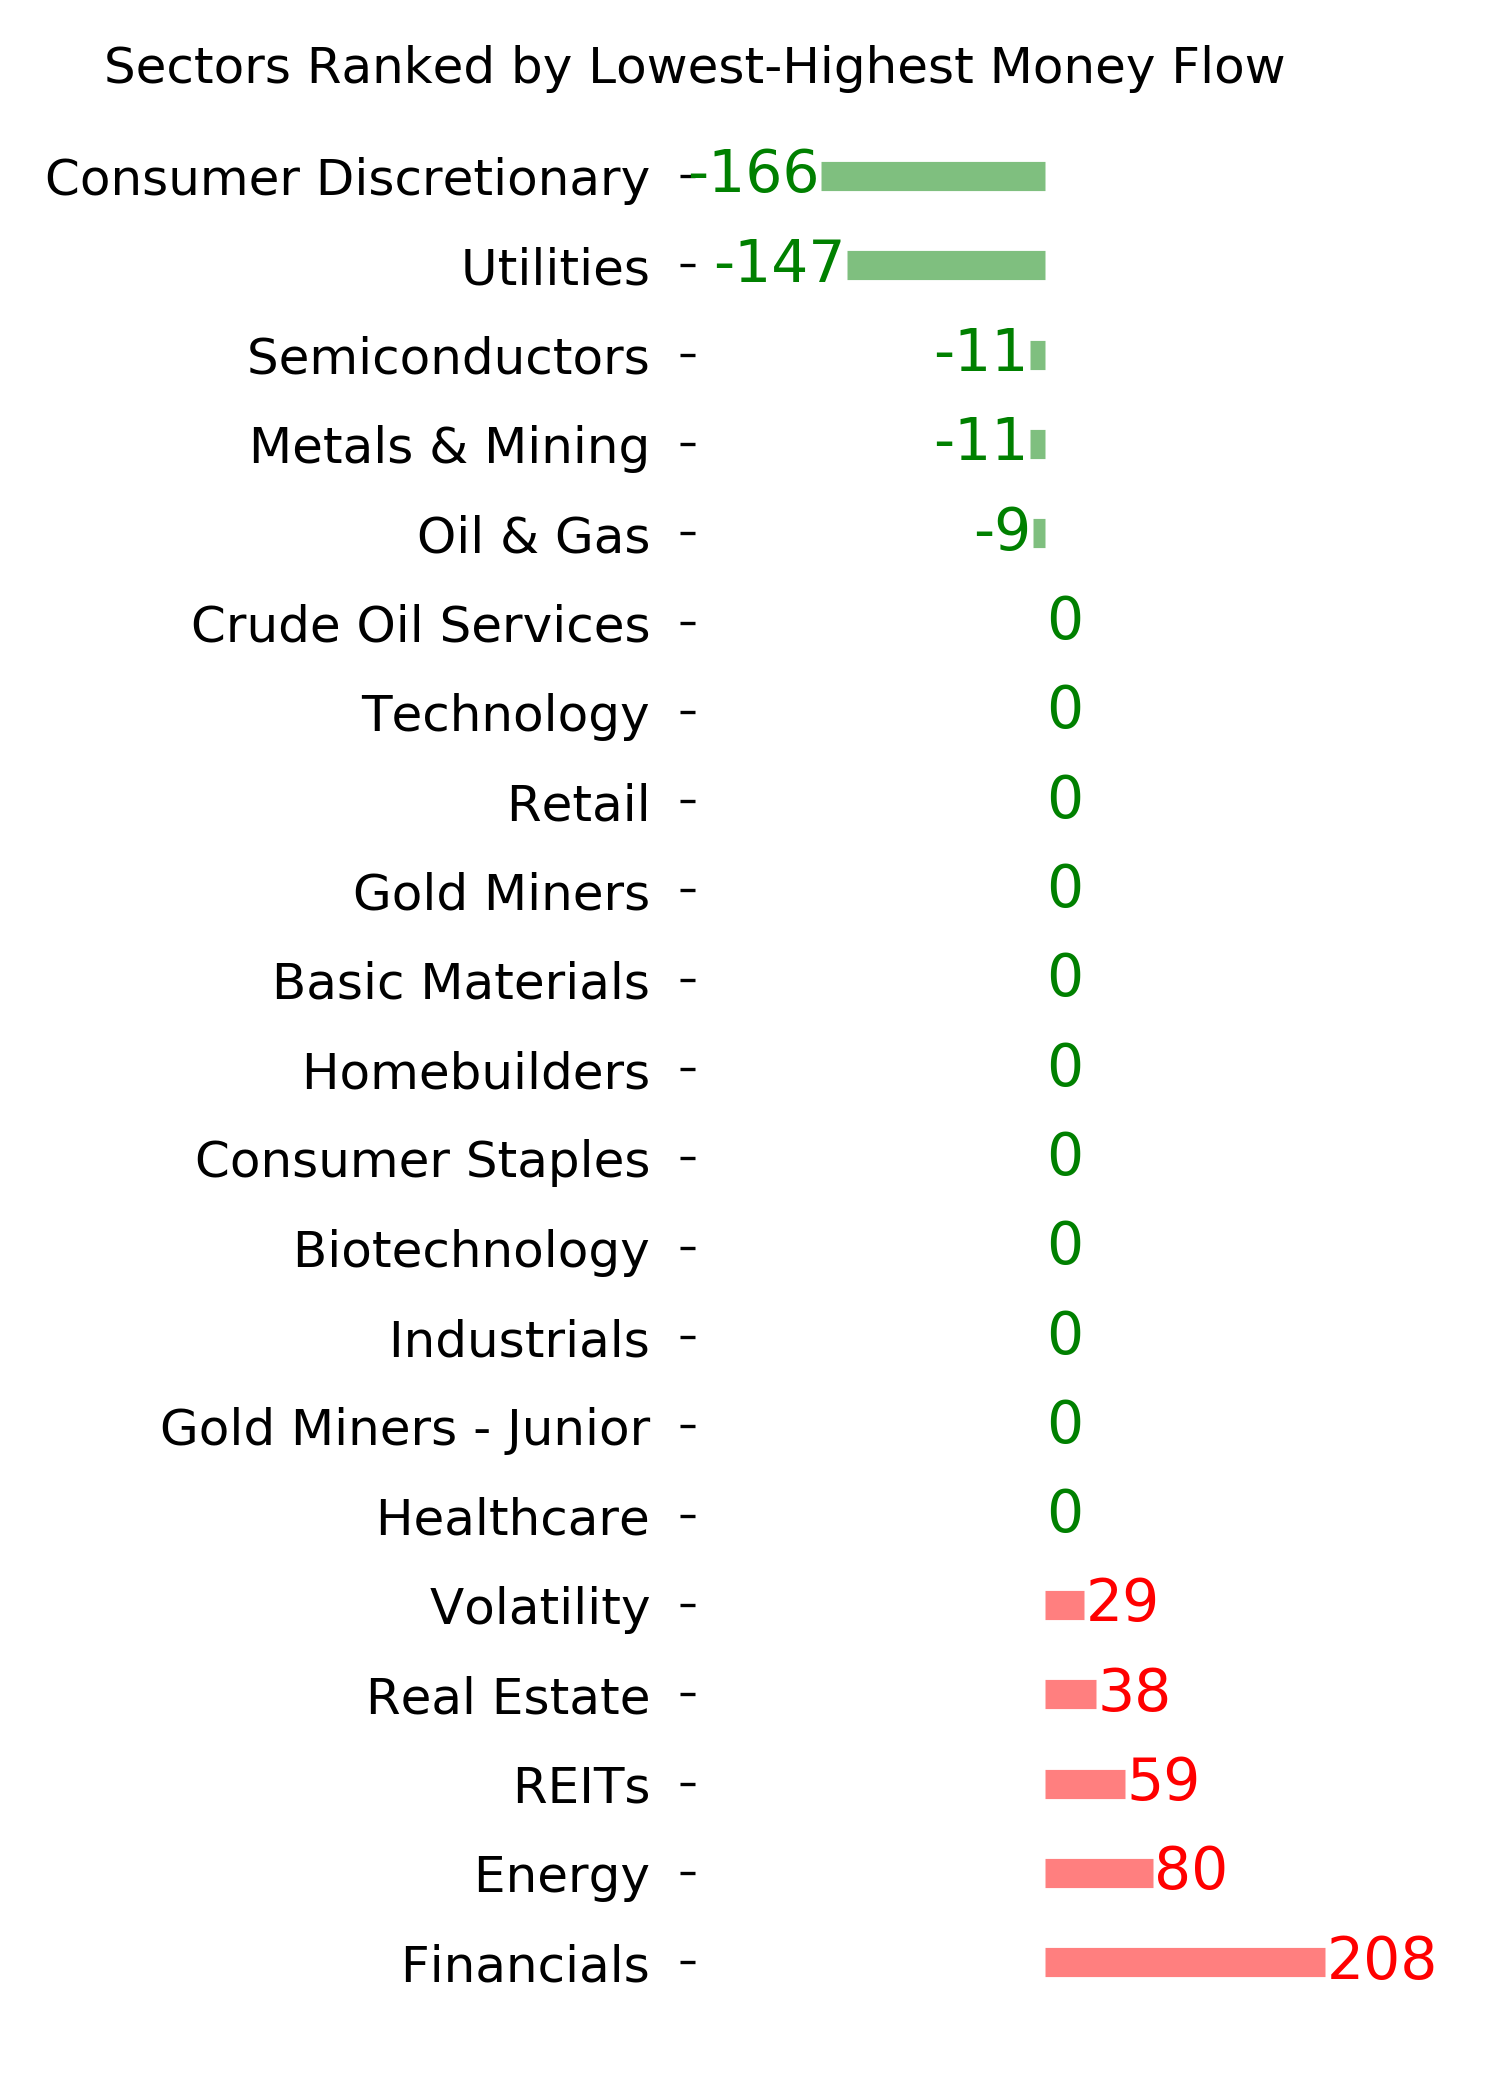
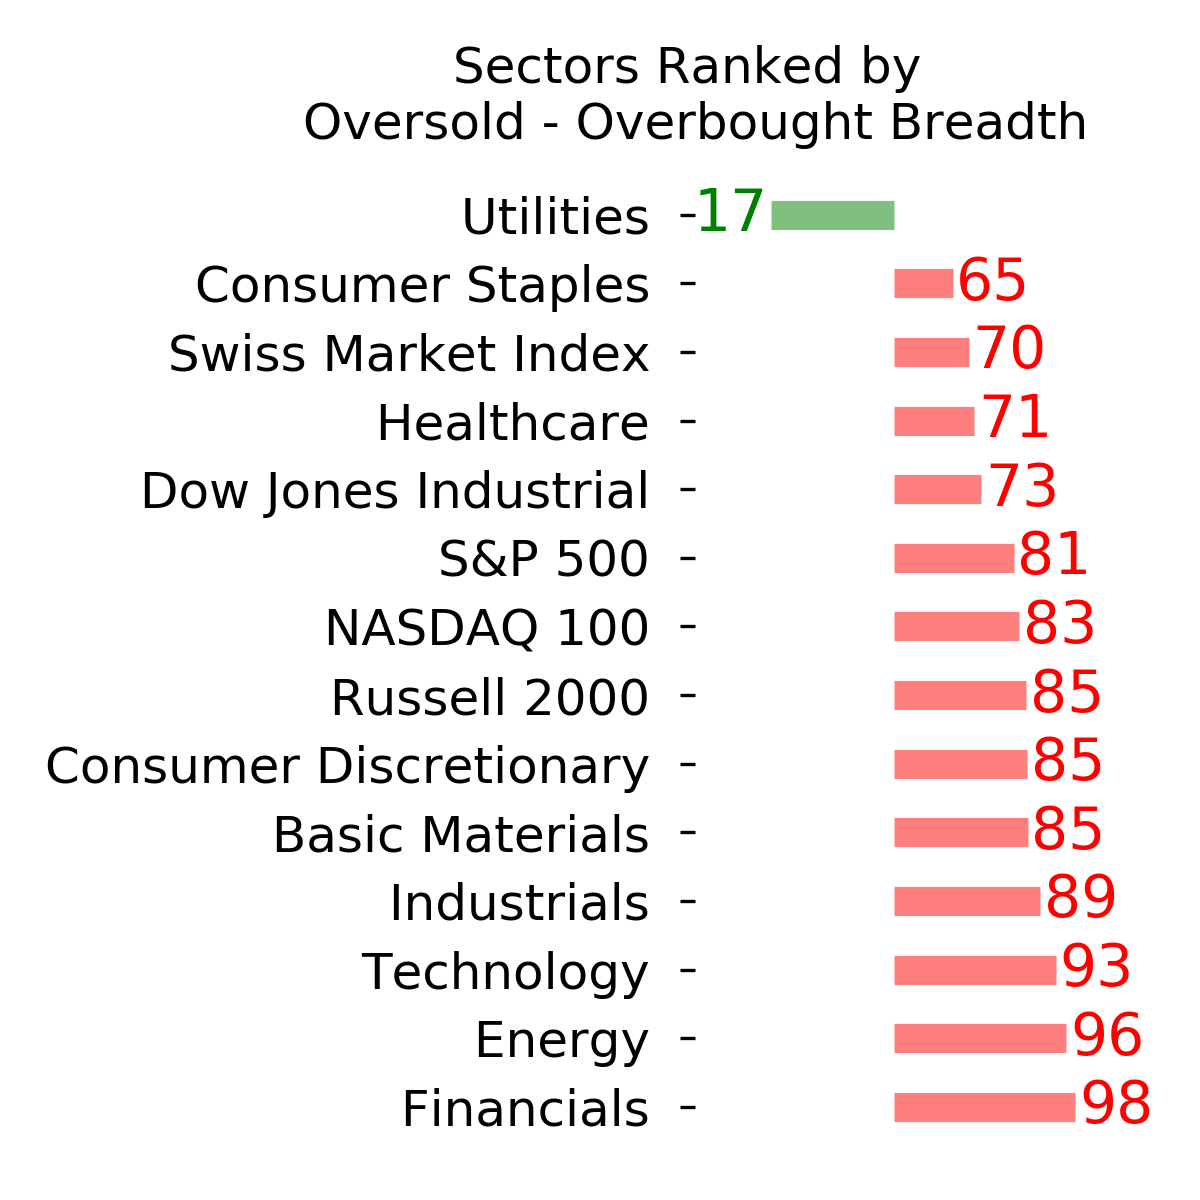
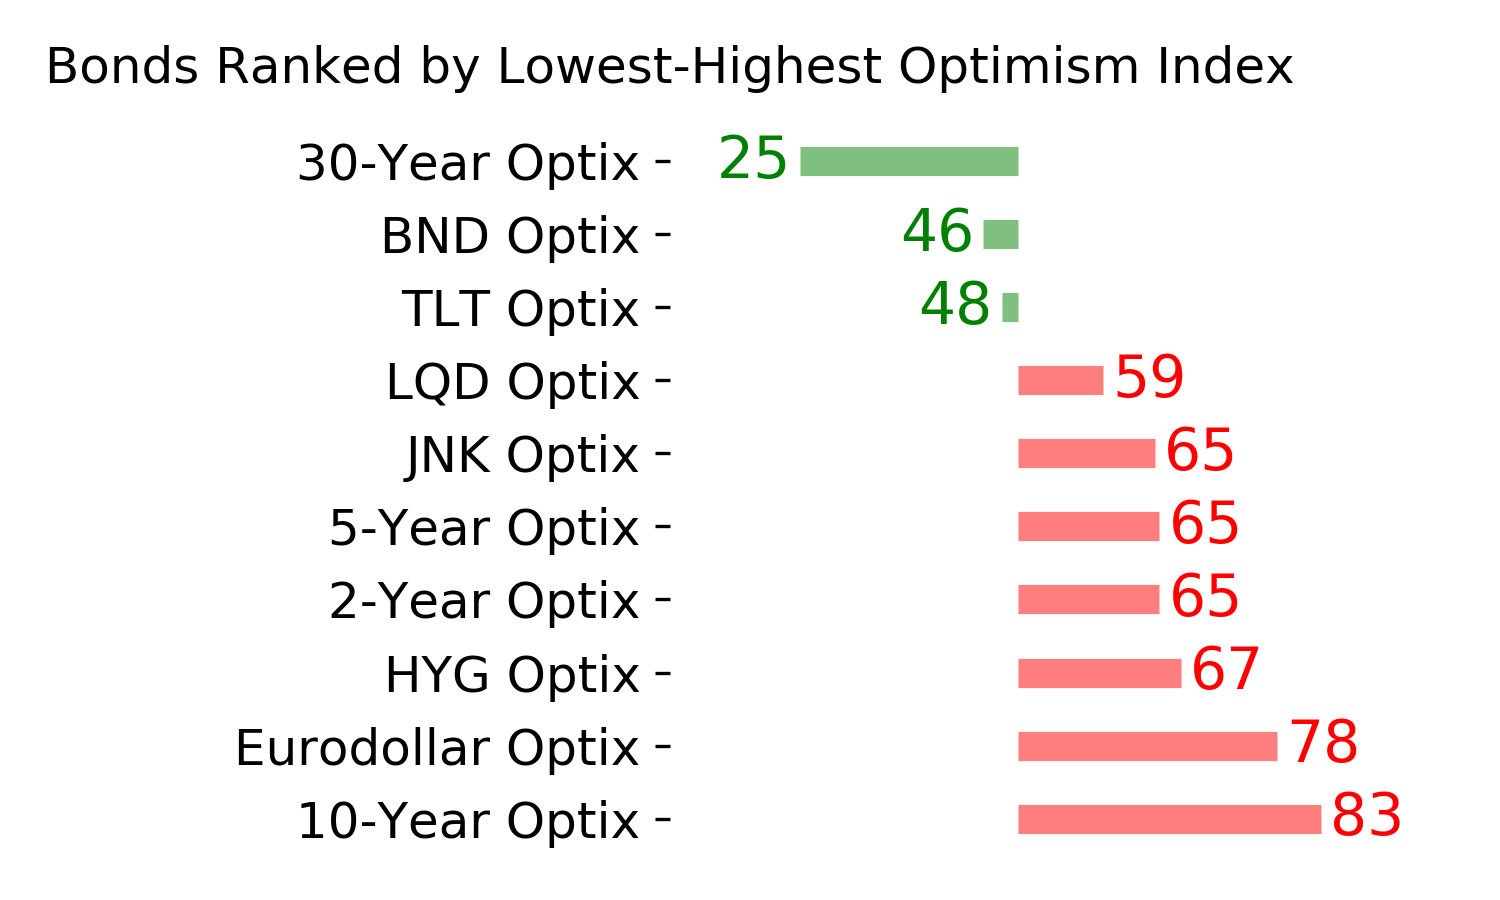
Ranks
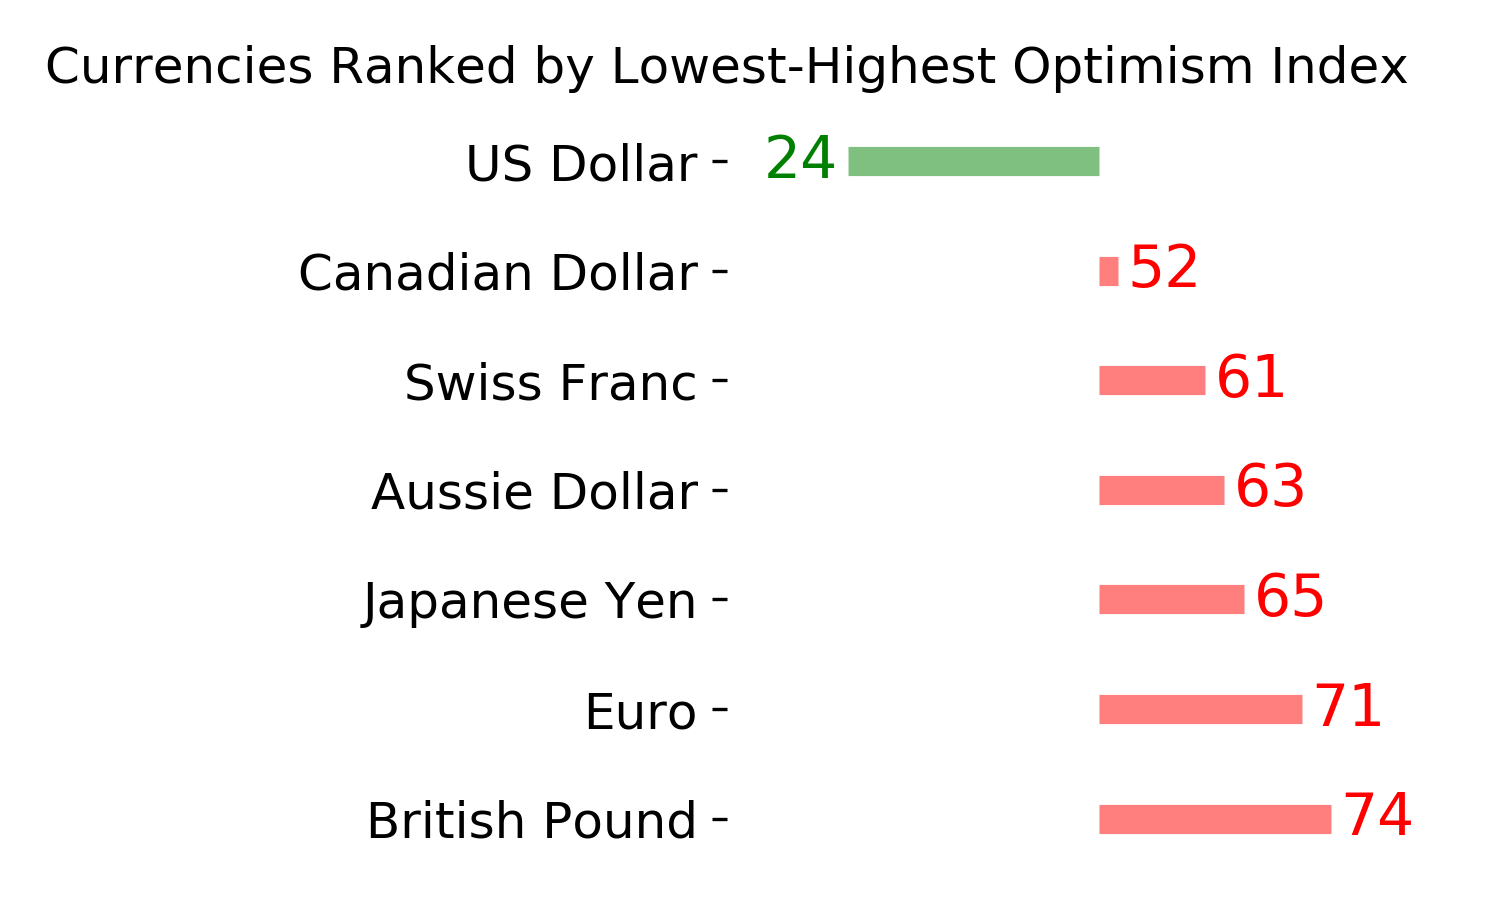
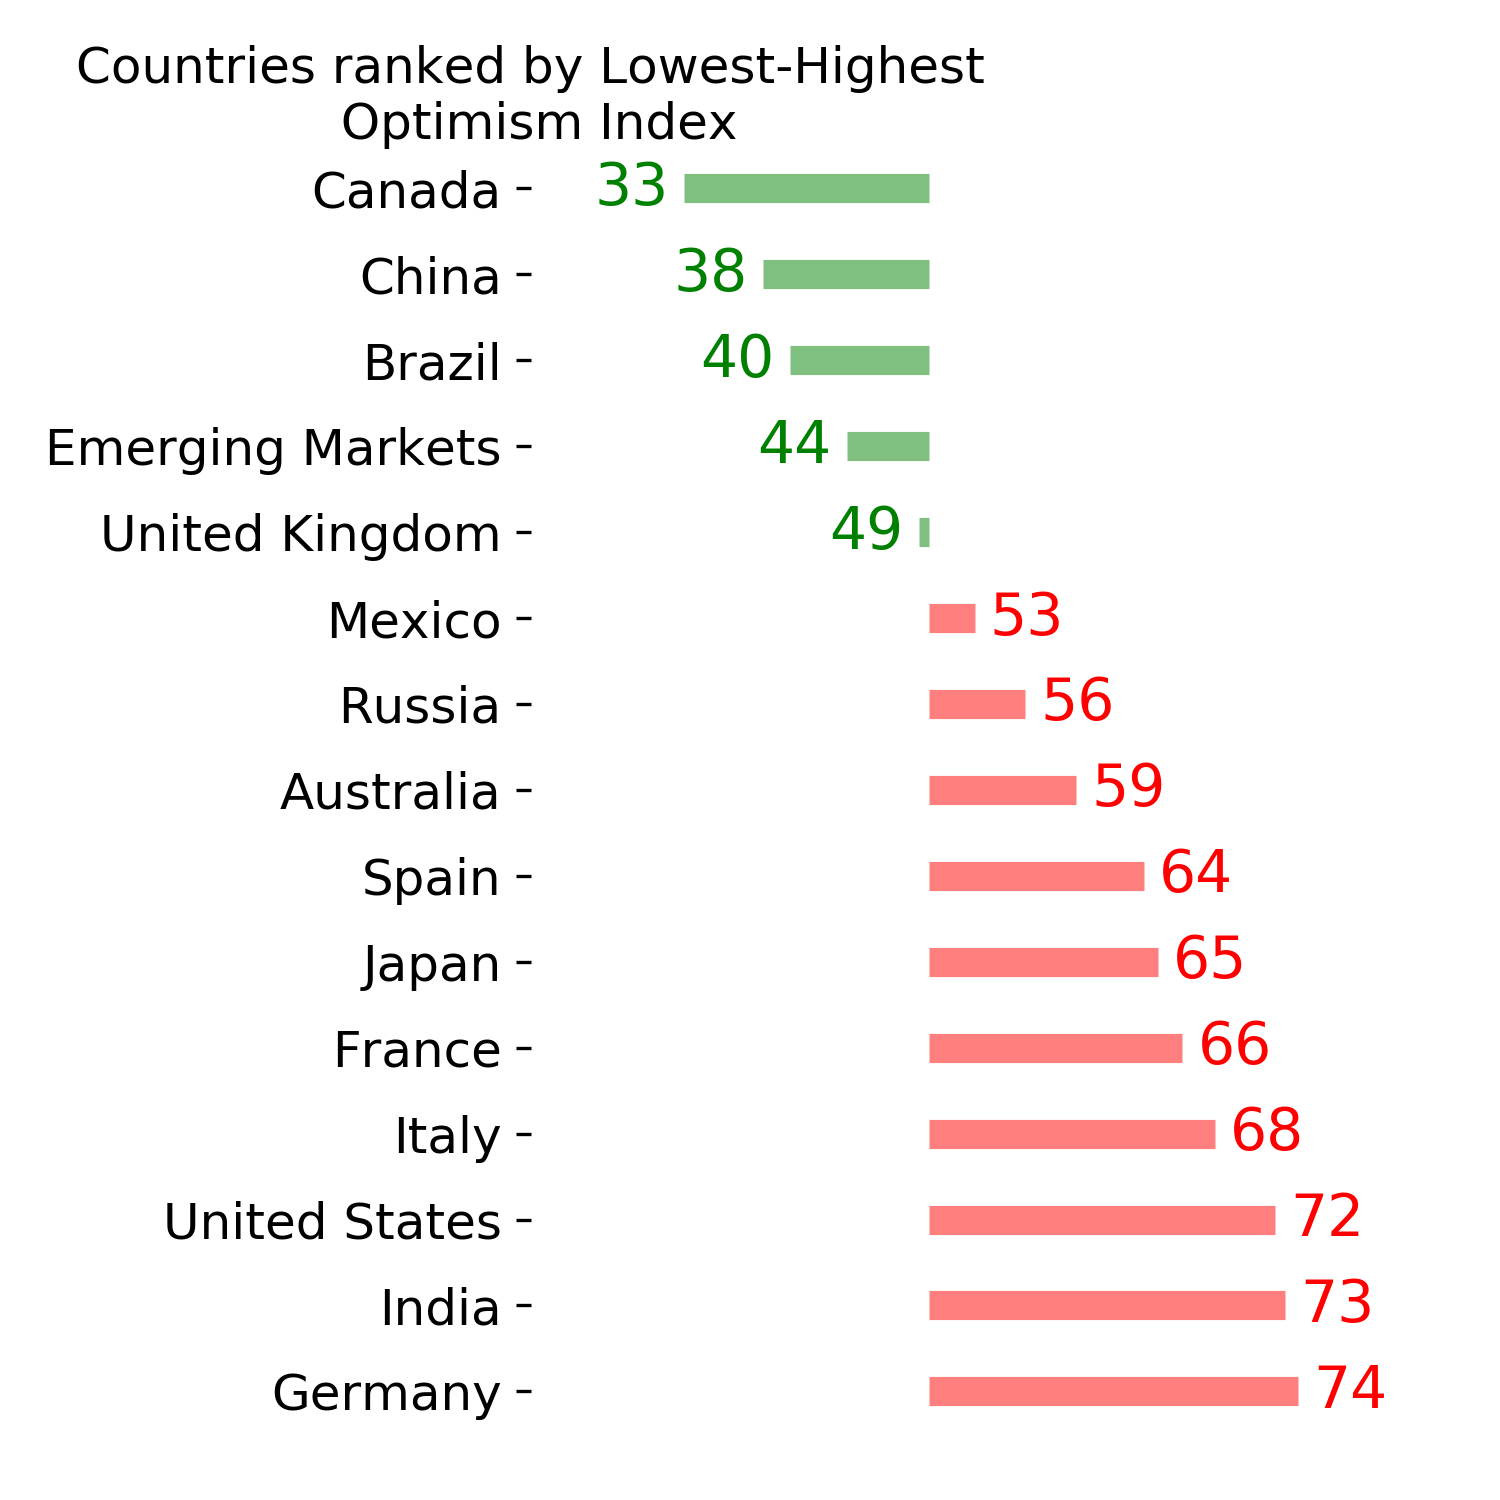
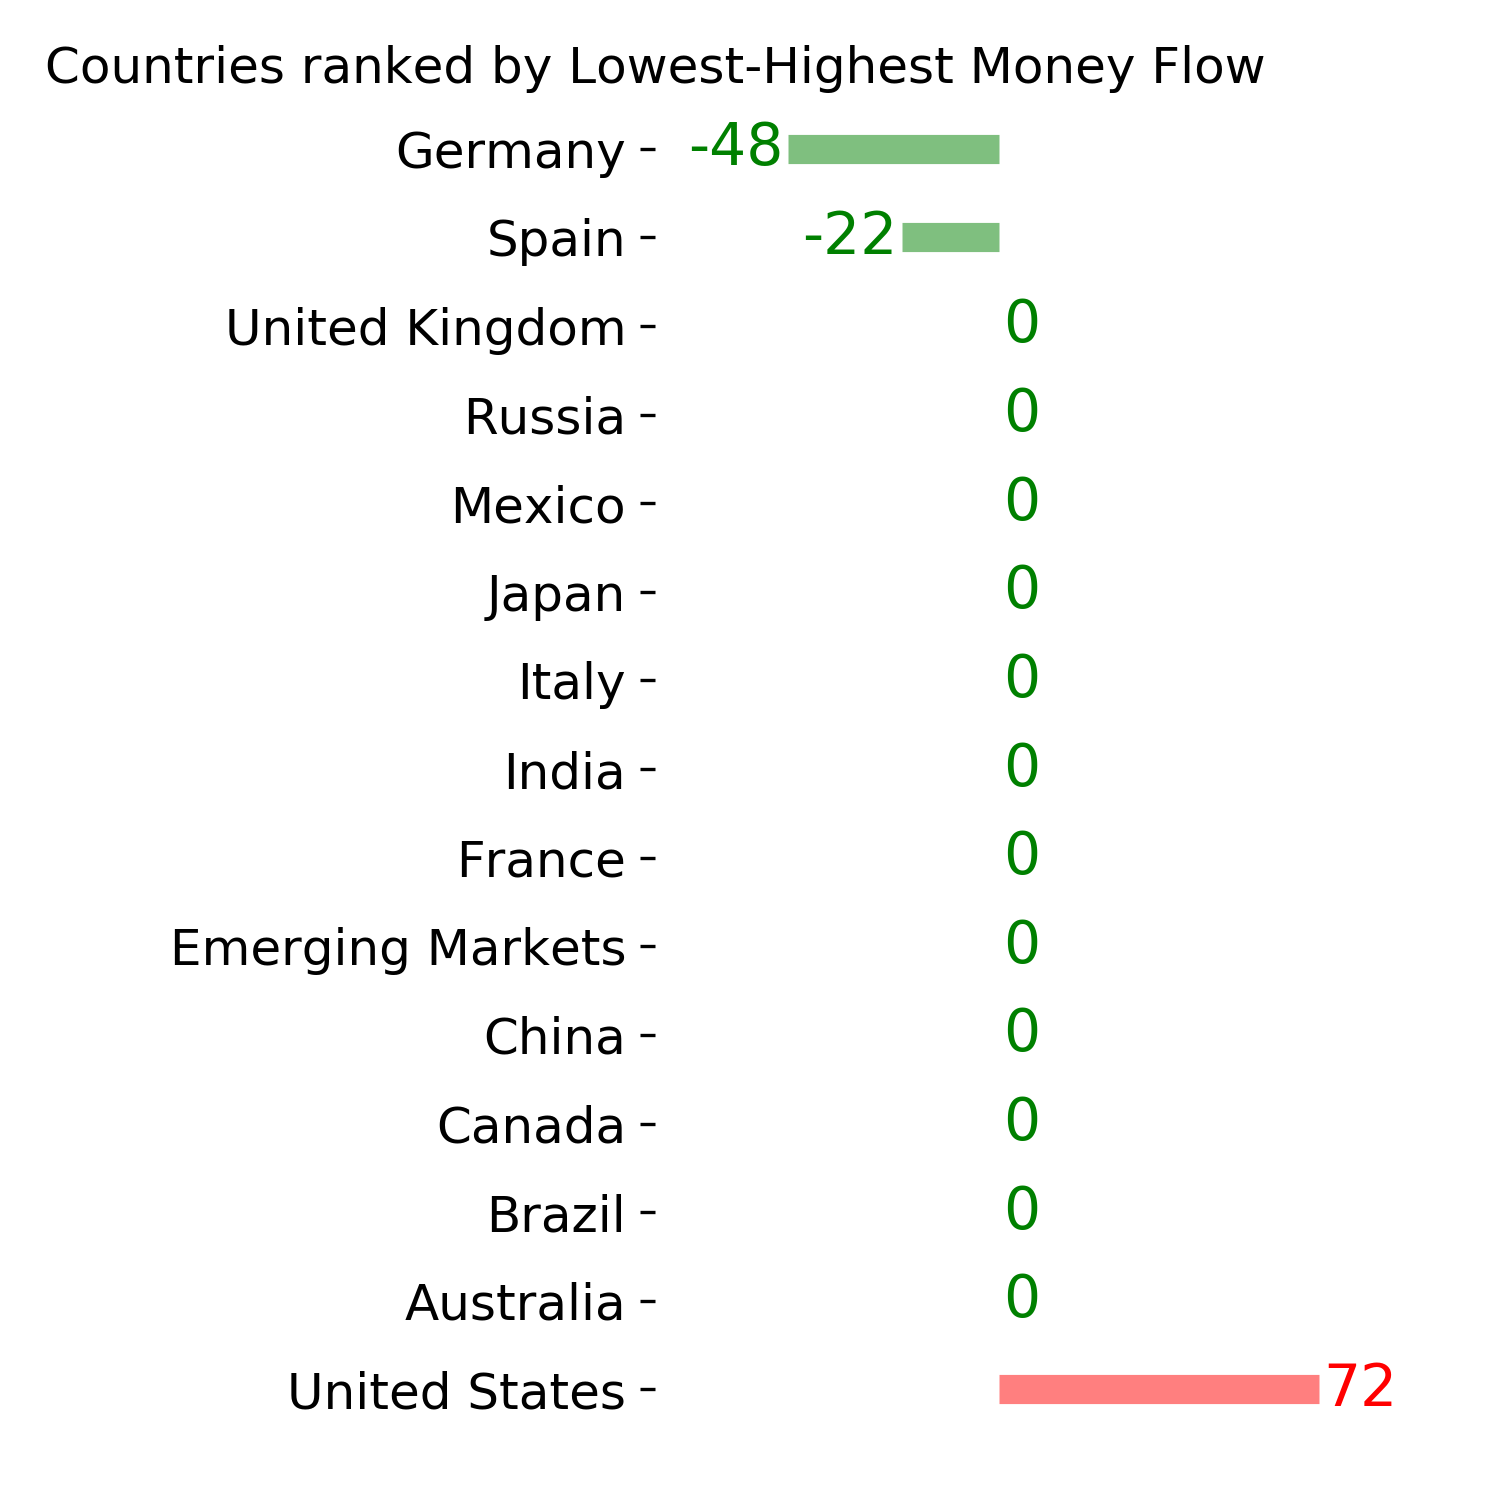
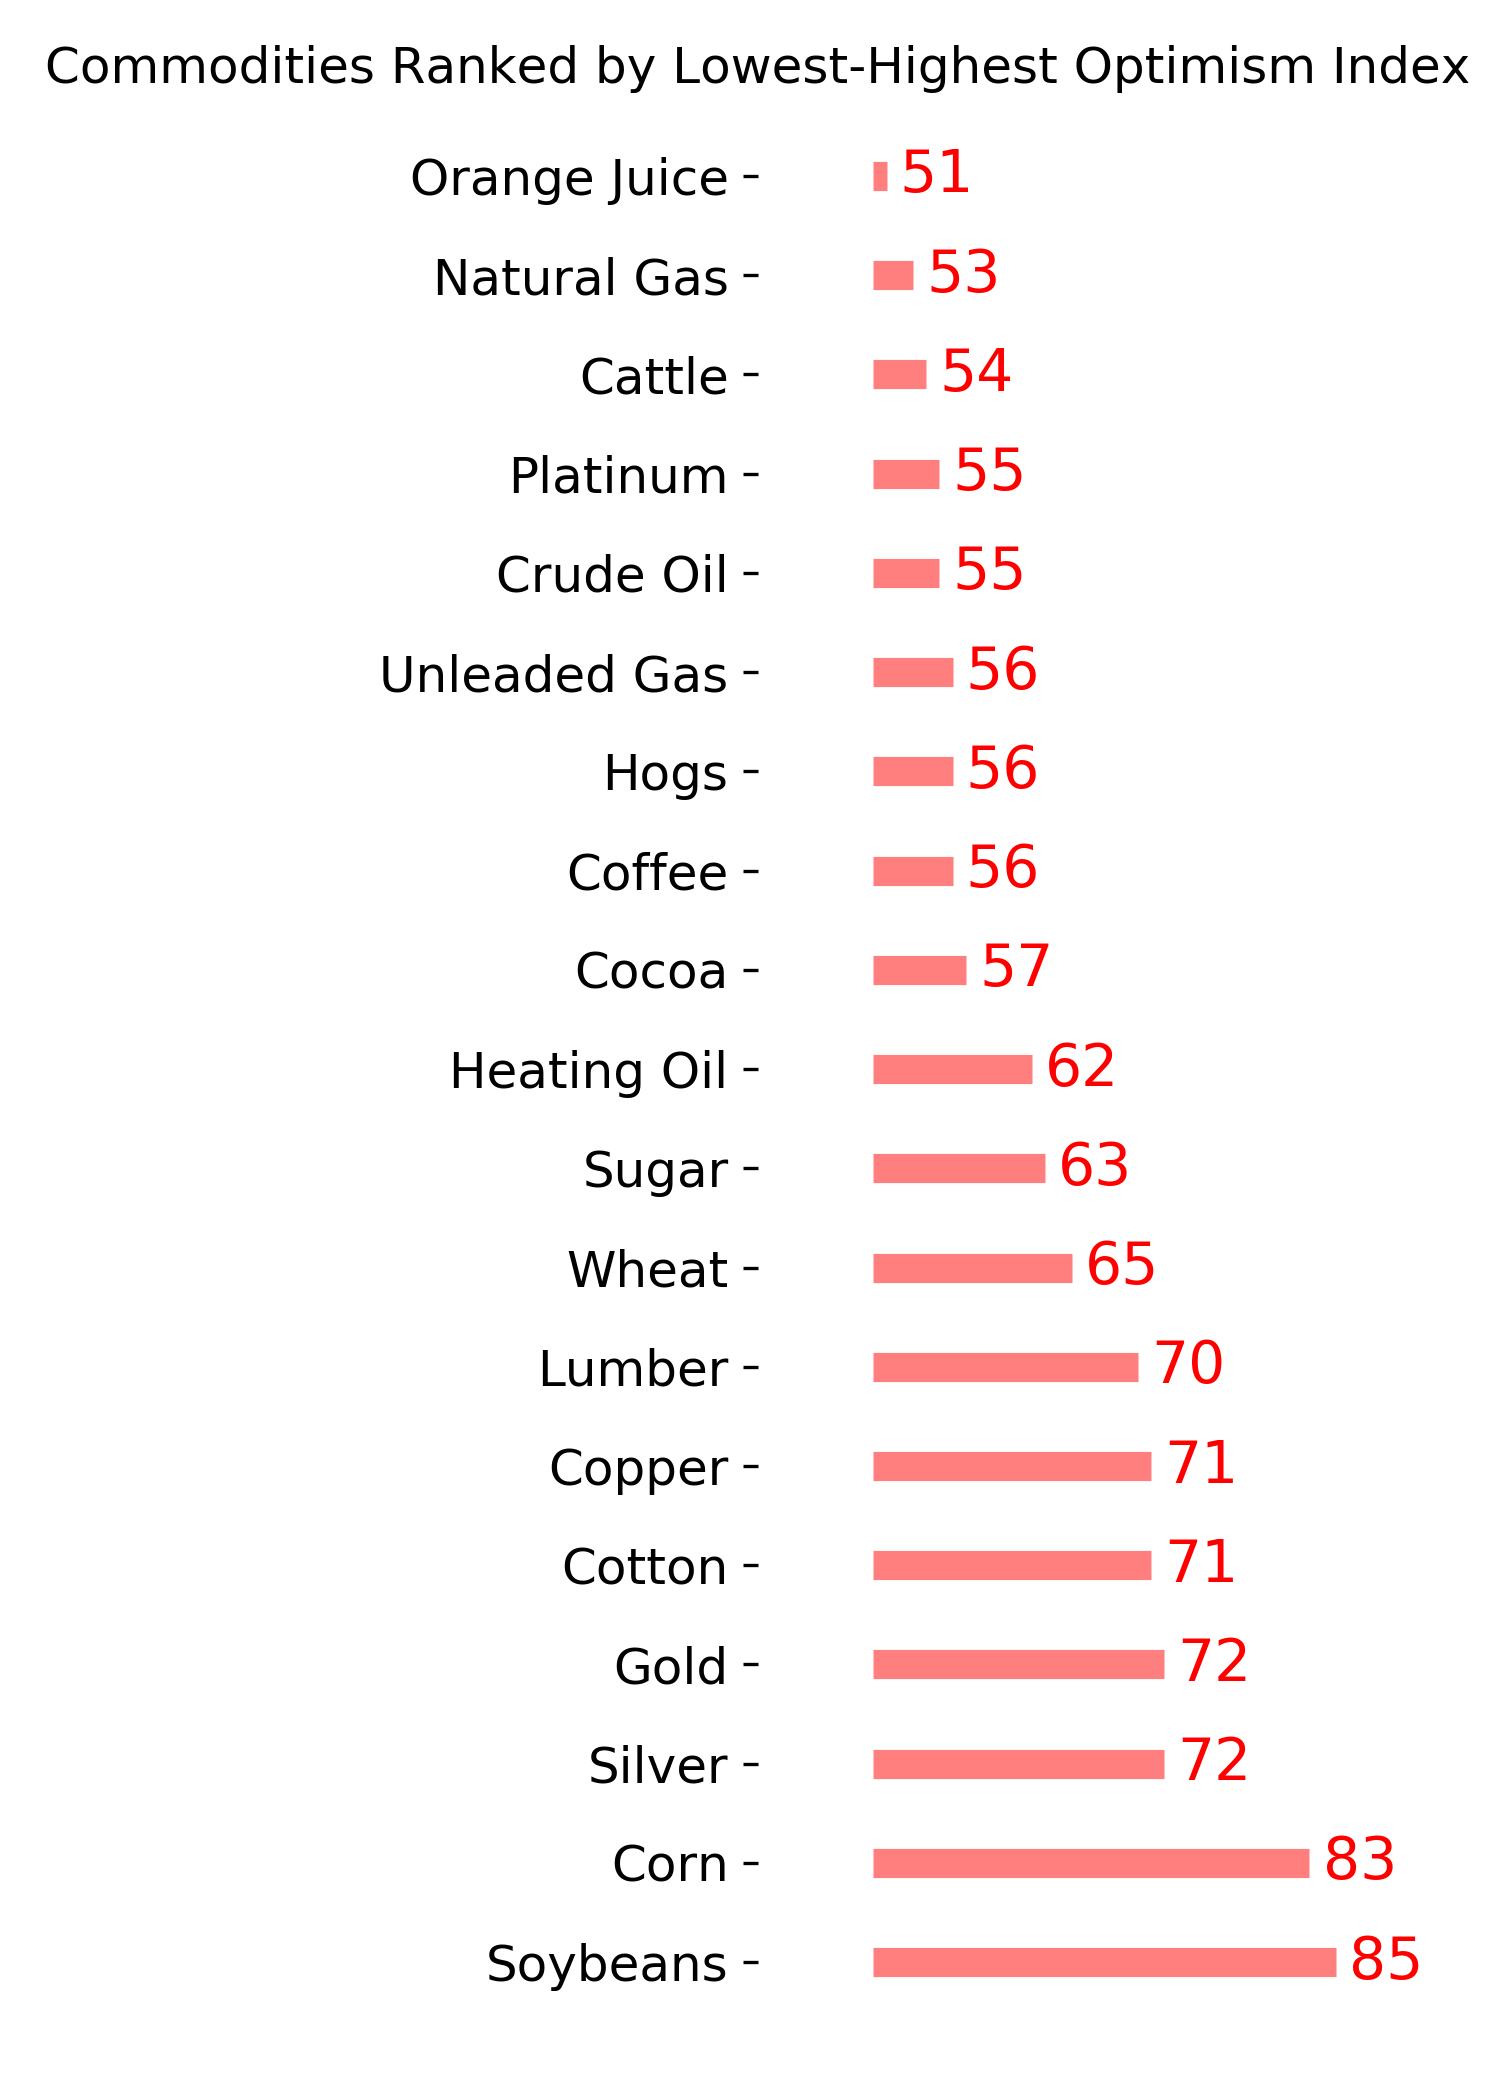
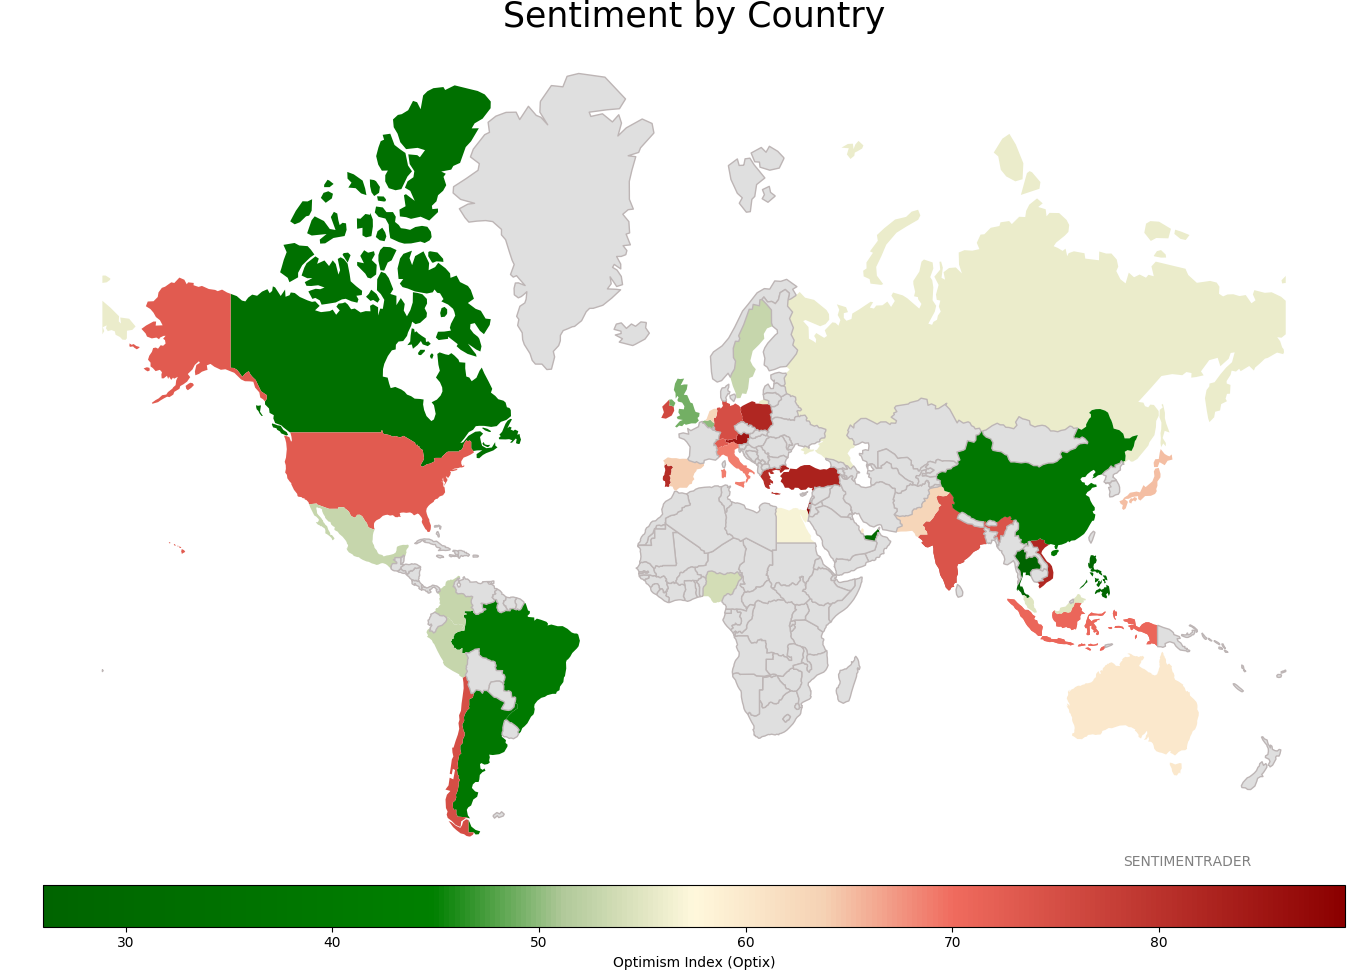
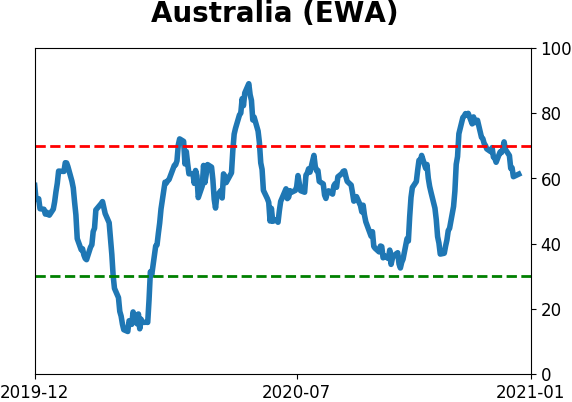
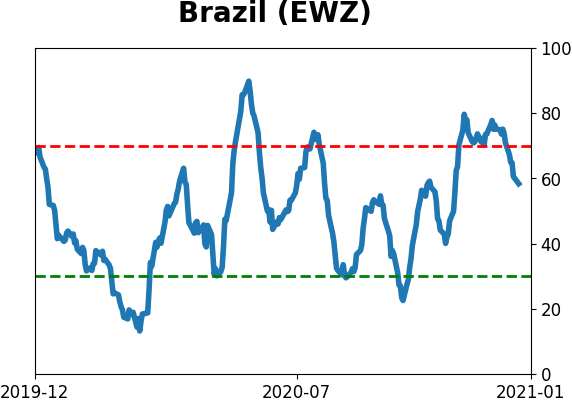
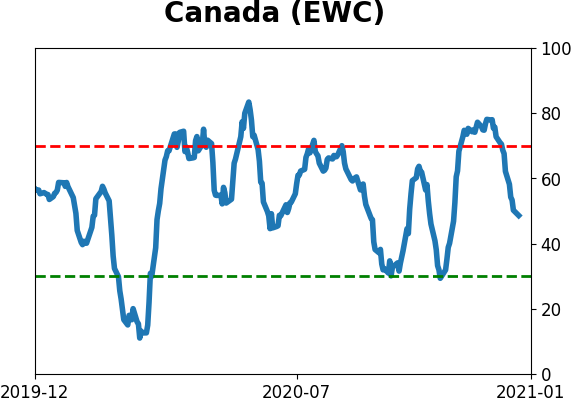
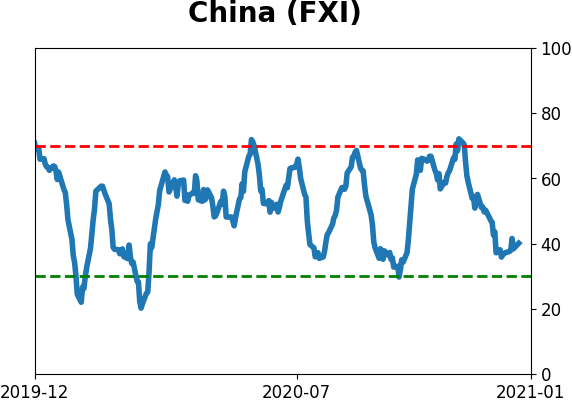
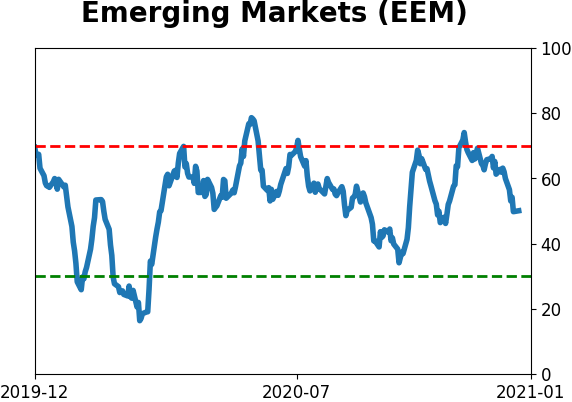
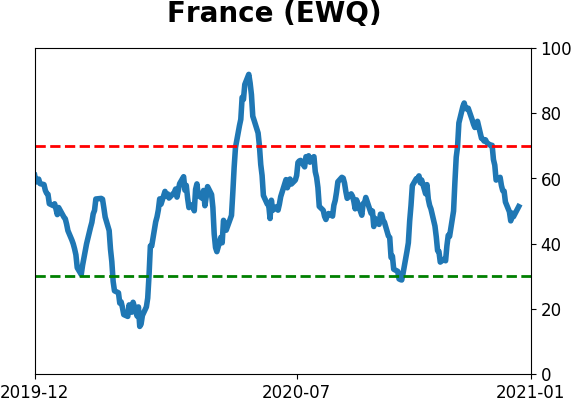
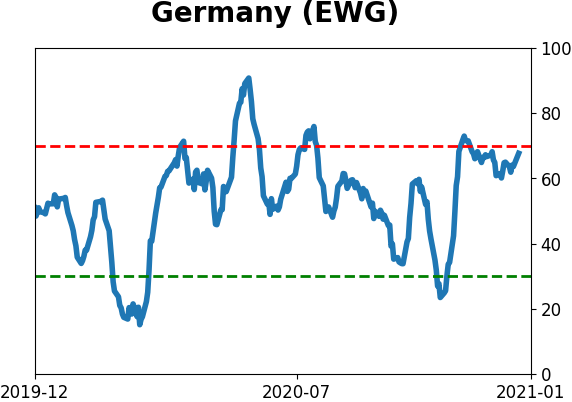
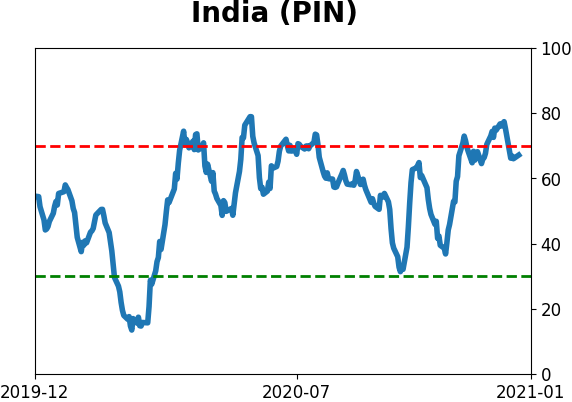
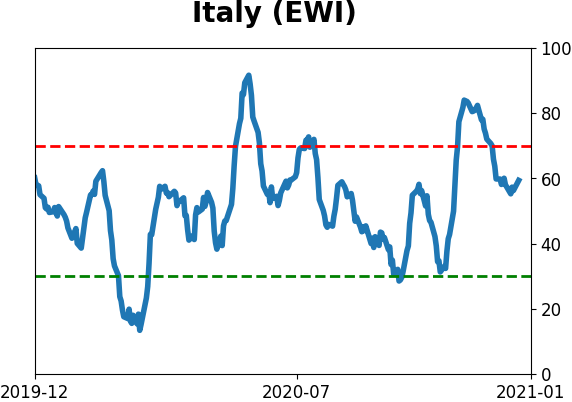
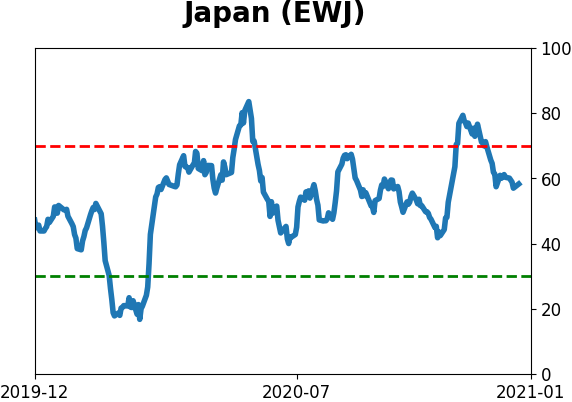
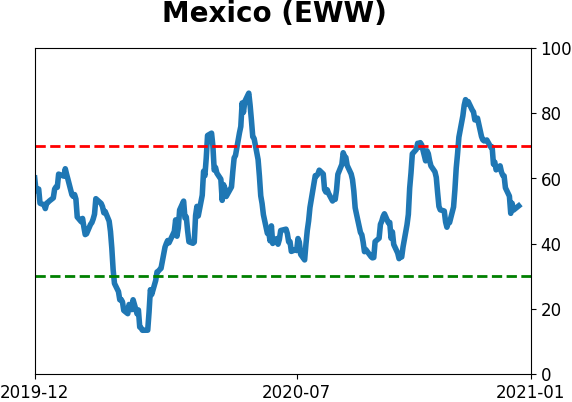
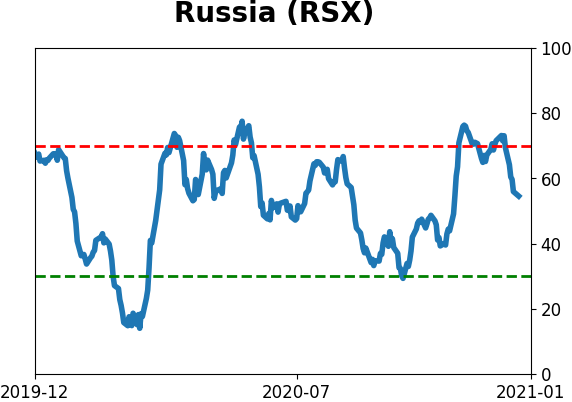
Sentiment Around The World
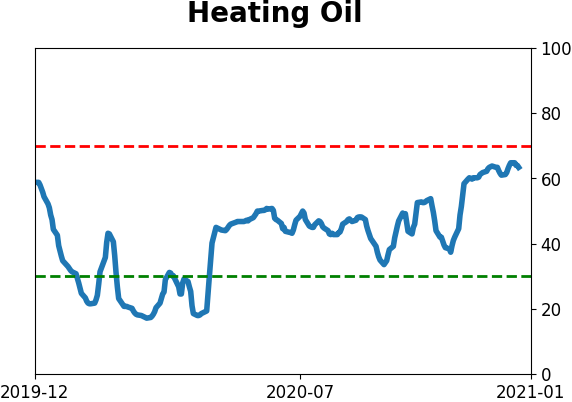
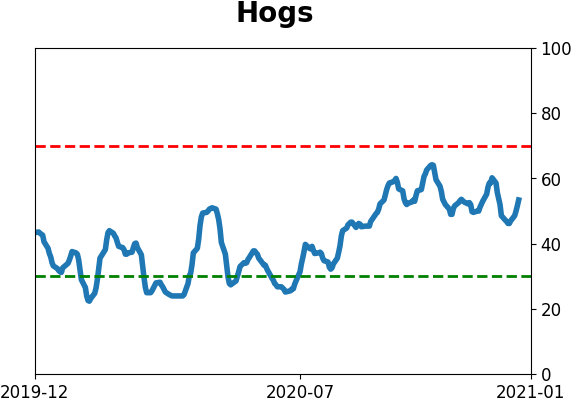
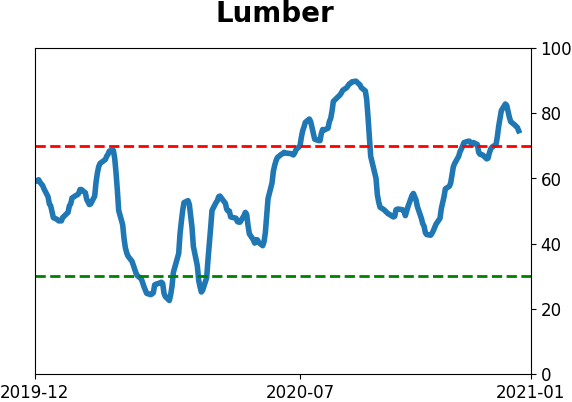
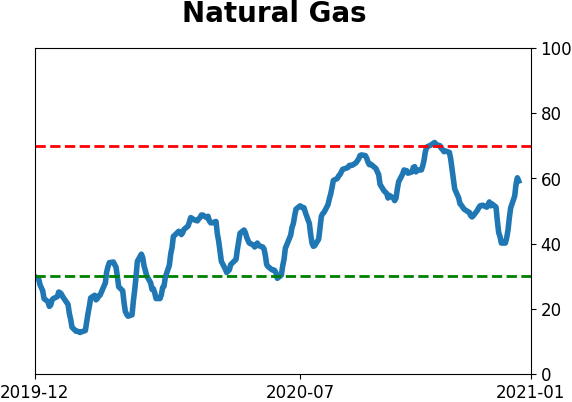
Optimism Index Thumbnails
|
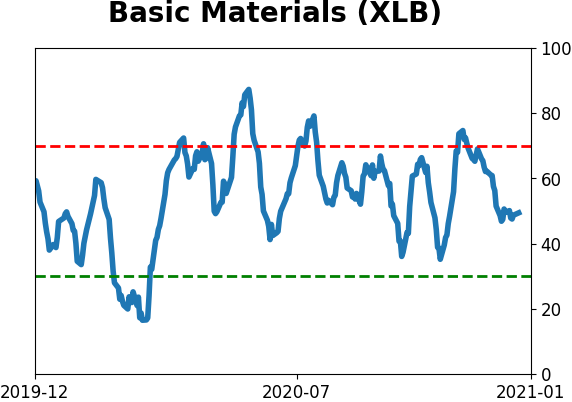
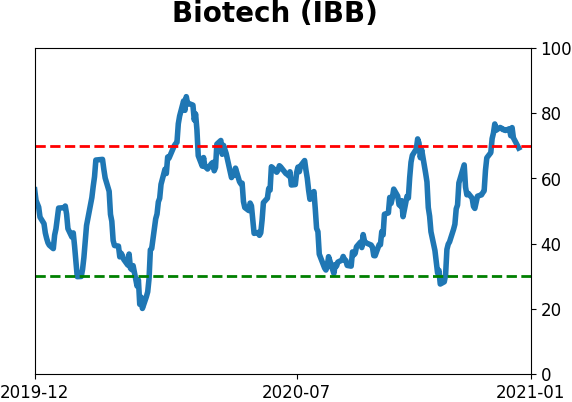
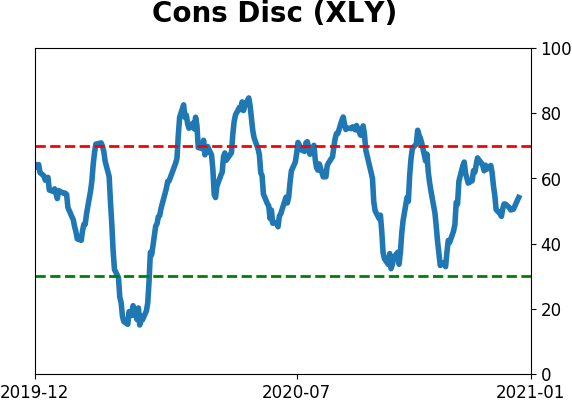
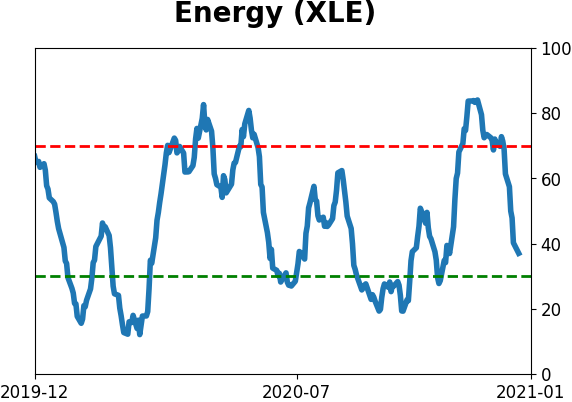
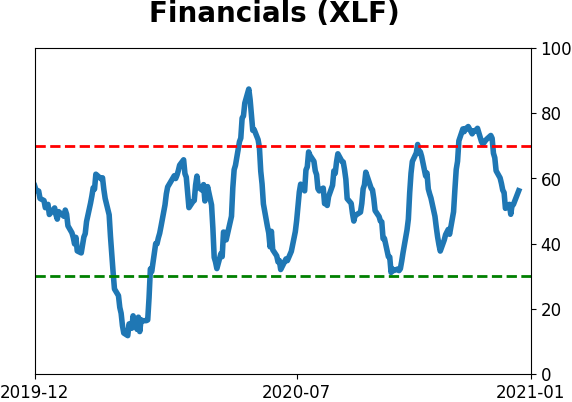
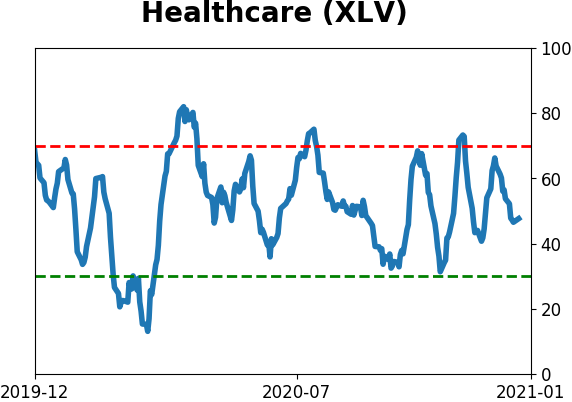
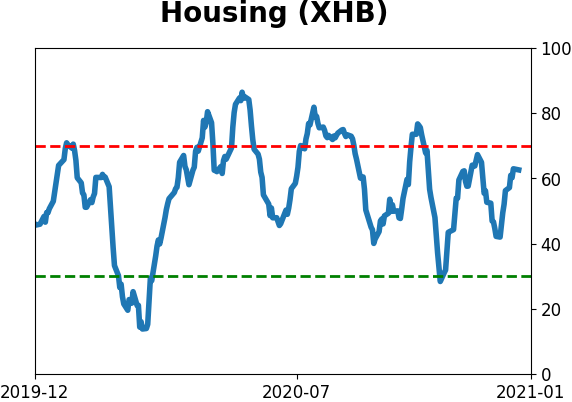
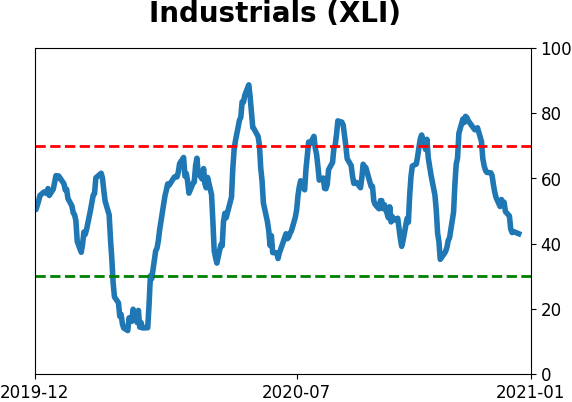
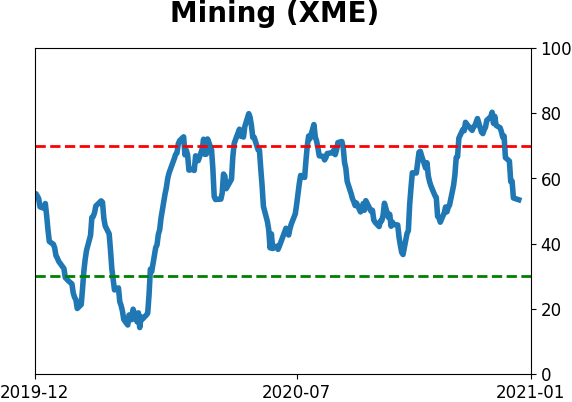
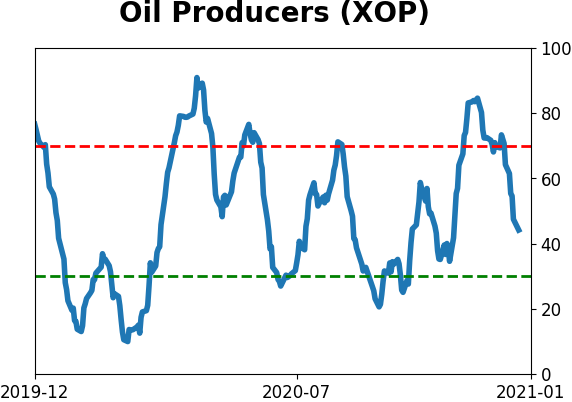
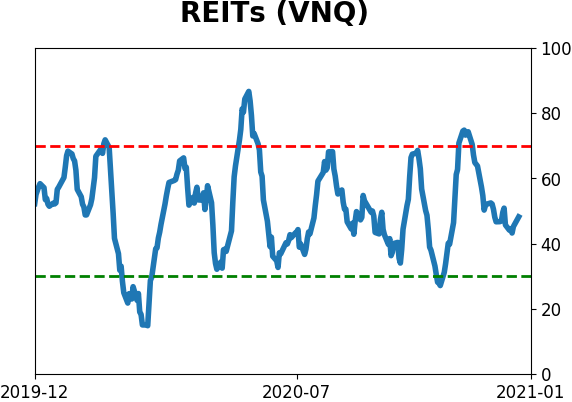
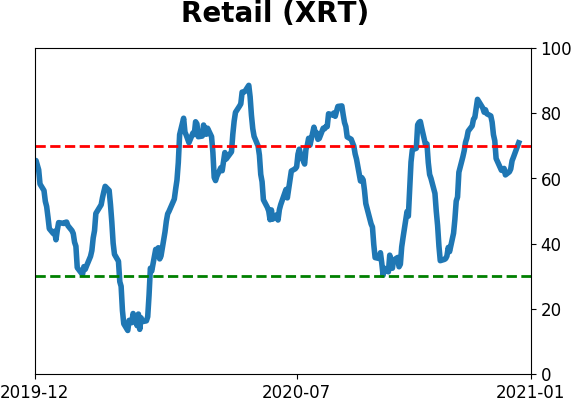
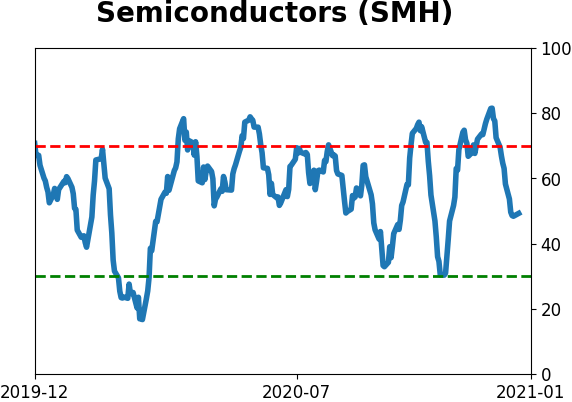
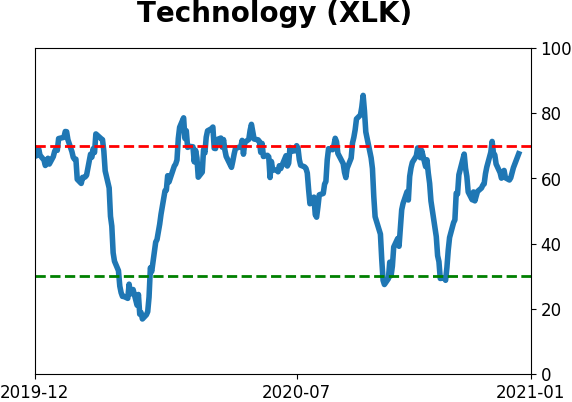
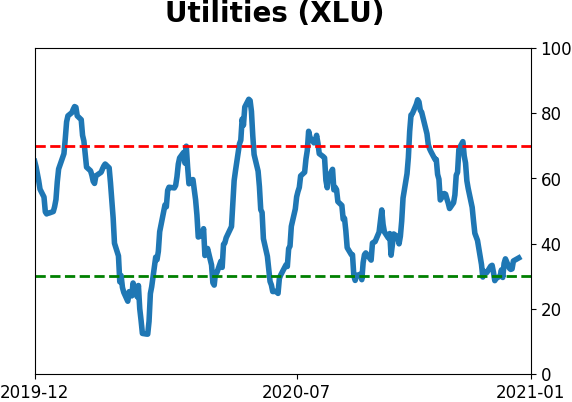
Sector ETF's - 10-Day Moving Average
|
|
|
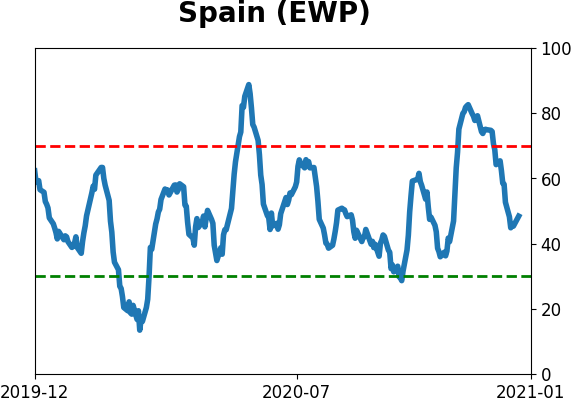
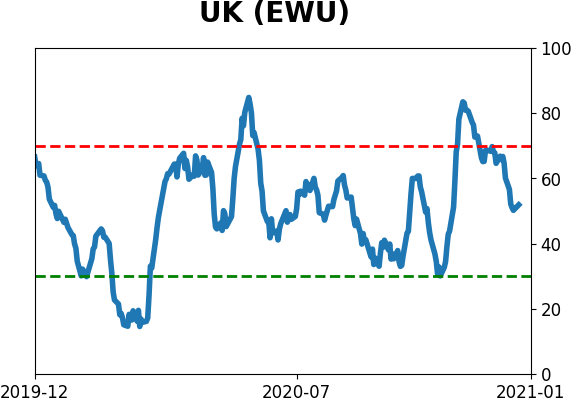
Country ETF's - 10-Day Moving Average
|
|
|
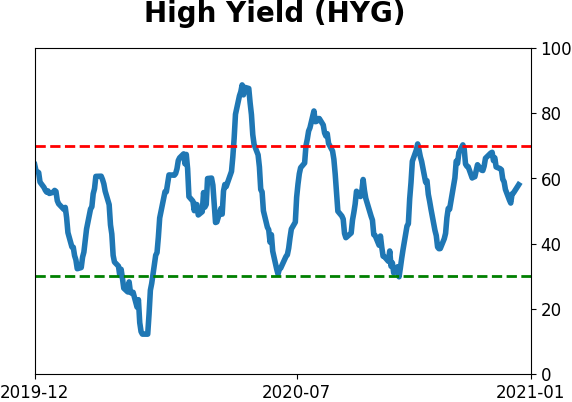
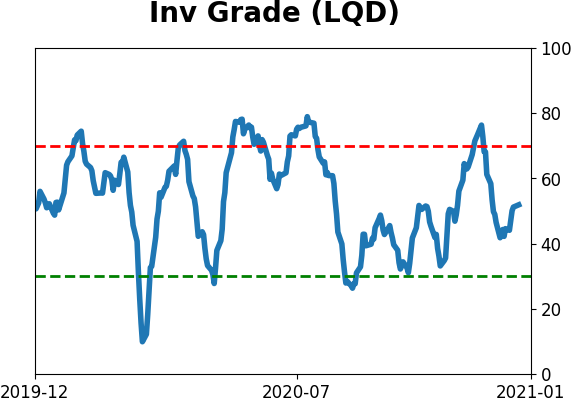
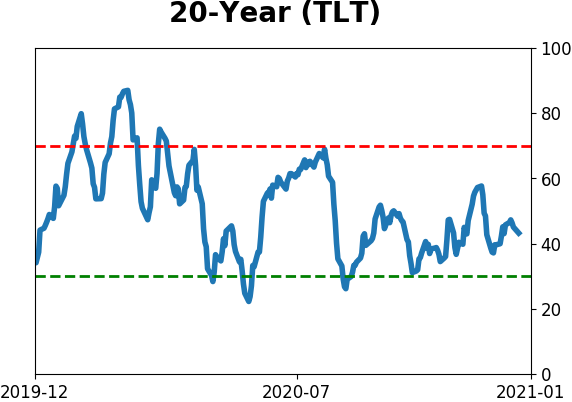
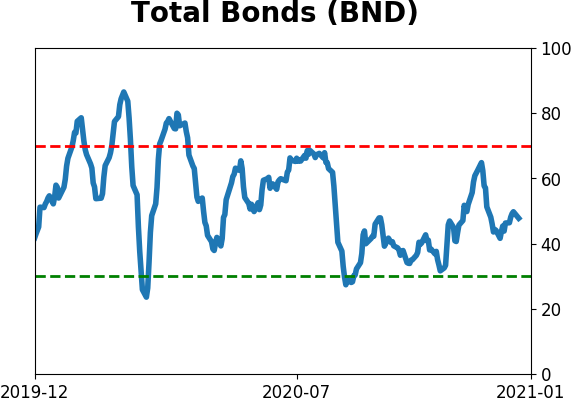
Bond ETF's - 10-Day Moving Average
|
|
|
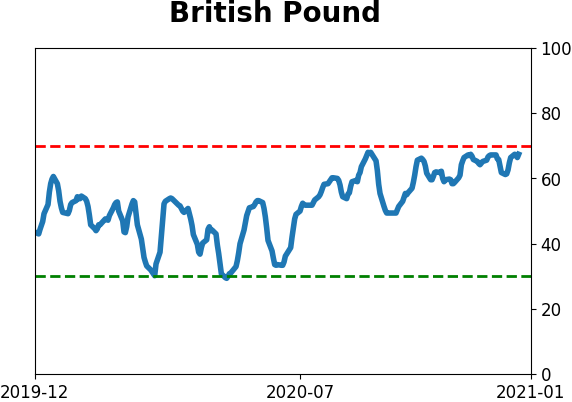
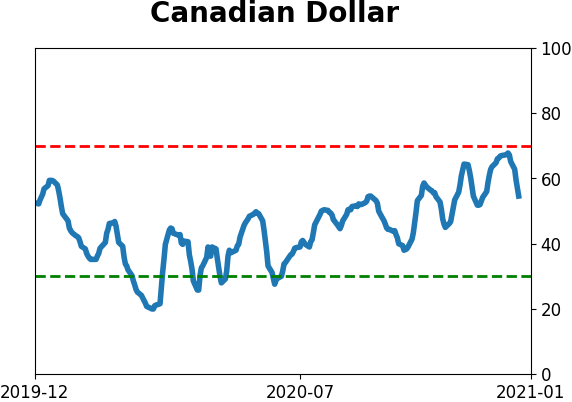
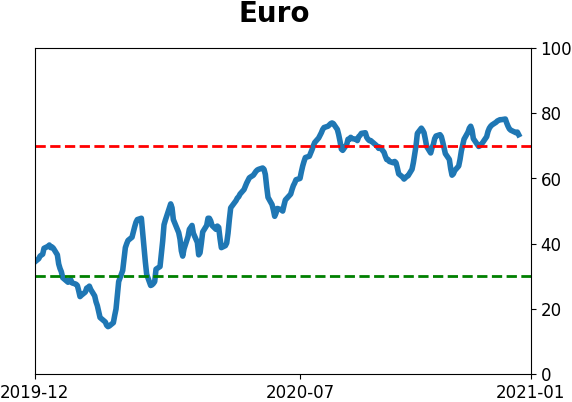
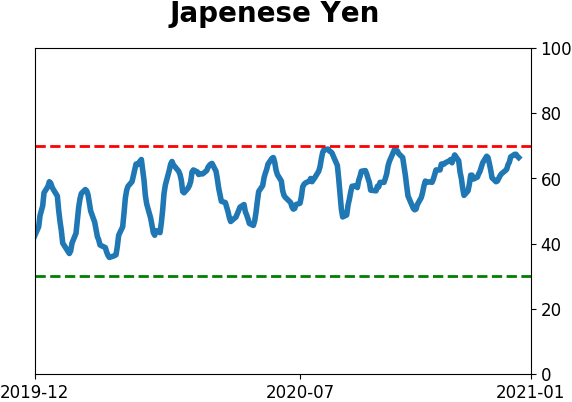
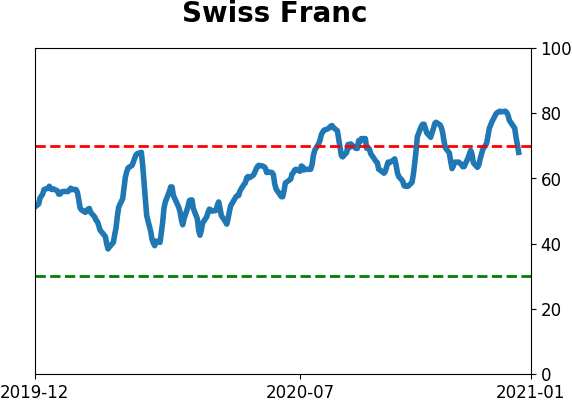
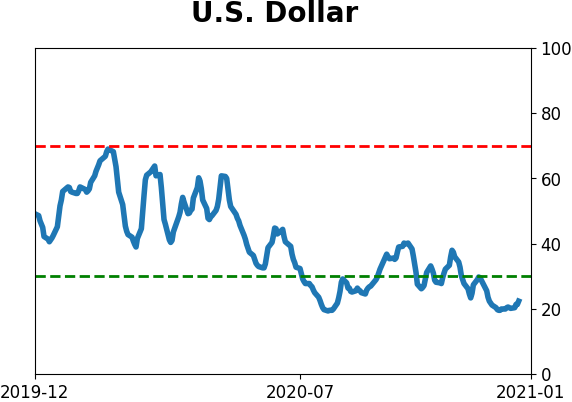
Currency ETF's - 5-Day Moving Average
|
|
|
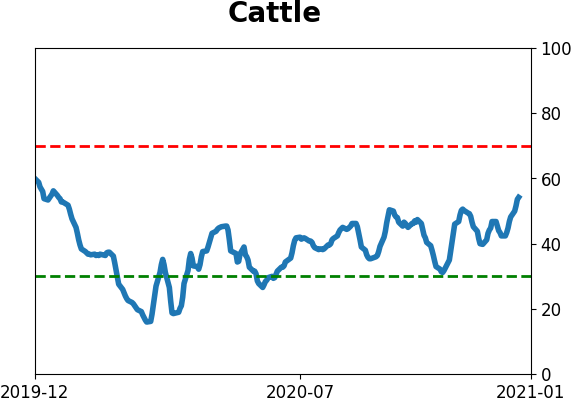
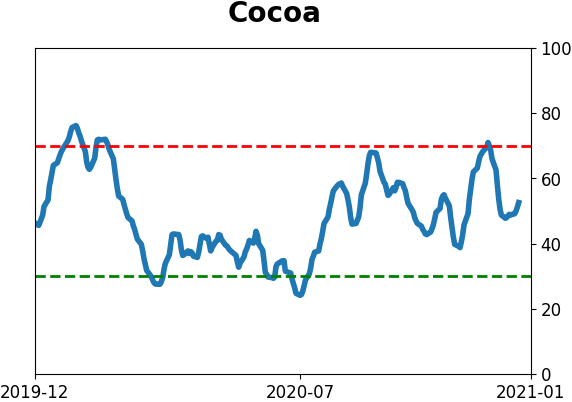
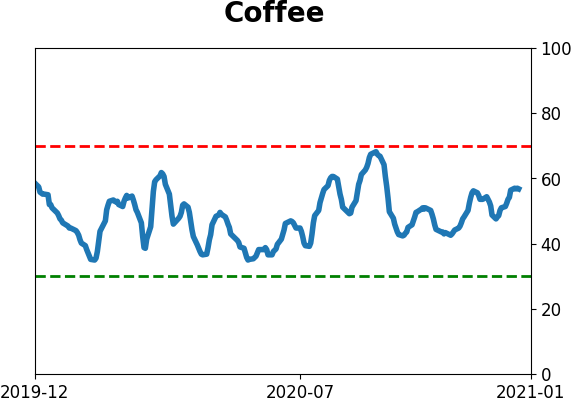
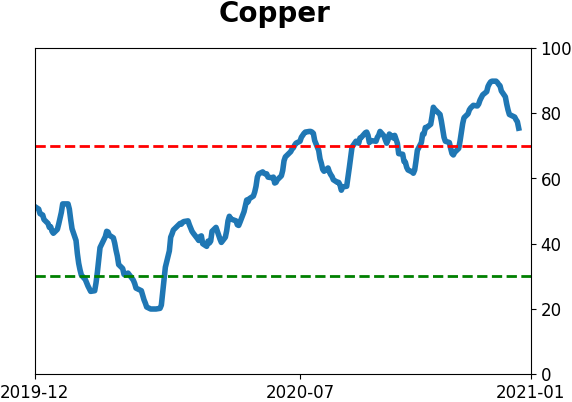
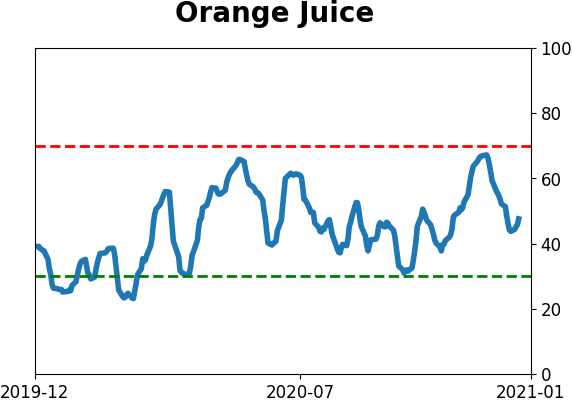
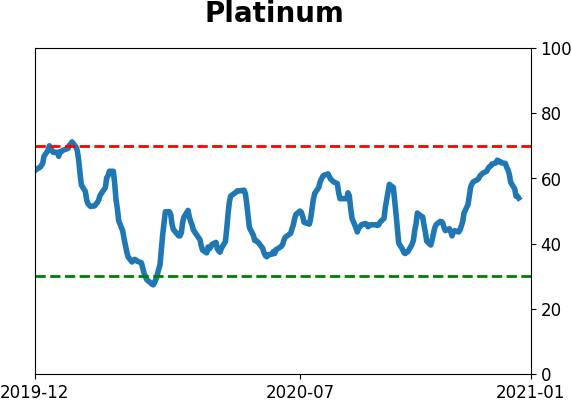
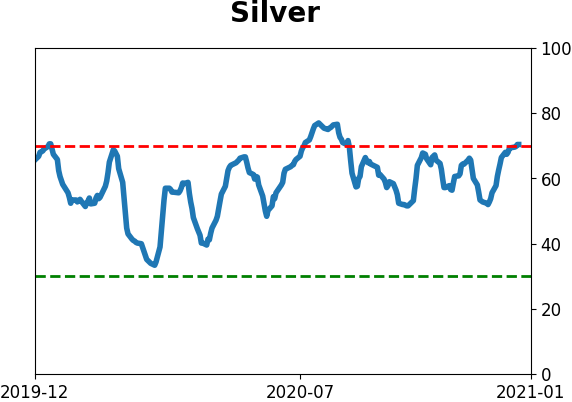
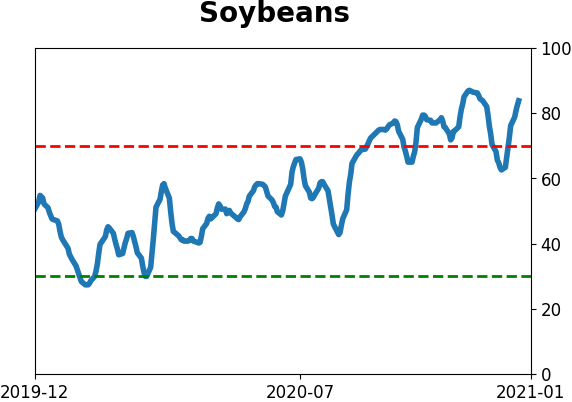
Commodity ETF's - 5-Day Moving Average
|
|