Headlines
|
|
The Panic phase of the Typical Sentiment Cycle has fully reversed:
The late summer decline in the S&P 500 was similar to other Panic phases of the Typical Sentiment Cycle. That Panic has now fully reversed. Similar cycles of a reversal of Panic typically preceded gains for the S&P, with low drawdowns.
|
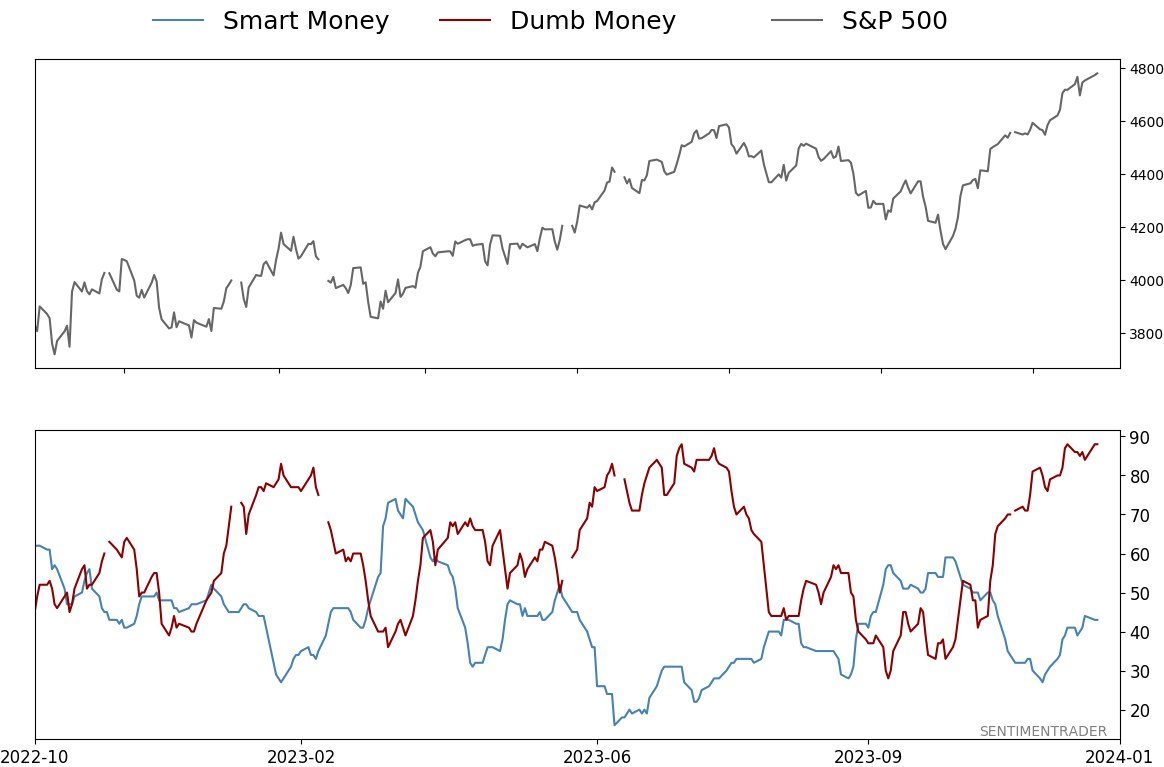
Smart / Dumb Money Confidence
|
Smart Money Confidence: 43%
Dumb Money Confidence: 88%
|
|
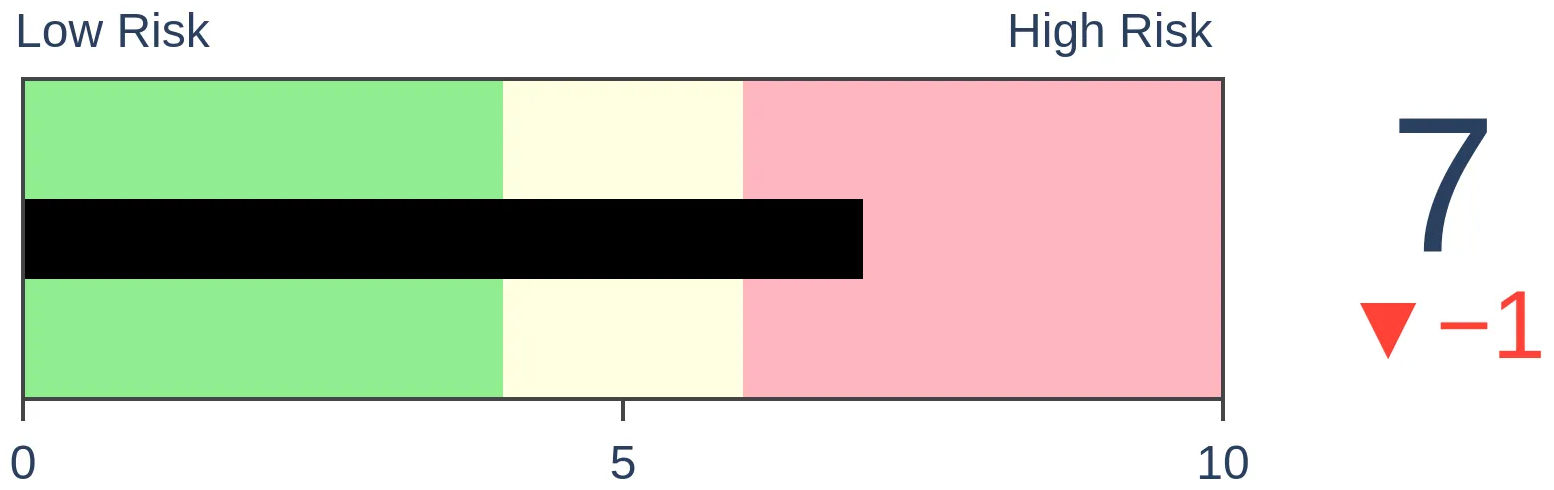
Risk Levels
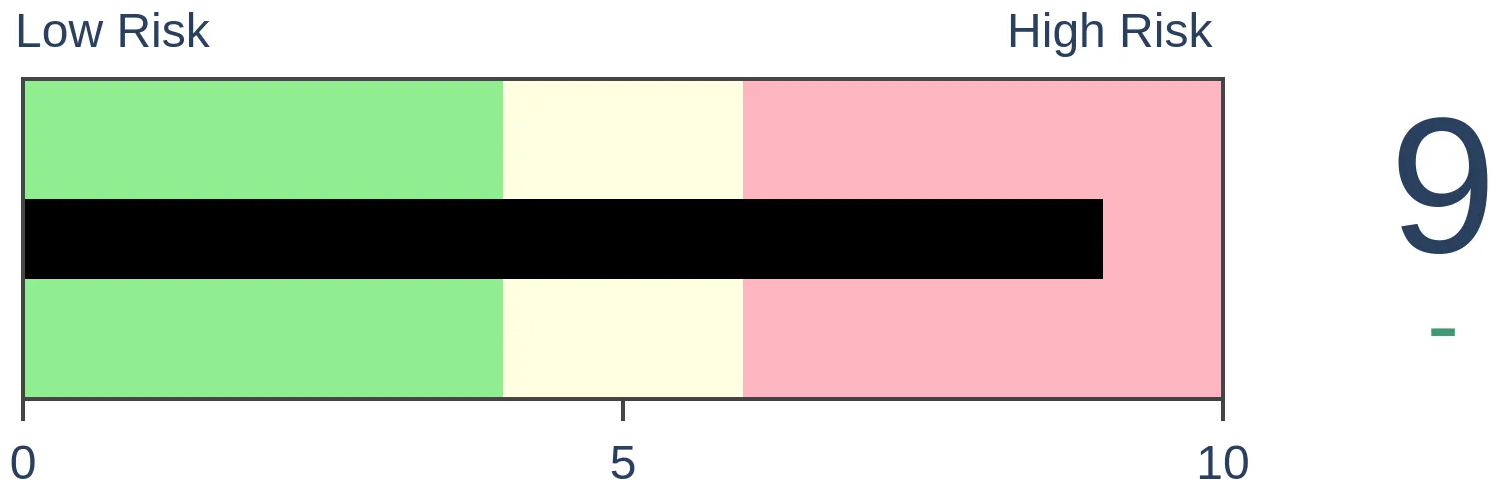
Stocks Short-Term
|
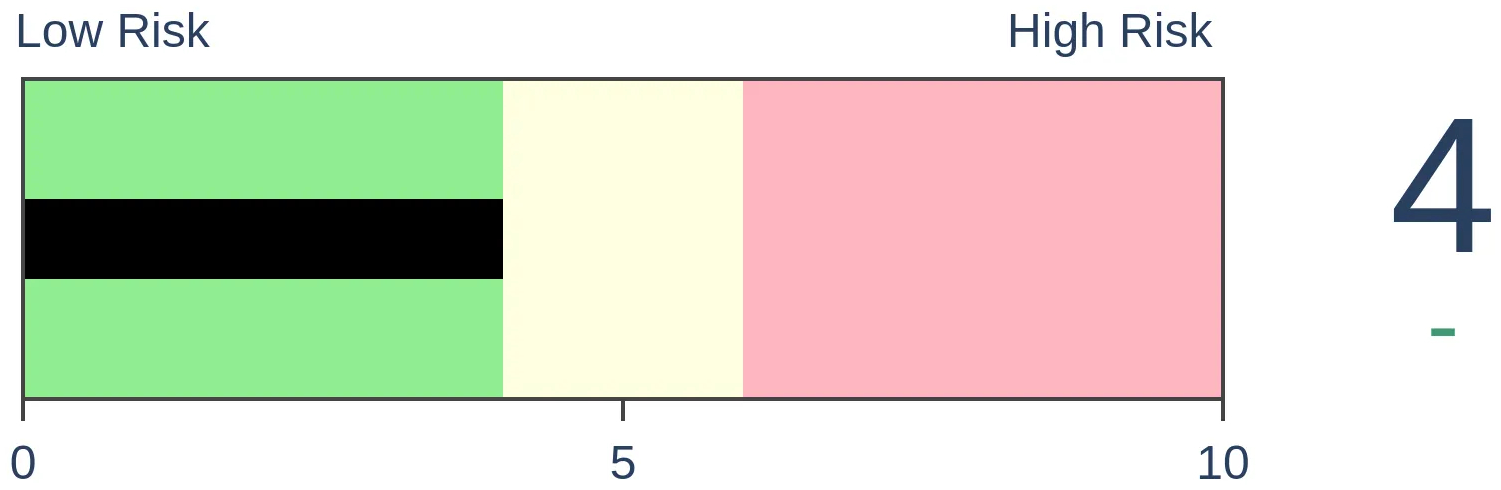
Stocks Medium-Term
|
|
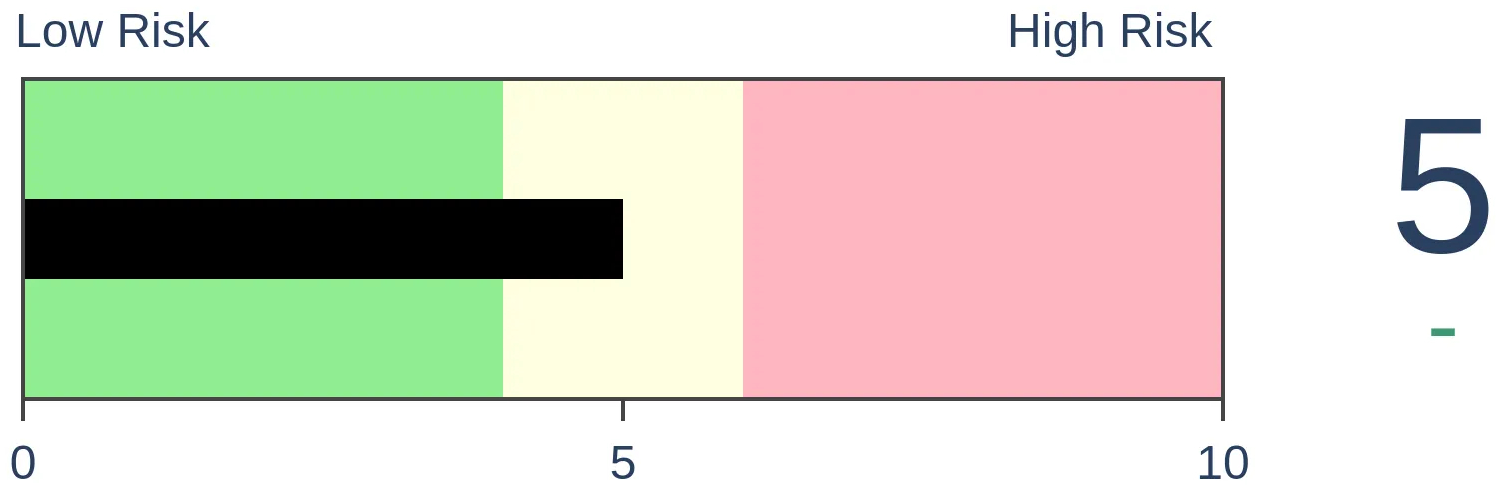
Bonds
|
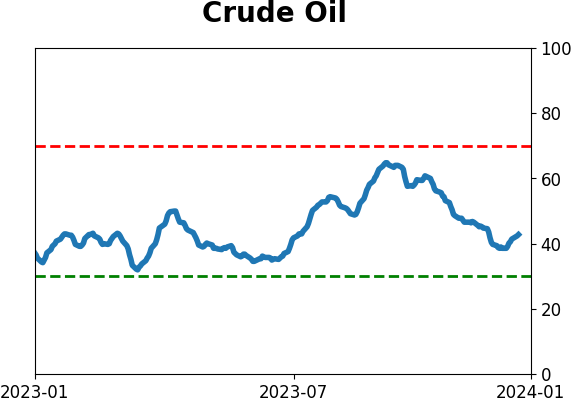
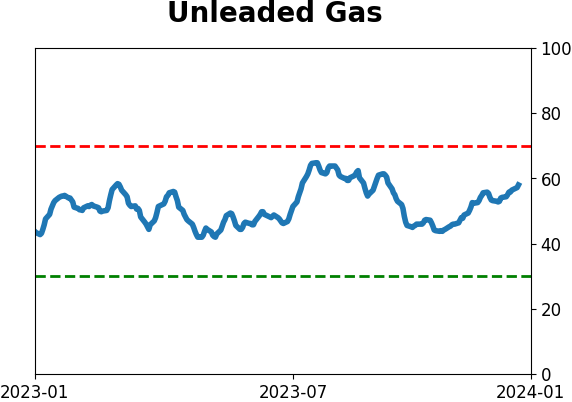
Crude Oil

|
|
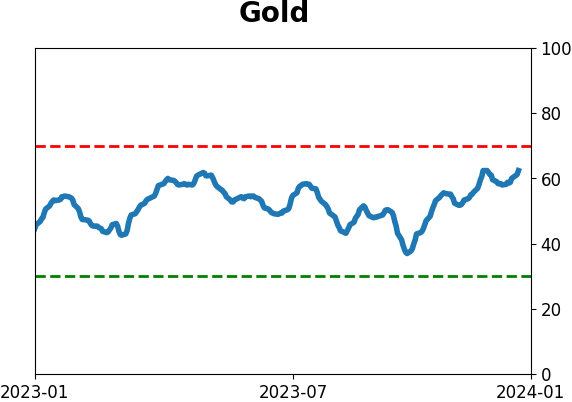
Gold
|
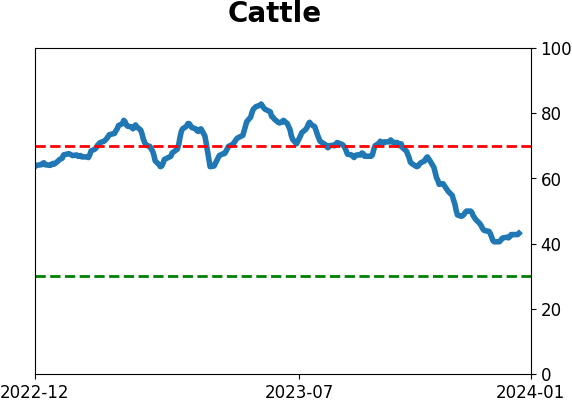
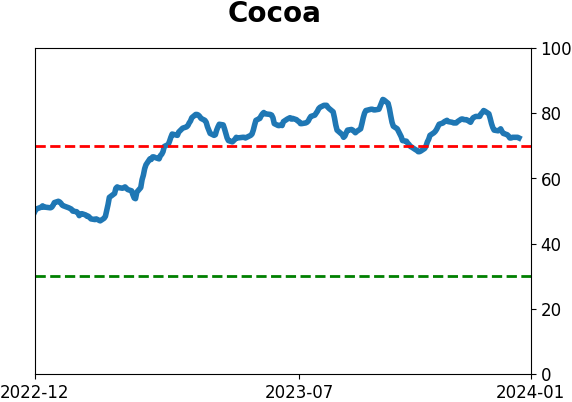
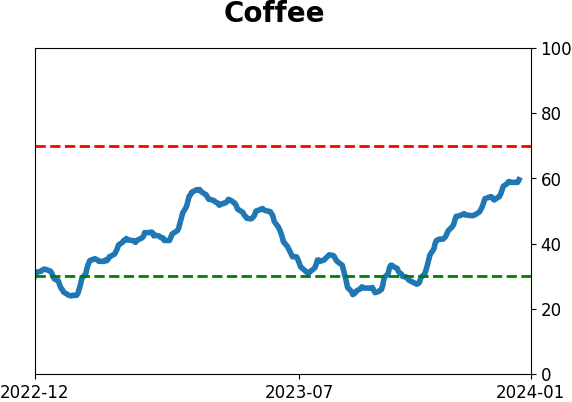
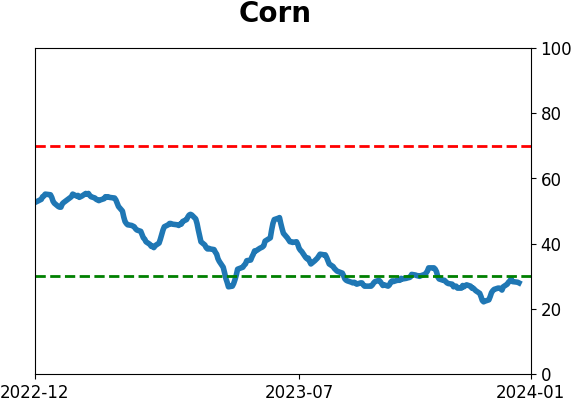
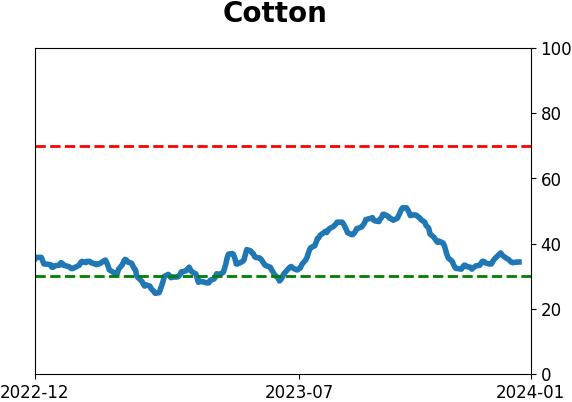
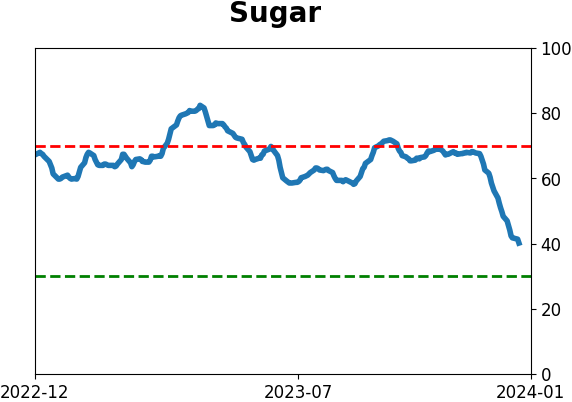
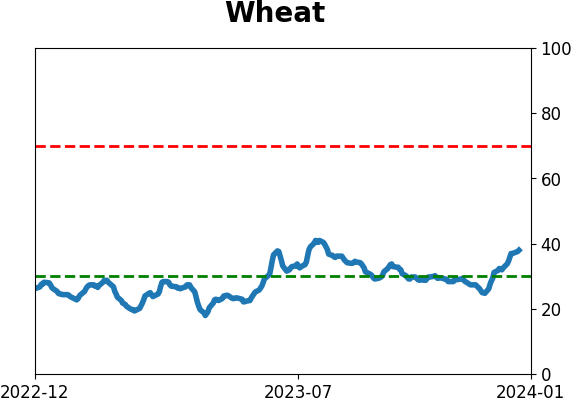
Agriculture

|
|
Research
By Jason Goepfert
BOTTOM LINE
The late summer decline in the S&P 500 was similar to other Panic phases of the Typical Sentiment Cycle. That Panic has now fully reversed. Similar cycles of a reversal of Panic typically preceded gains for the S&P, with low drawdowns.
FORECAST / TIMEFRAME
None
|
Key points:
- By October, the Typical Sentiment Cycle suggested that investors were in the Panic phase
- That has now fully reversed
- Similar cycles, when the Panic phase of the Cycle fully reversed, typically preceded low drawdowns in the S&P 500
The Panic phase of the Typical Sentiment Cycle has fully reversed
Last October, we saw that according to the Typcial Sentiment Cycle, investors had been woefully discouraged for a historic length of time. Then, they exhibited signs of returning confidence by March of this year, which was also a good sign for forward returns.
A popular heuristic uses some version of the Cycle popularized by Justin Mamis in his 1999 book, The Nature of Risk. The Mamis chart encompasses the price path of U.S. stocks from roughly May 1990 through March 1991.
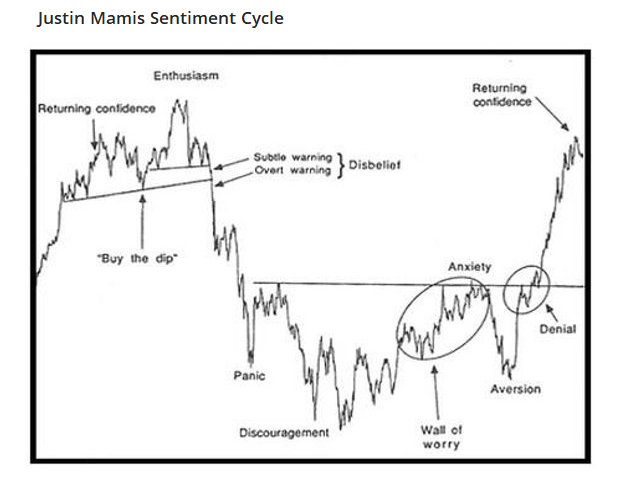
There are essentially four major parts to the Cycle:
1. Enthusiasm - High optimism, easy credit, a rush of offerings, risky stocks outperforming, stretched valuations
2. Panic - Extreme pessimism, oversold breadth, risky stocks crash, negative media coverage, credit slams shut
3. Discouragement - Stocks go nowhere, trend-followers suffer, some pockets of outperformance, credit starts to thaw, activity slows
4. Returning Confidence - Stocks rise choppily, smaller stocks do well, credit becomes easy, more new offerings
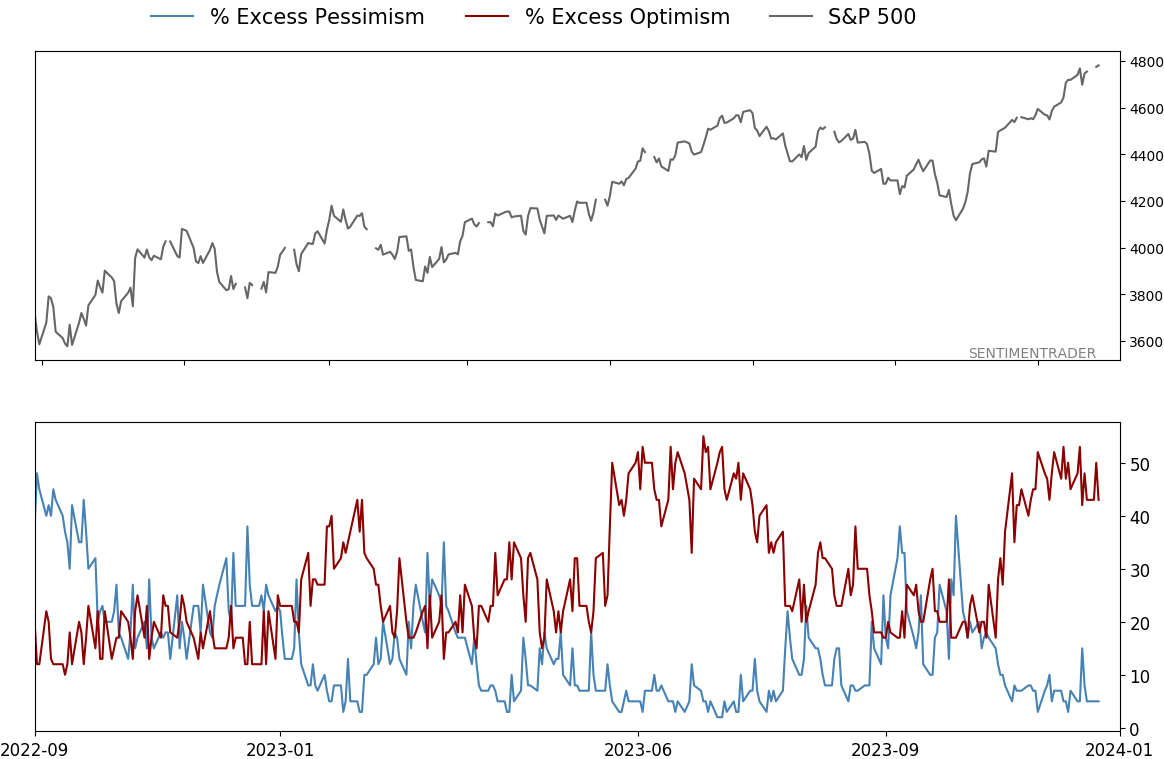
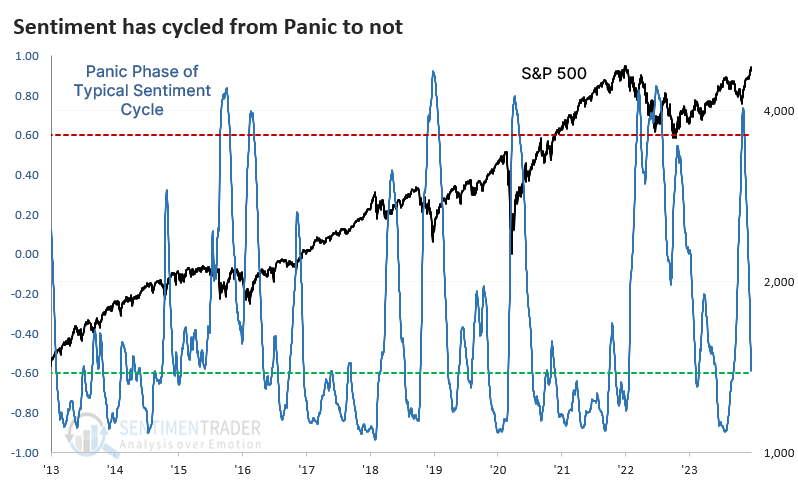
Due to the decline during the late summer months, the Typical Sentiment Cycle suggested that investors were back in the Panic phase of the Cycle. This is determined by comparing the price action of the S&P 500 to the typical Panic phase of past sentiment cycles. By October, this correlation had spiked above +0.6 (out of a scale from -1.0 to +1.0).
It has since eased and fully reversed back to -0.6 in a historically quick fashion.
Contrarians always want to assume that a quick reversal in sentiment is bad. Sometimes it is, but usually it isn't.
Quick retreats in Panic typically preceded more gains
The table below shows every time since 1928 when the Panic phase of the Typical Sentiment Cycle reversed from above +0.6 to below -0.6 within 30 trading days. There weren't too many examples of this happening, and a couple of them led to modest declines in the S&P 500 over the next year. However, the average risk was low, and the reward was high.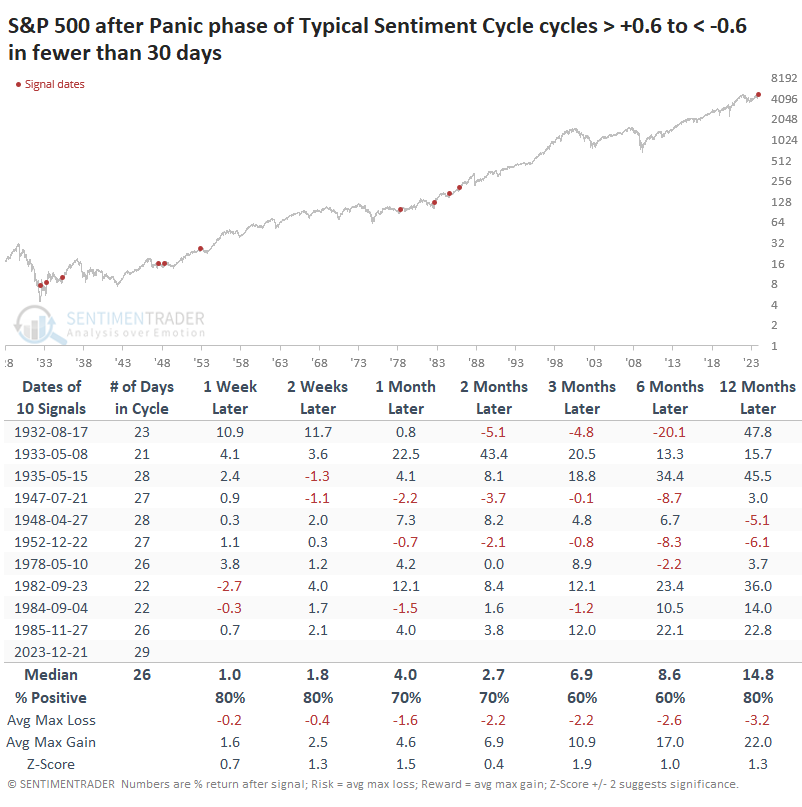
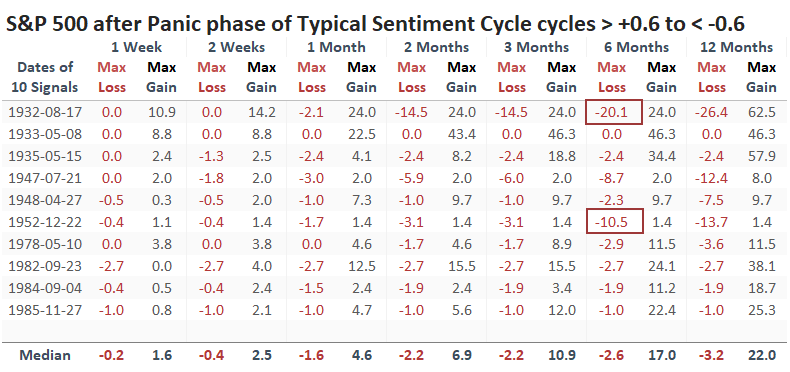
Within the next six months, two drawdowns were worse than -10%. One of those was just barely, and the other one, in 1932, occurred during a period of extreme volatility, and the maximum gains actually exceeded the maximum losses.
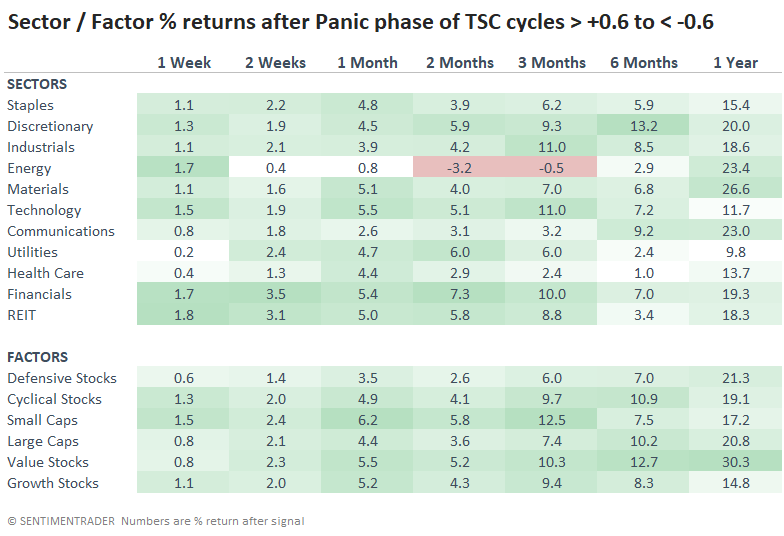
After these bouts of Panic had fully reversed, Value stocks showed the best average returns over the next year, at more than +30%.
What the research tells us...
There are innumerable ways to measure investor sentiment. Most contain at least some measure of price action, as sentiment and price movement are two sides of the same coin. By monitoring how prices behave and comparing that to past episodes of an idealized sentiment cycle, we can often glean insight into whether the Cycle has likely neared a turning point.
Currently, these correlations do not indicate an extreme in any phase of the Cycle. The most notable is Panic, which has fully reversed its extreme from October. After similar cycles in this phase, stocks tended to keep rising, with low average drawdowns.
Indicators at Extremes
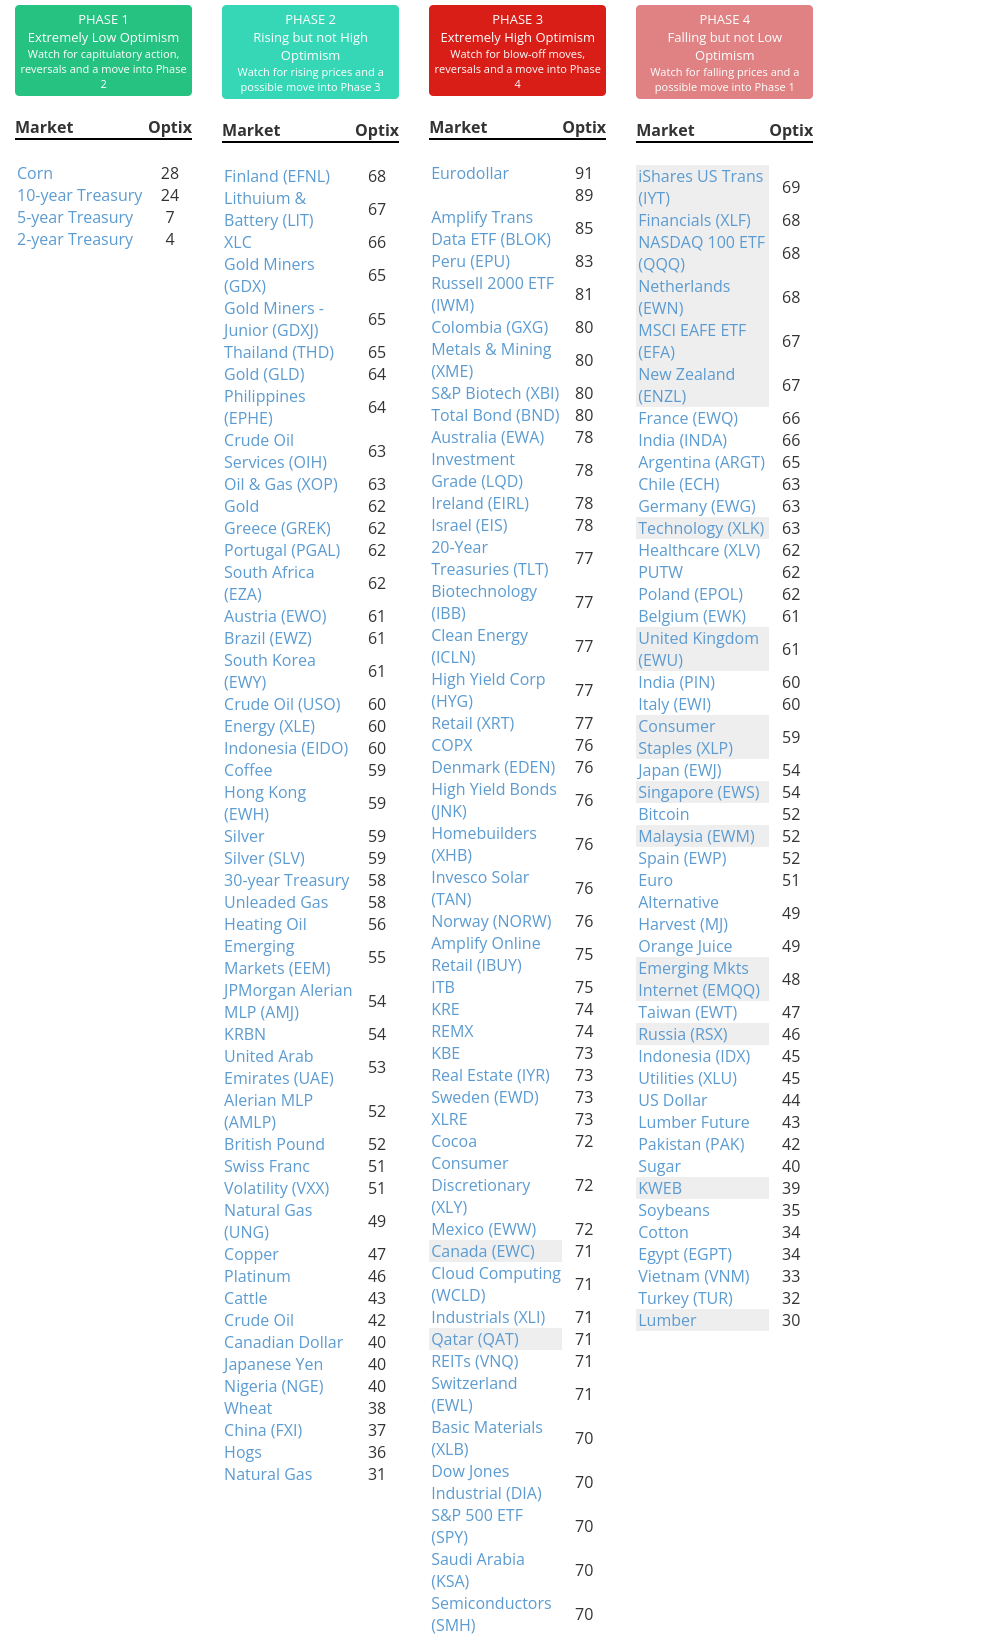
Phase Table
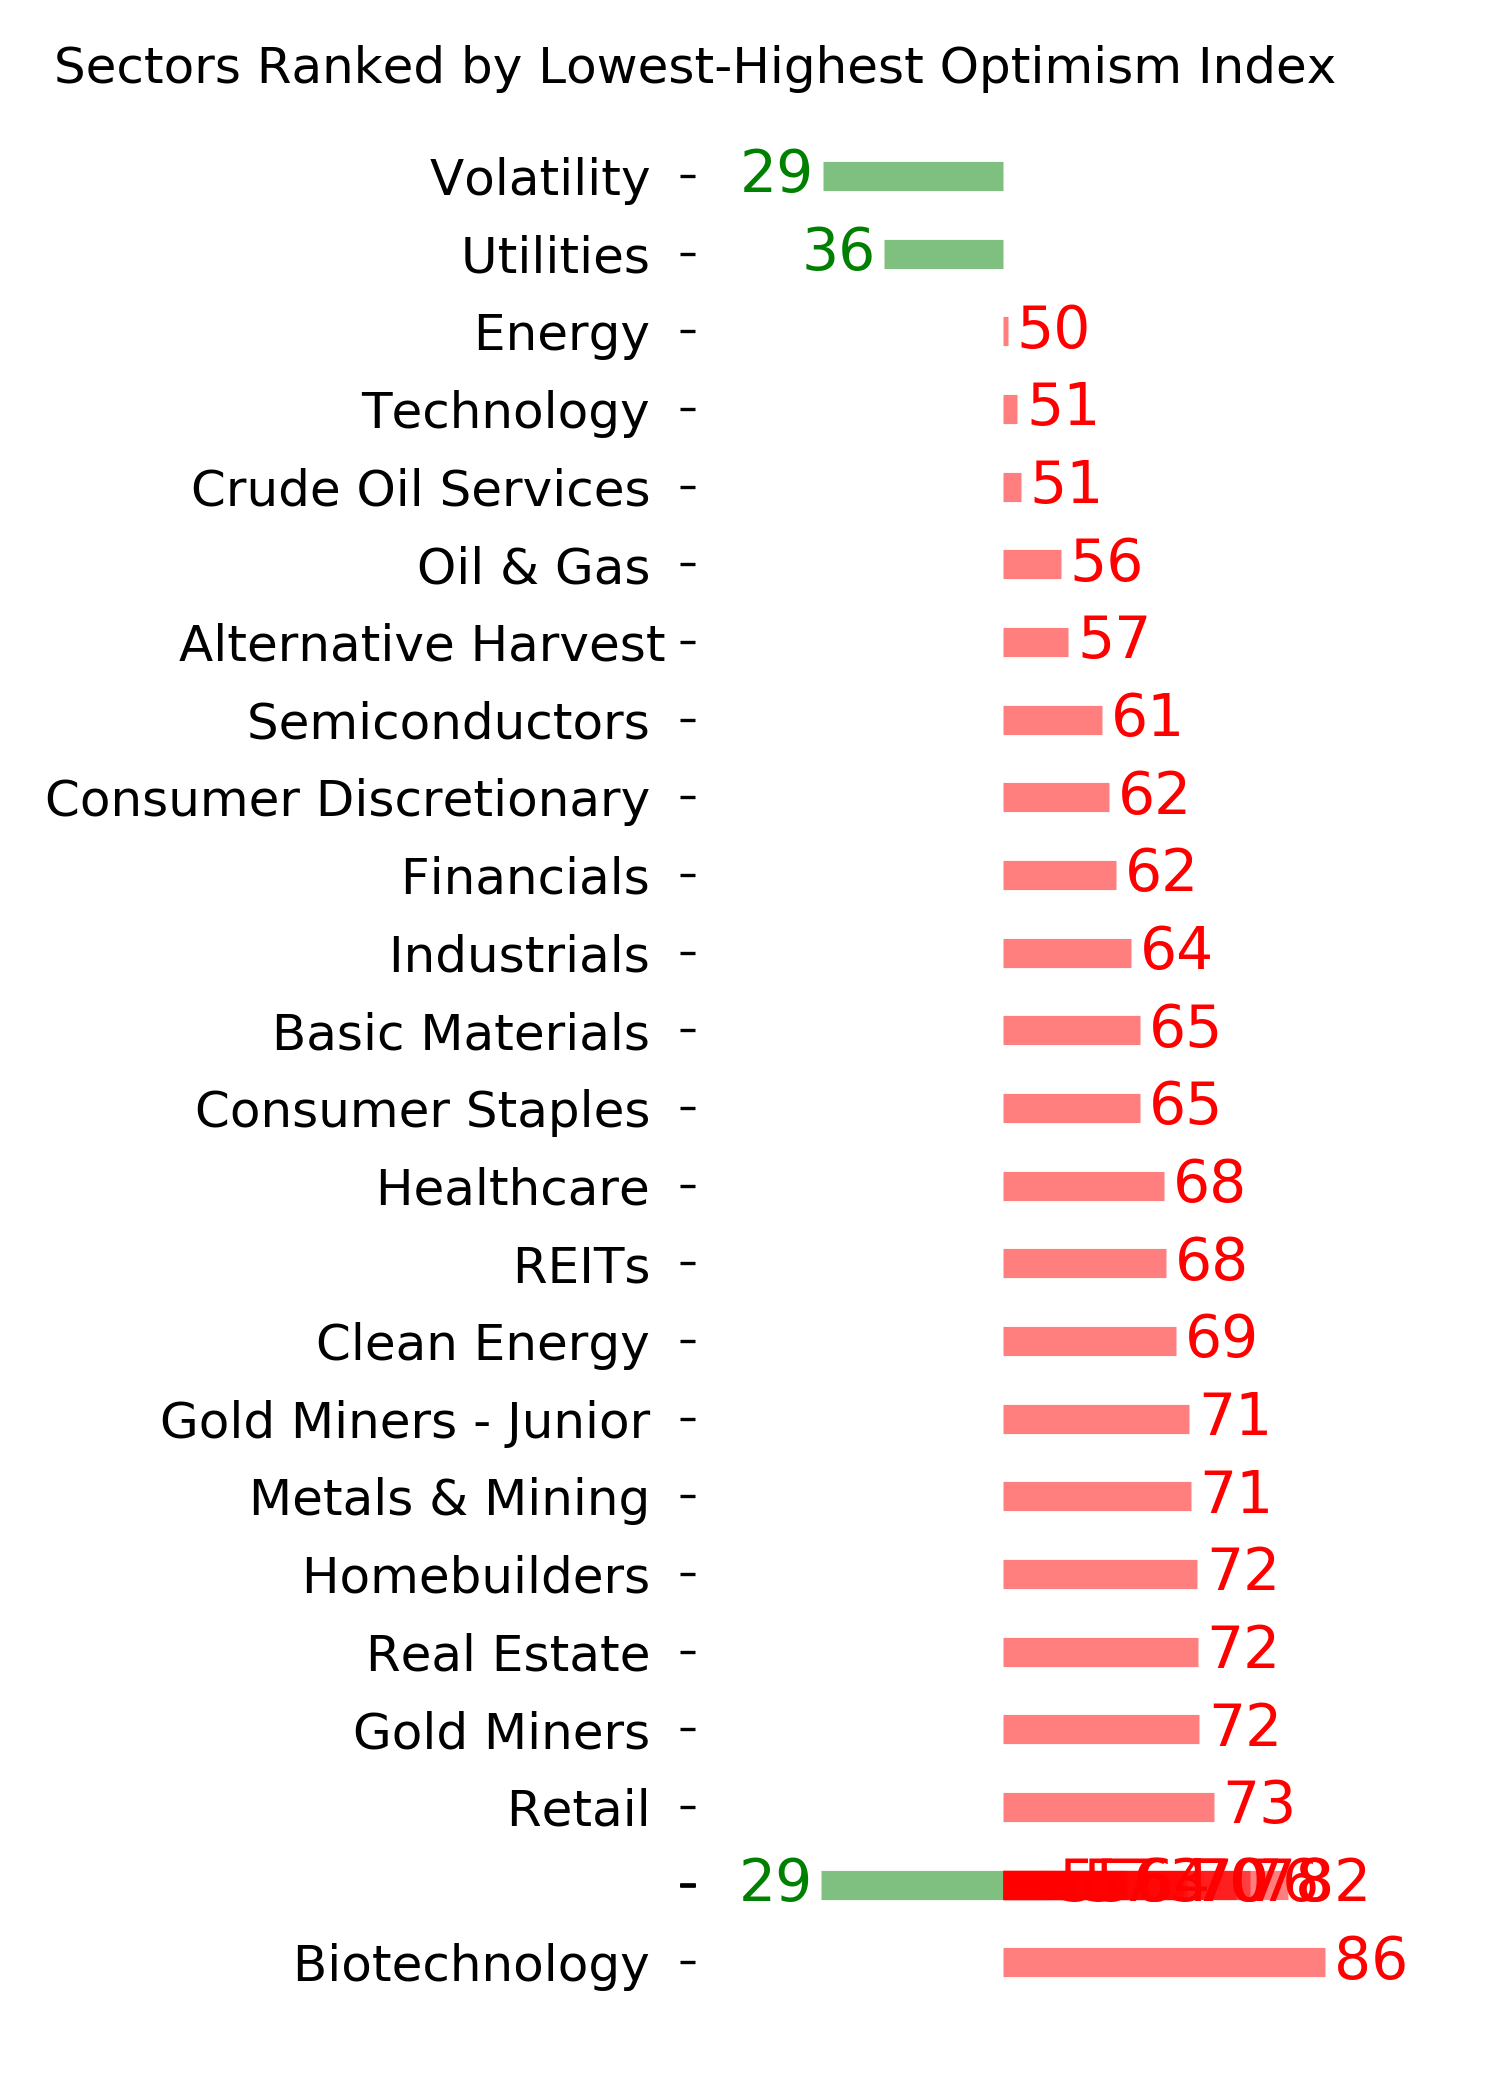
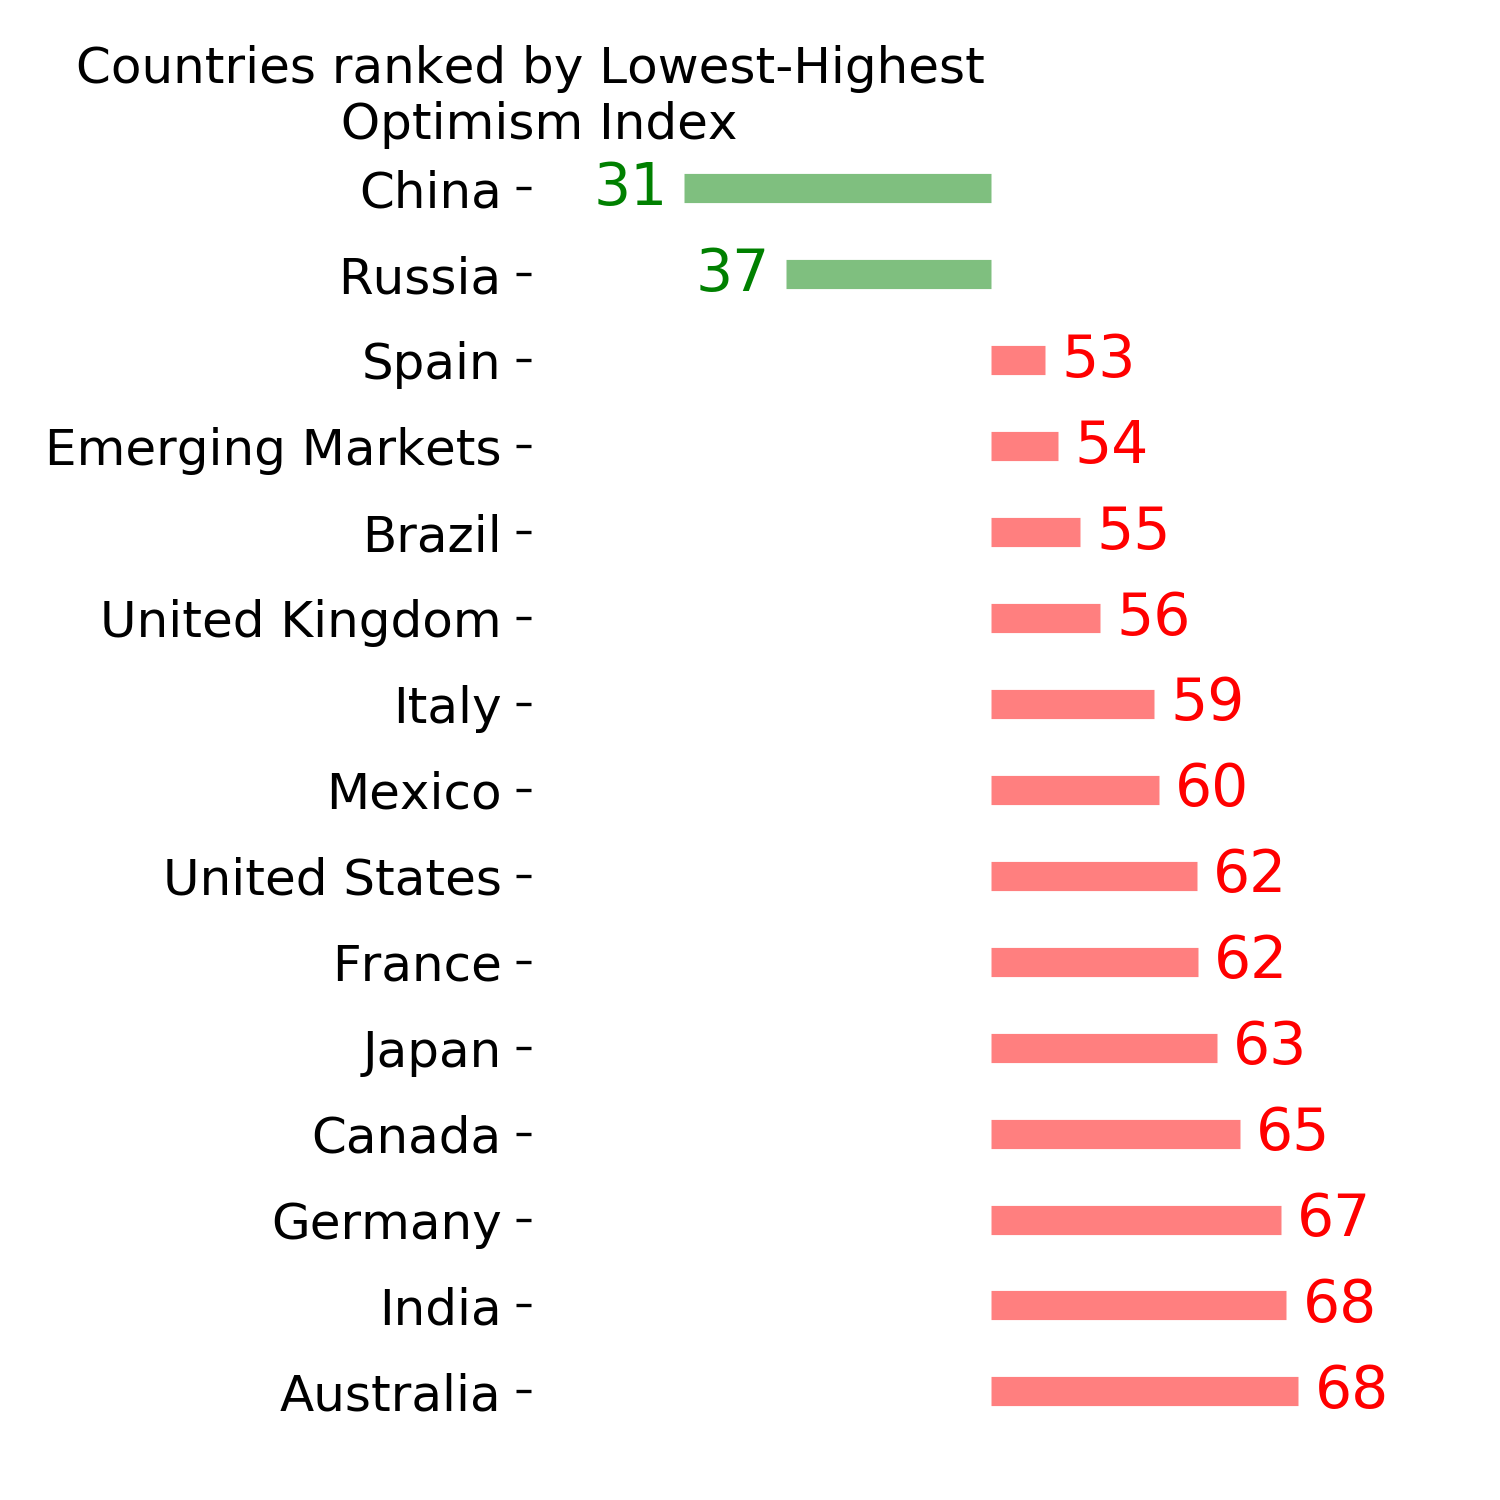
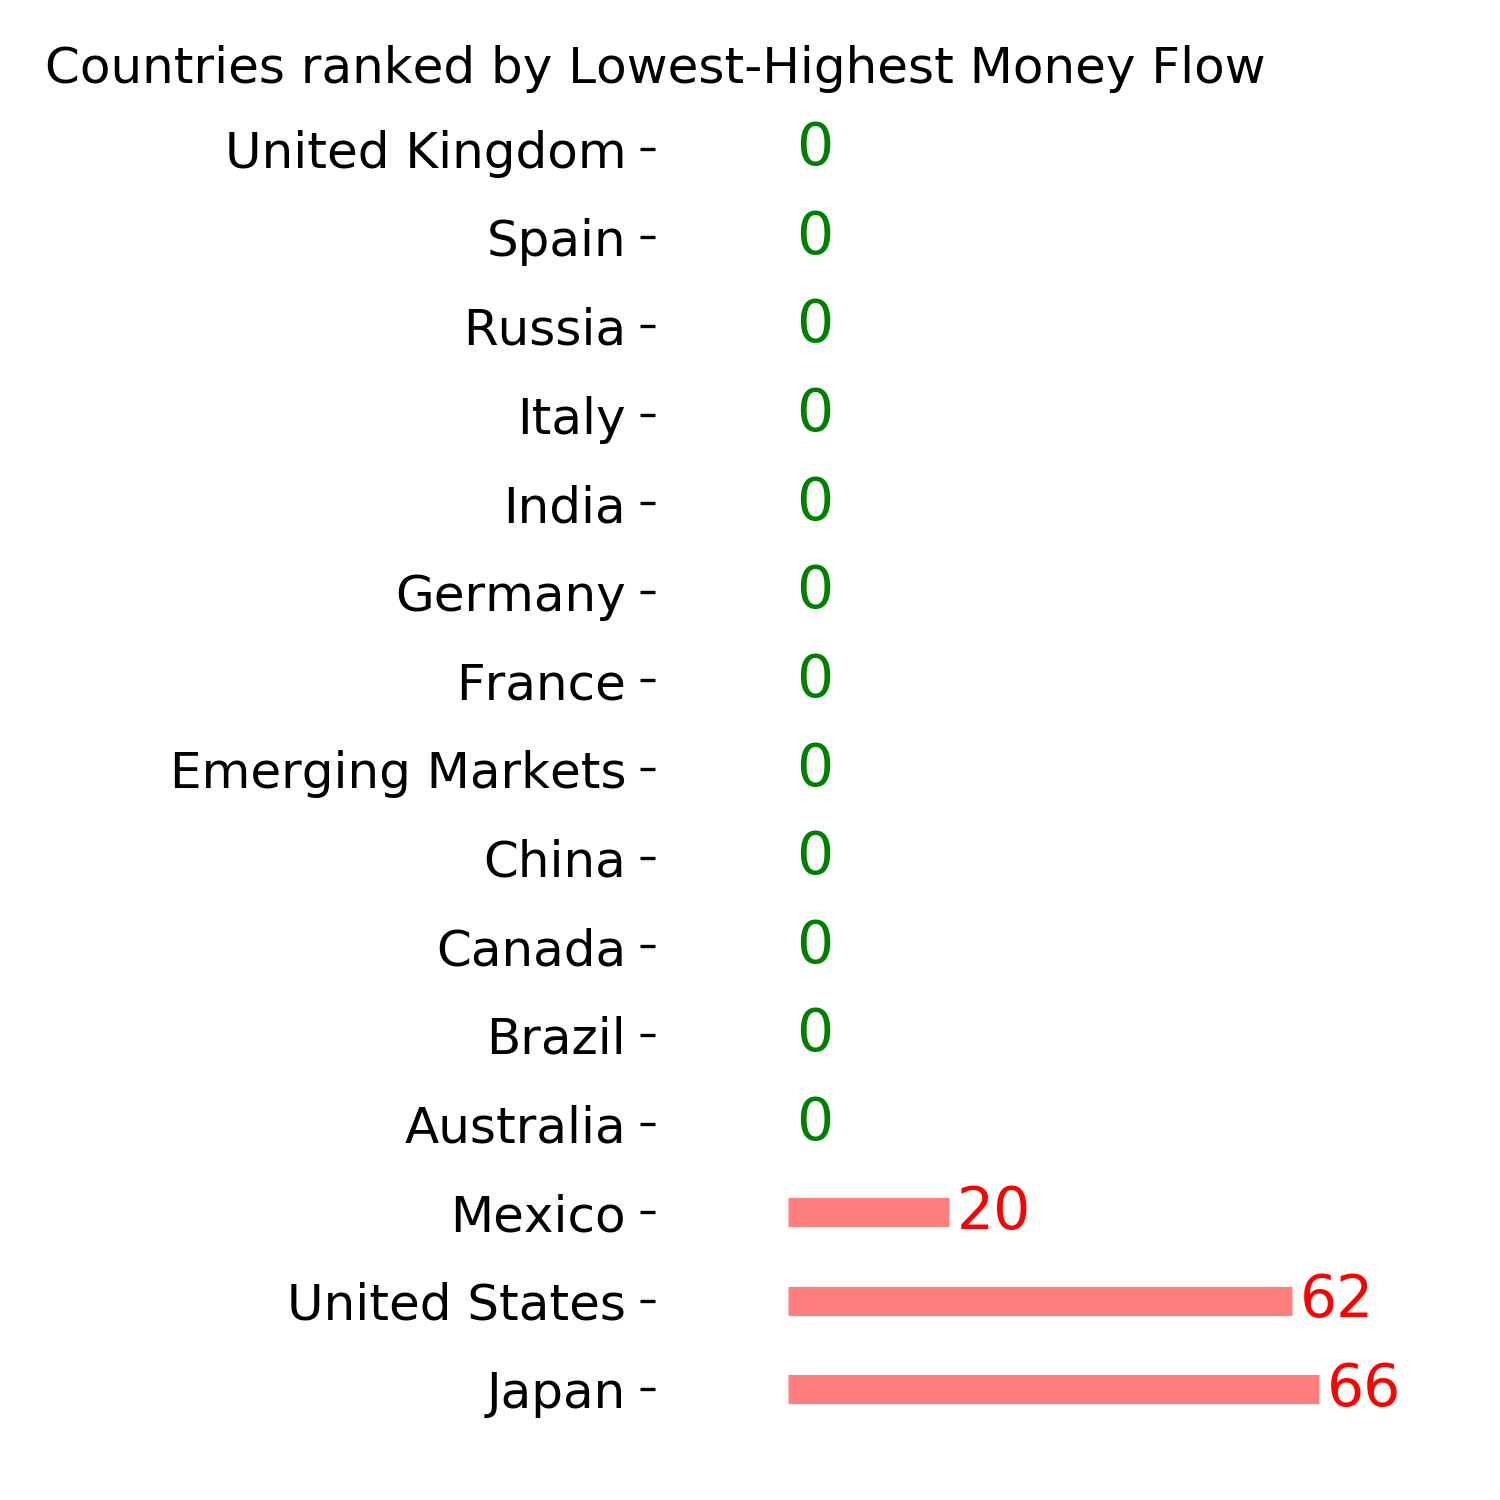
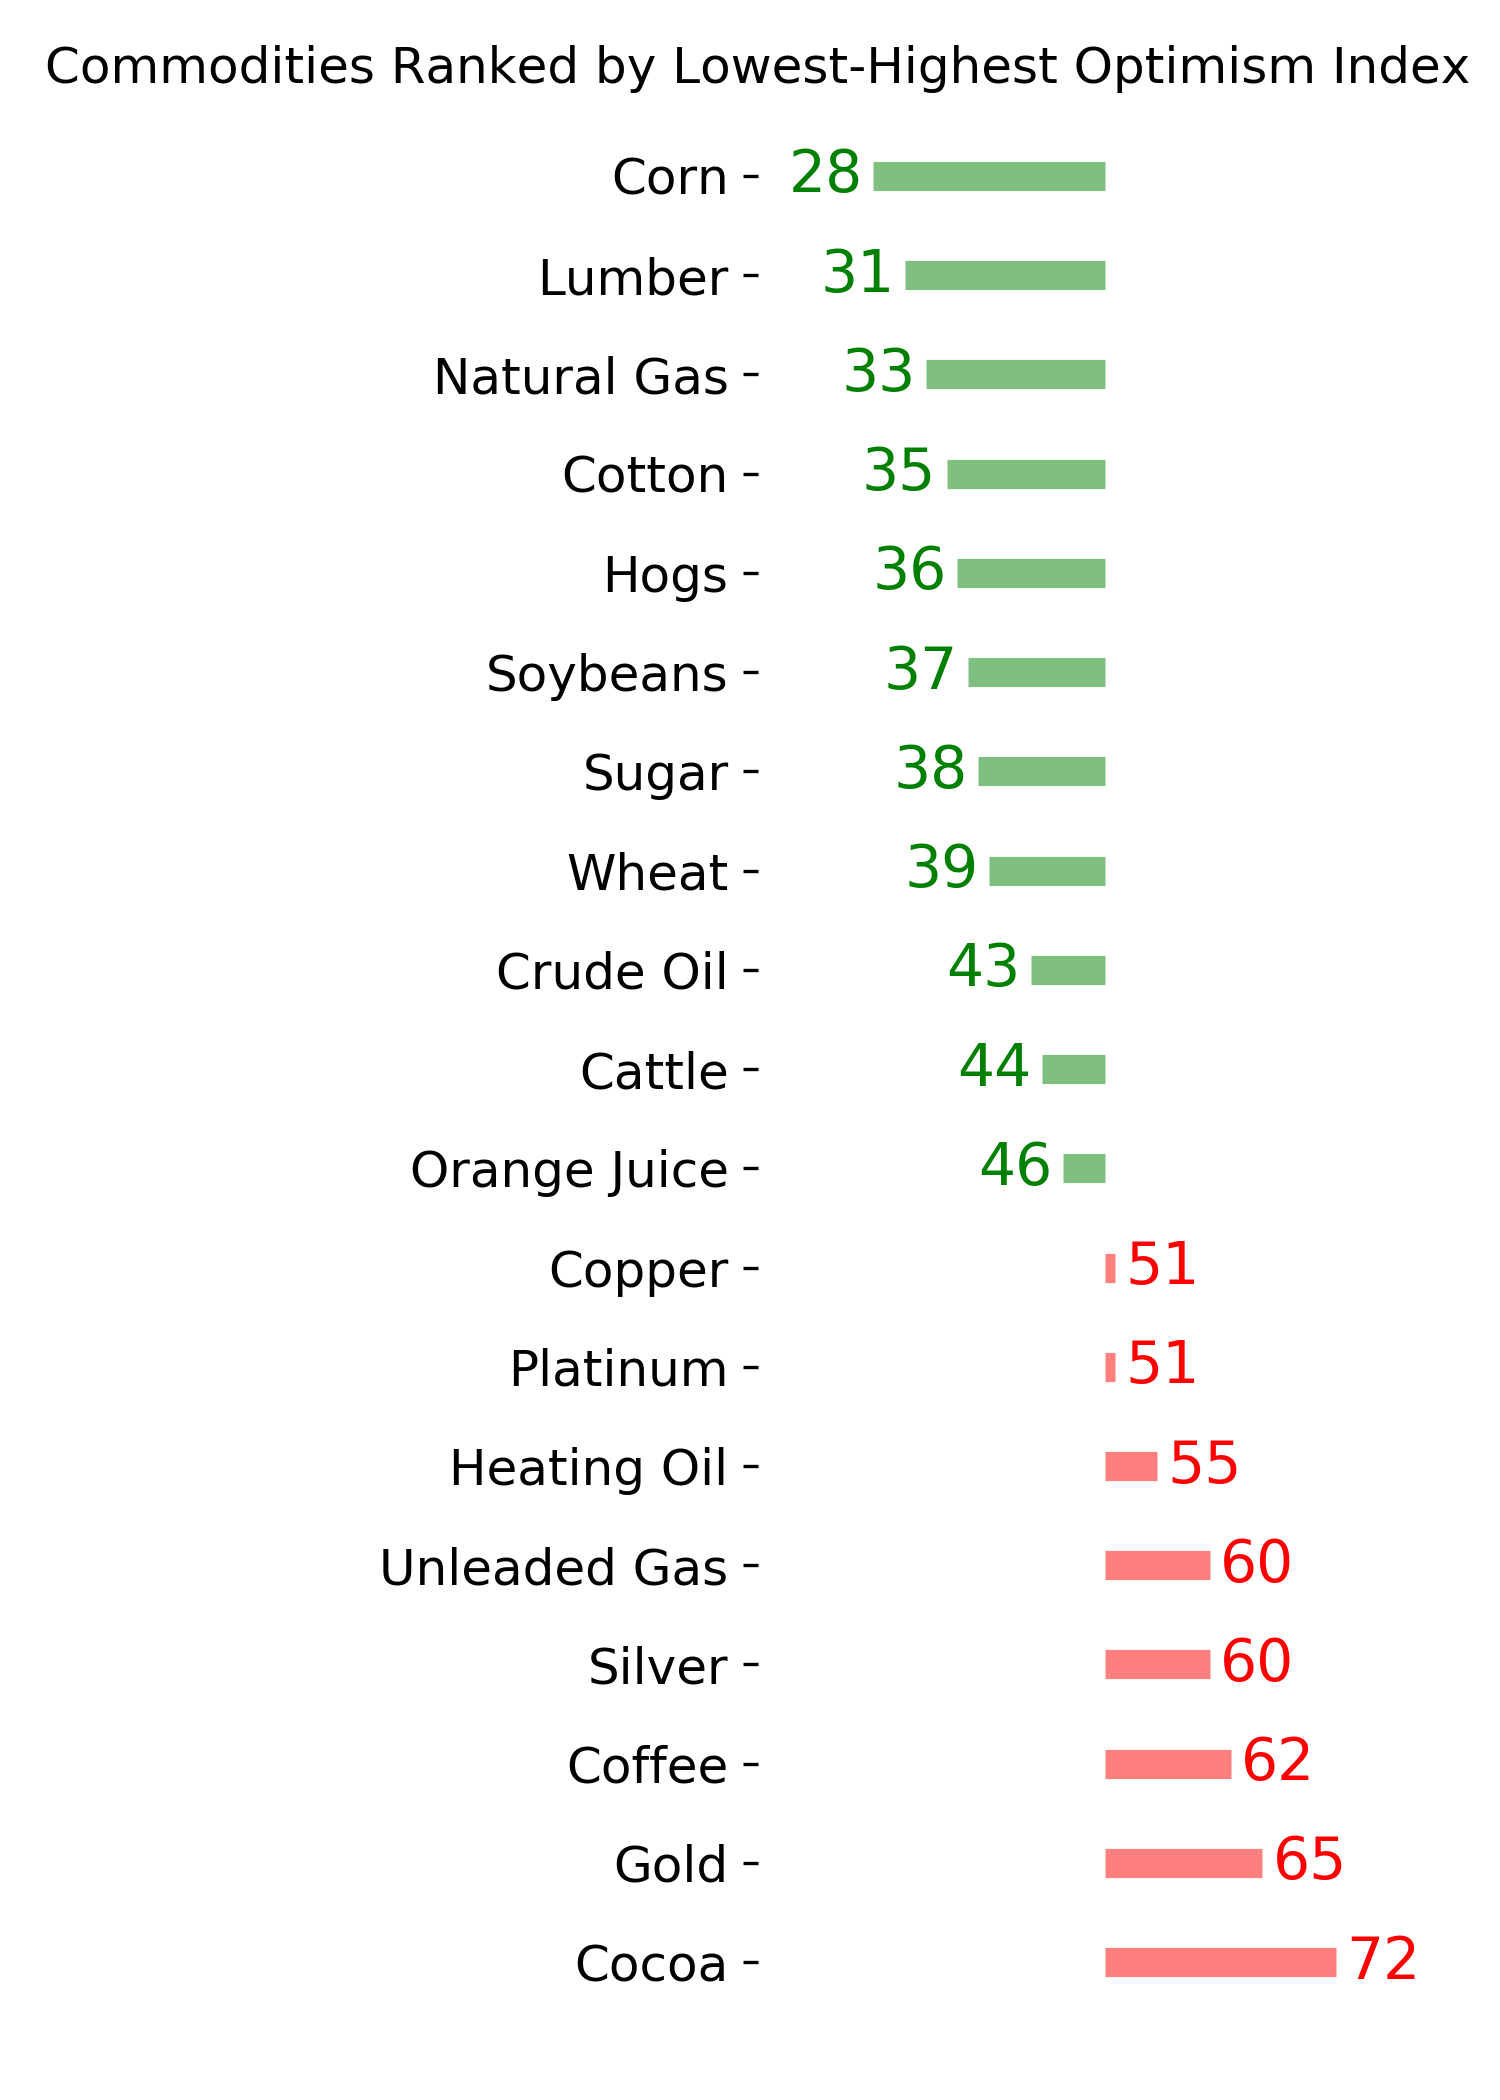
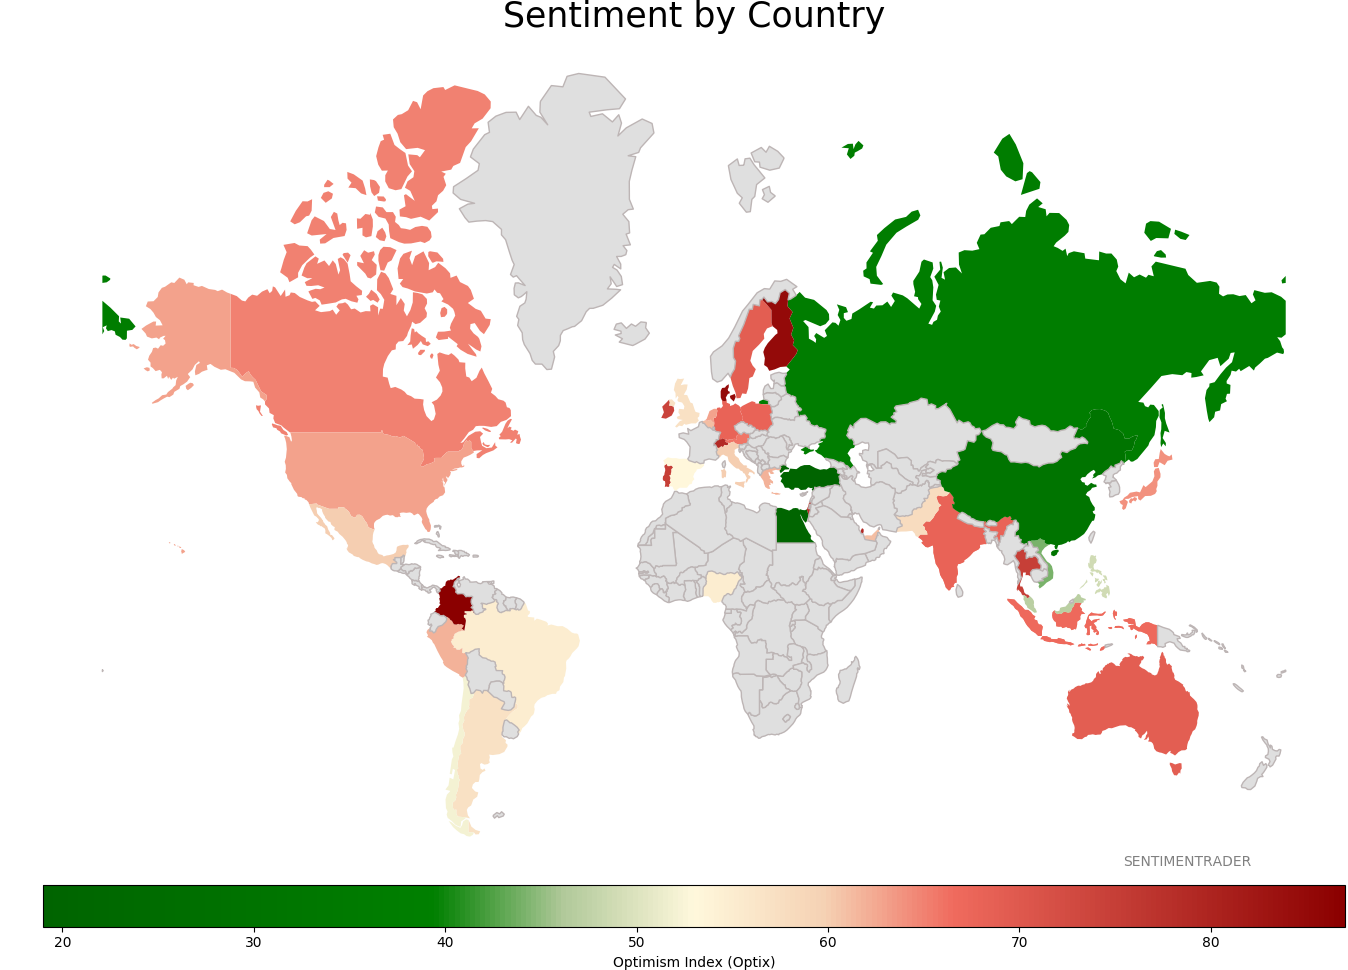
Ranks
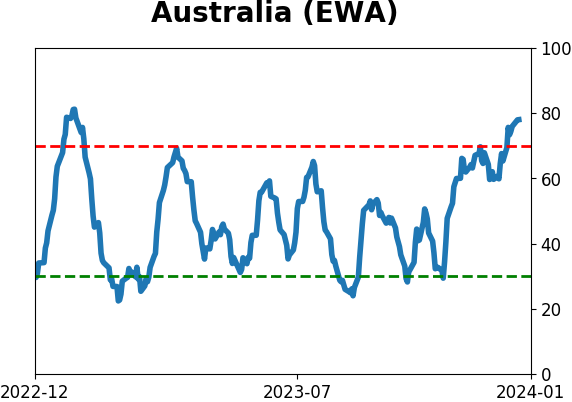
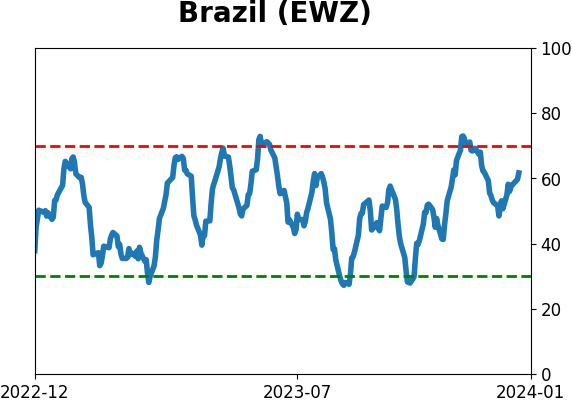
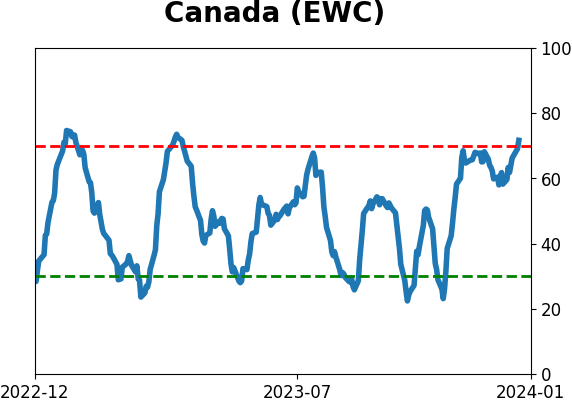
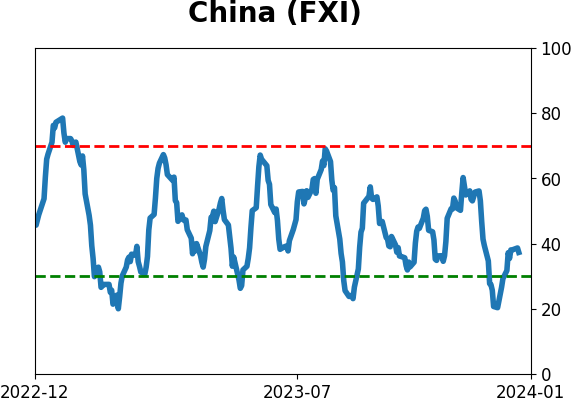
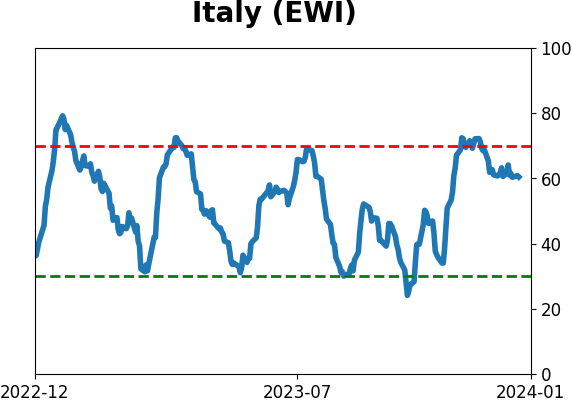
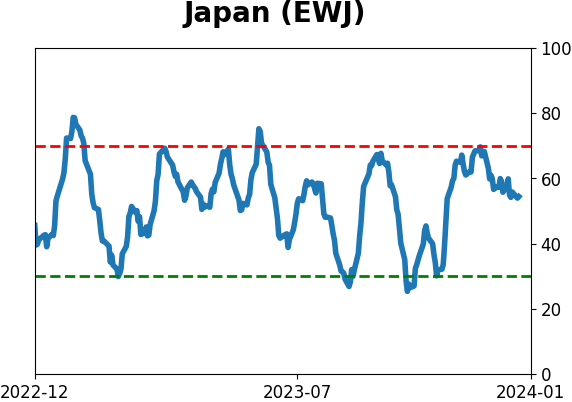
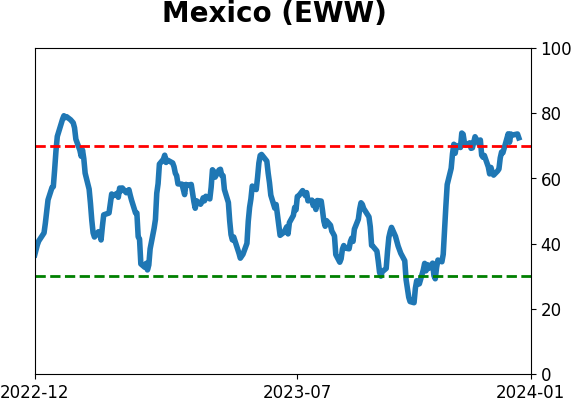
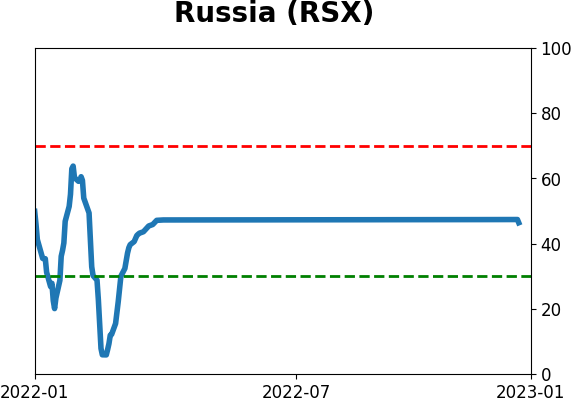
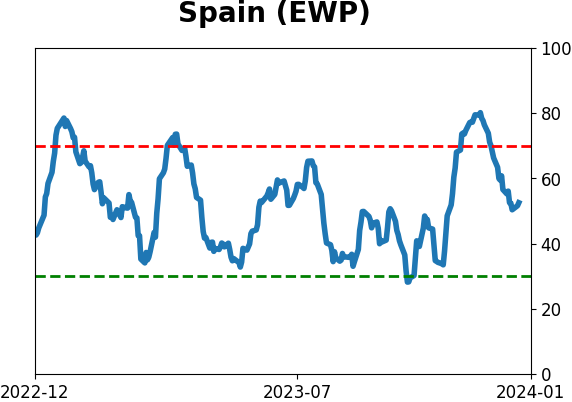
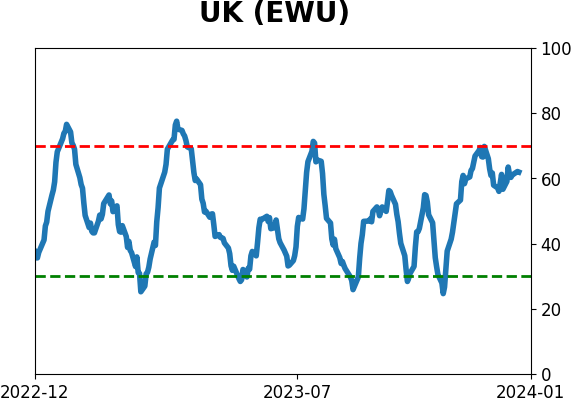
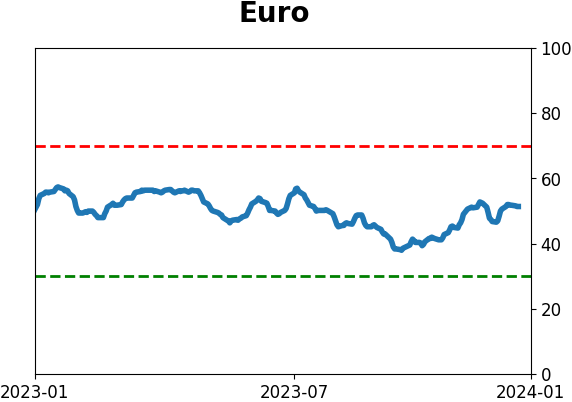
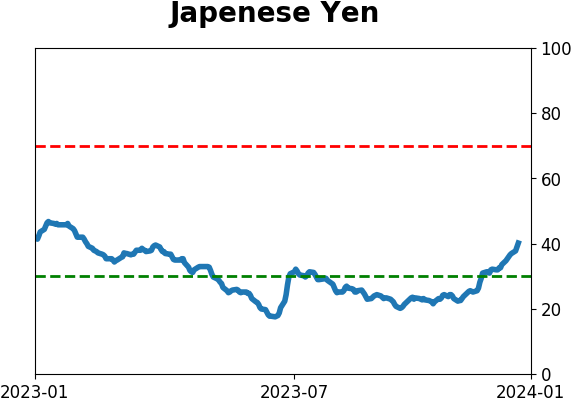
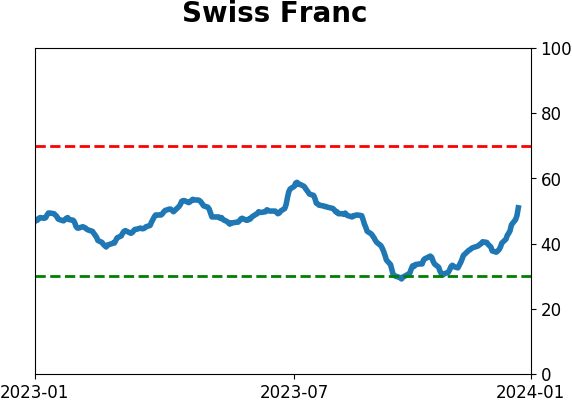
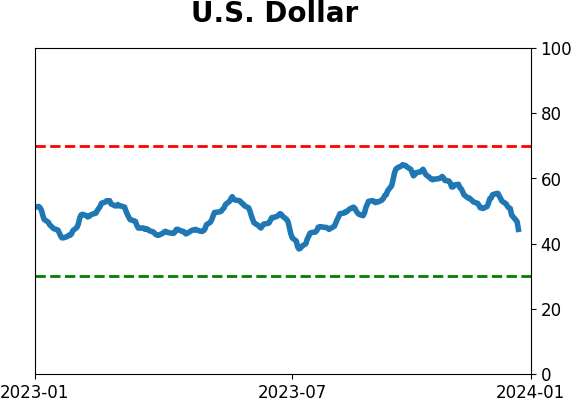
Sentiment Around The World
Optimism Index Thumbnails
|
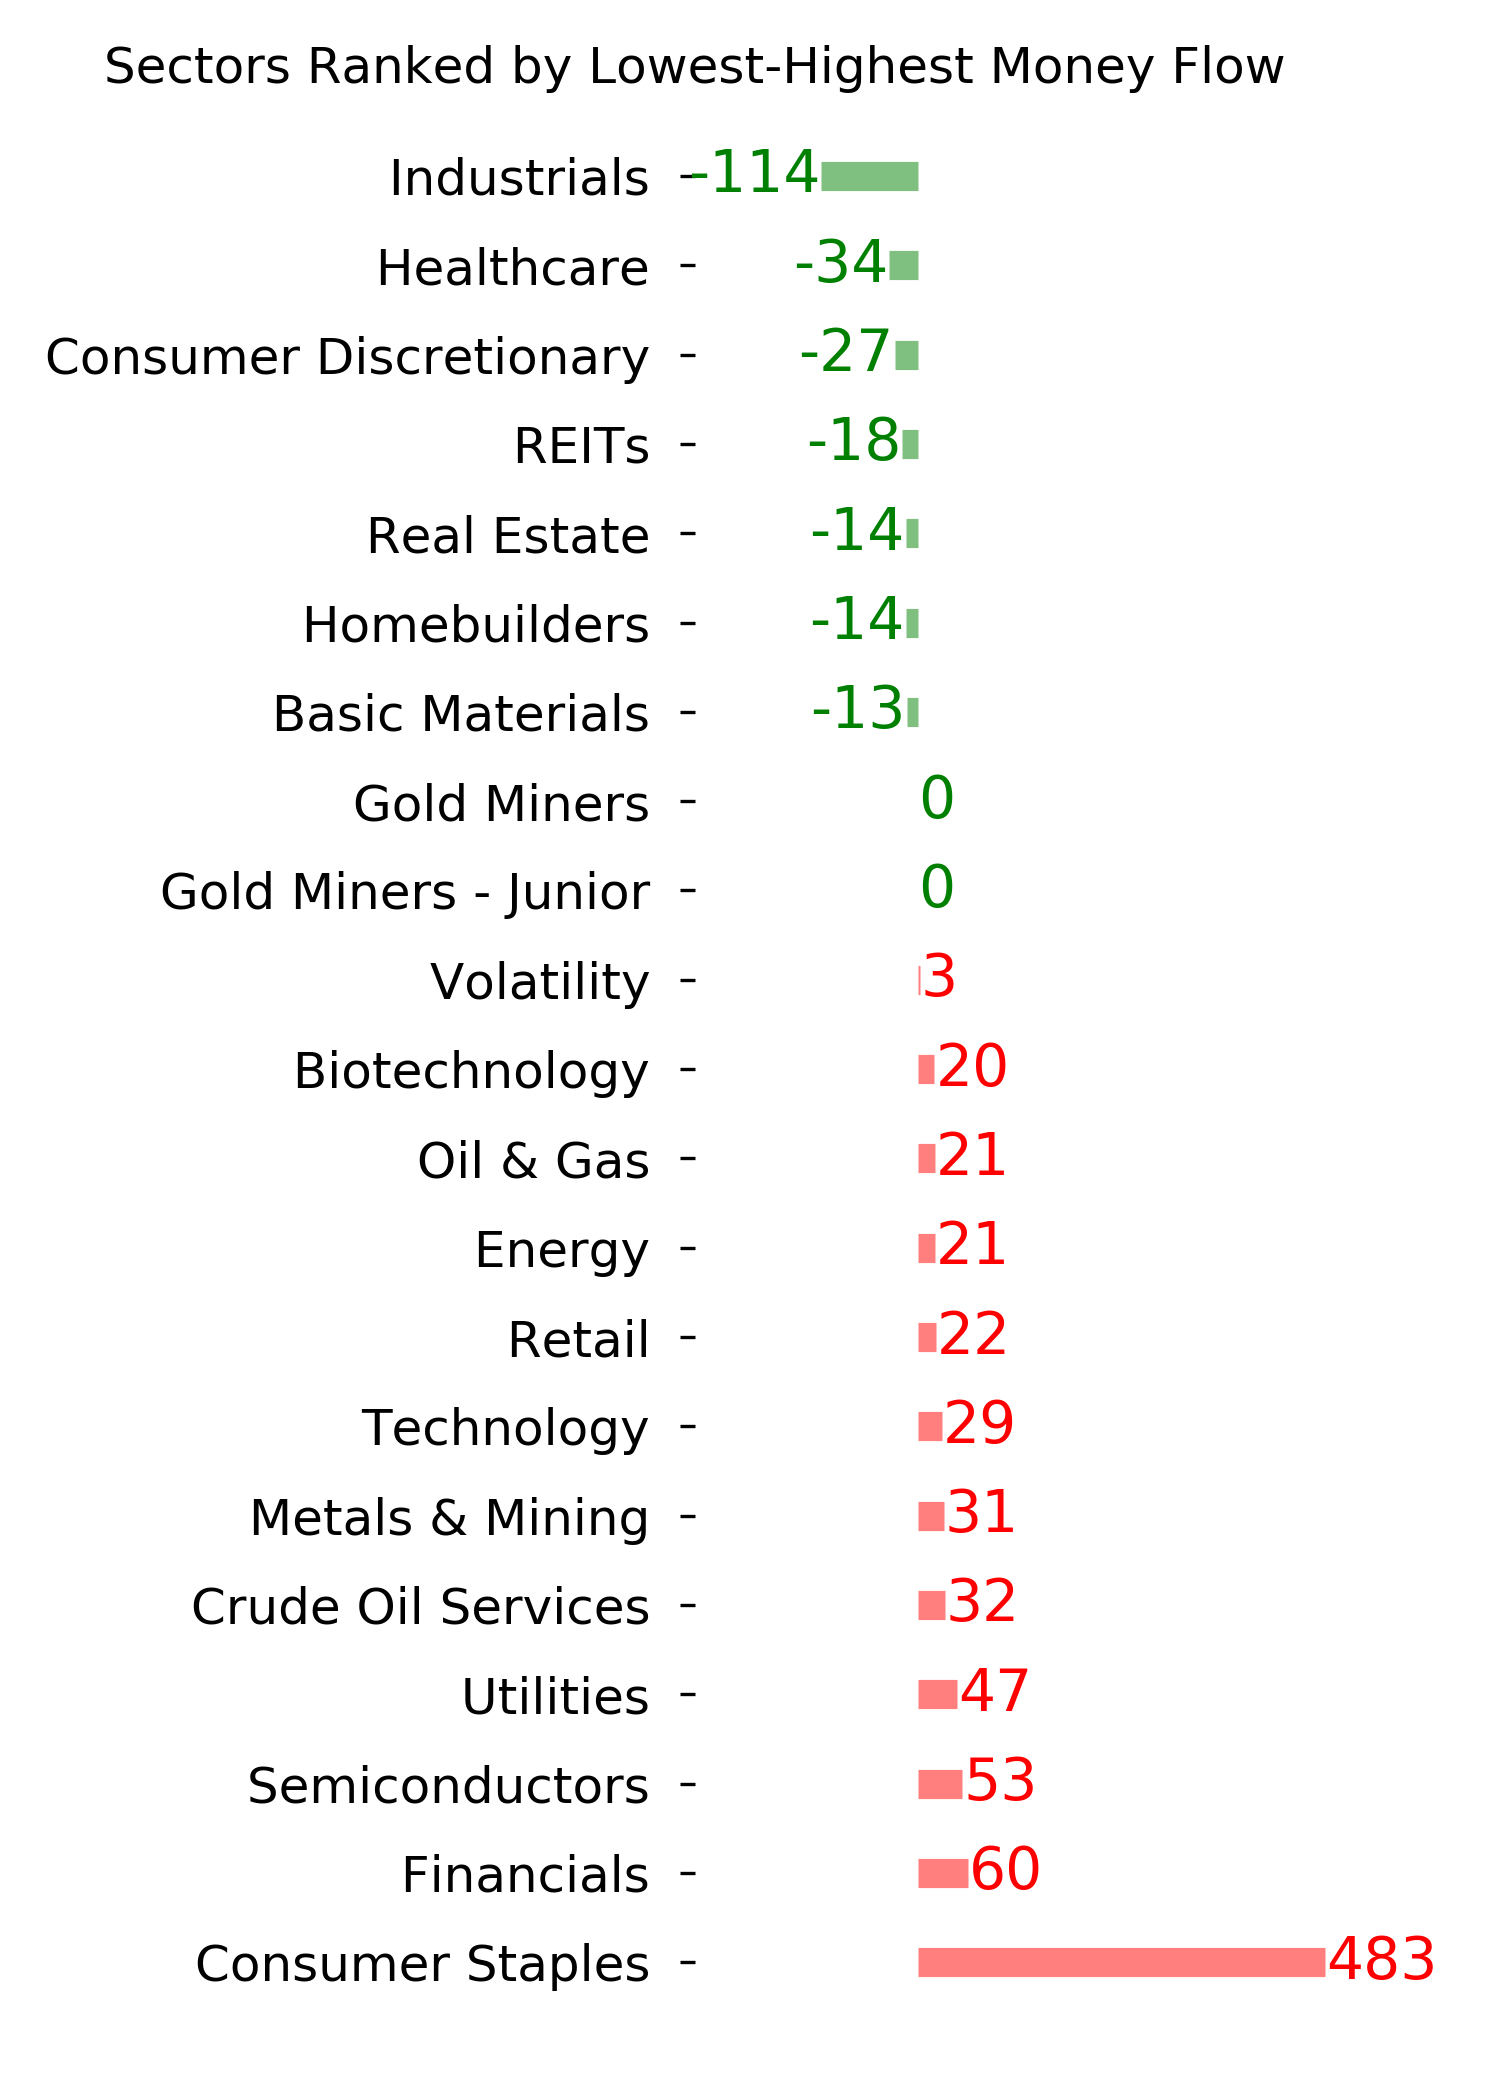
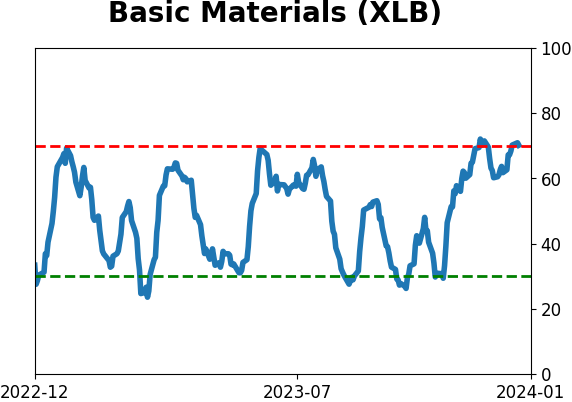
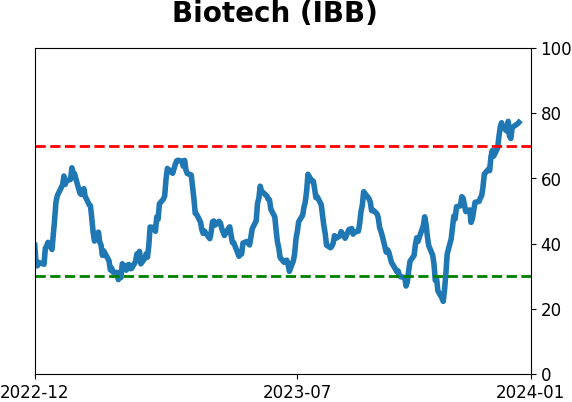
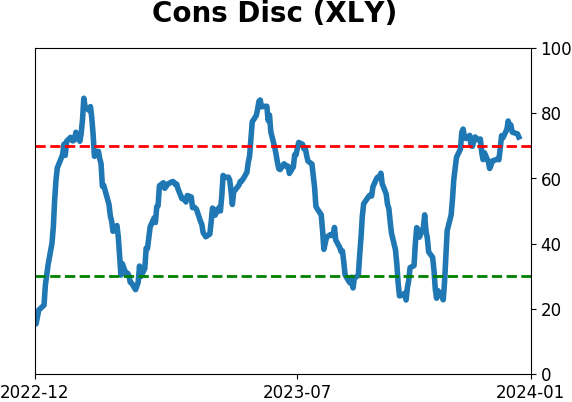
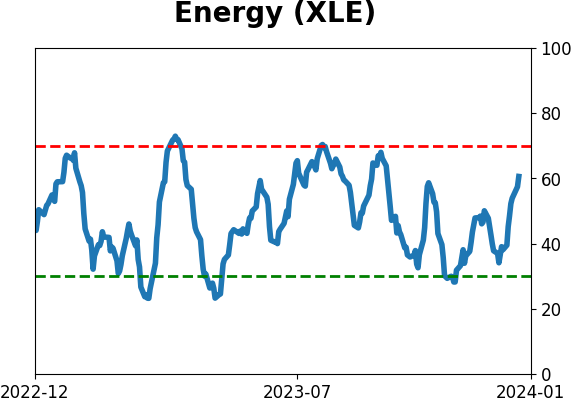
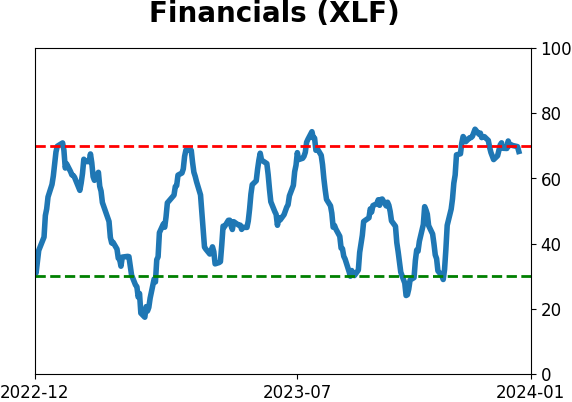
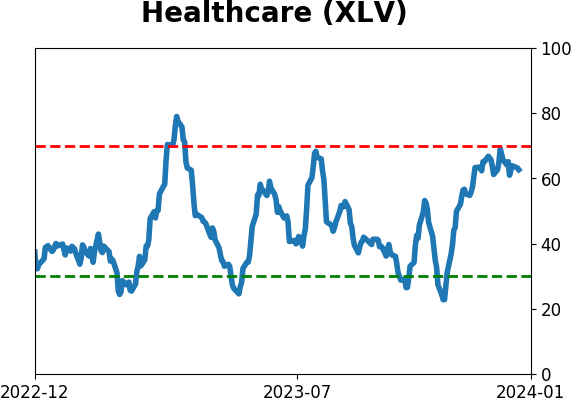
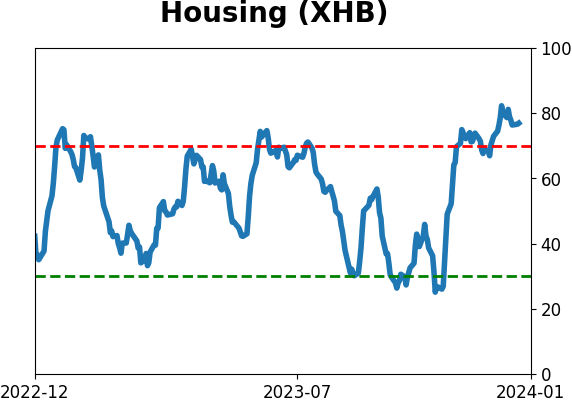
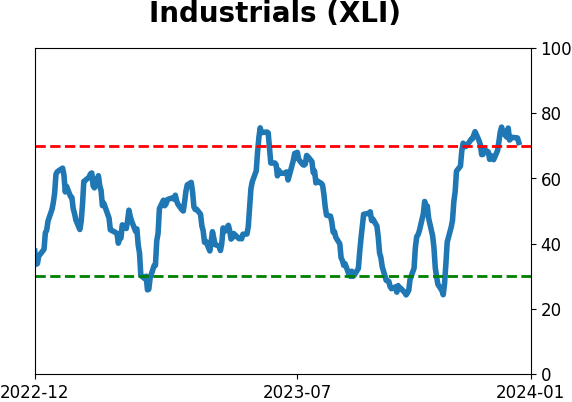
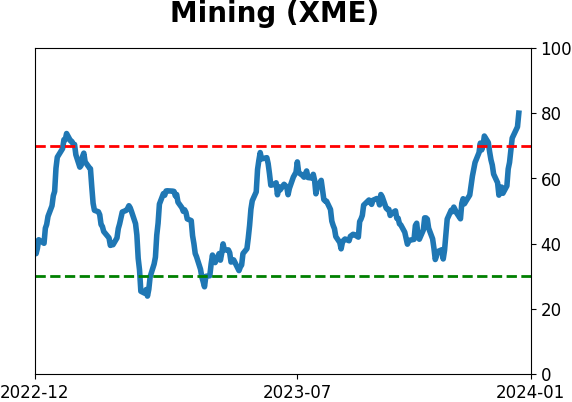
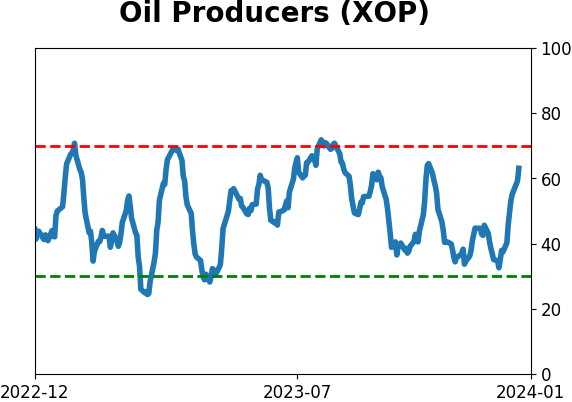
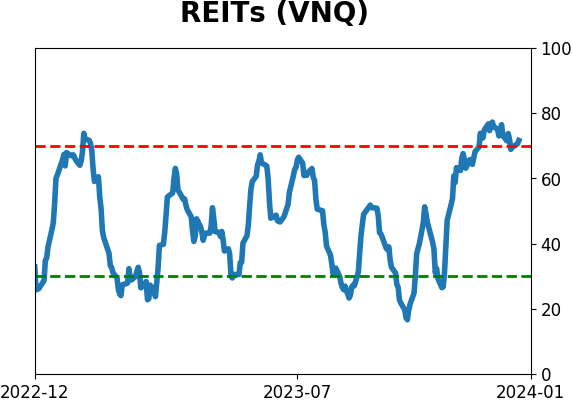
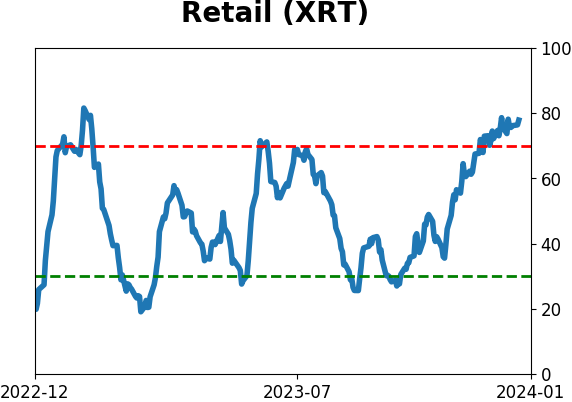
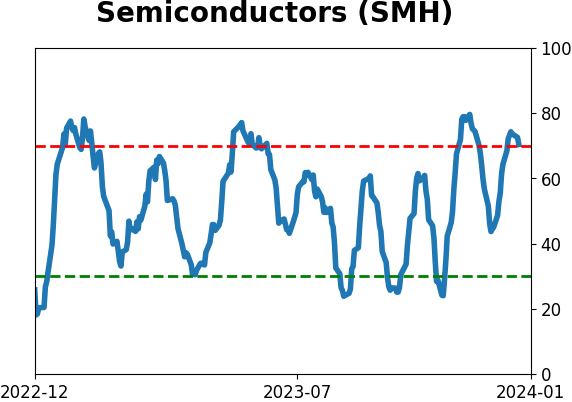
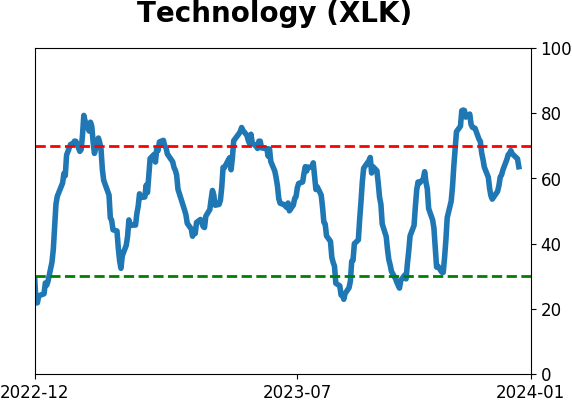
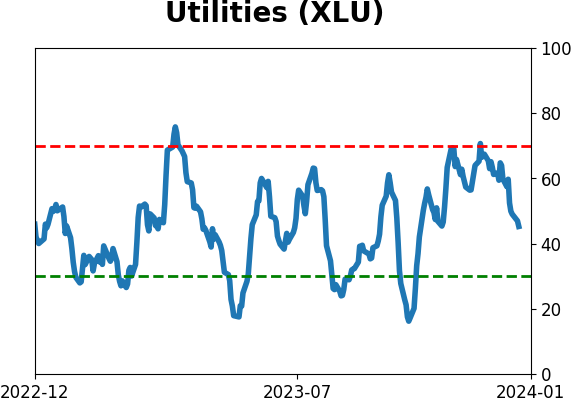
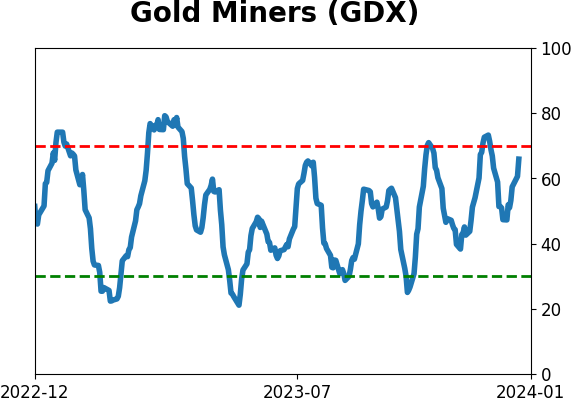
Sector ETF's - 10-Day Moving Average
|
|
|
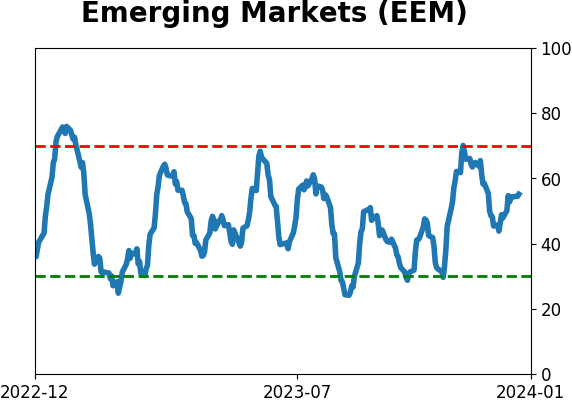
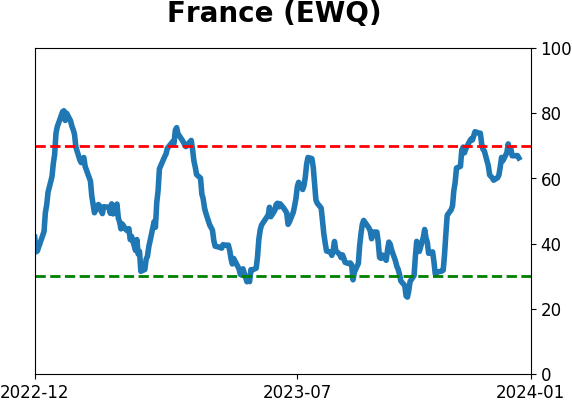
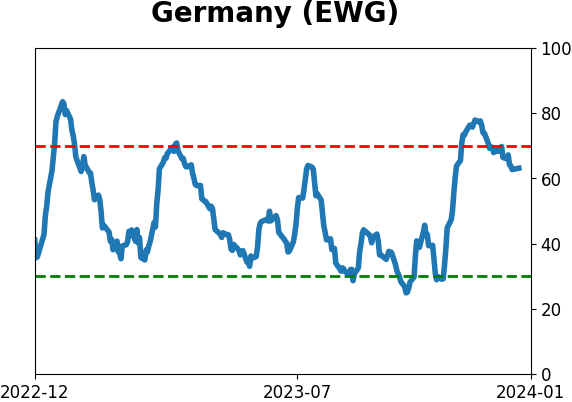
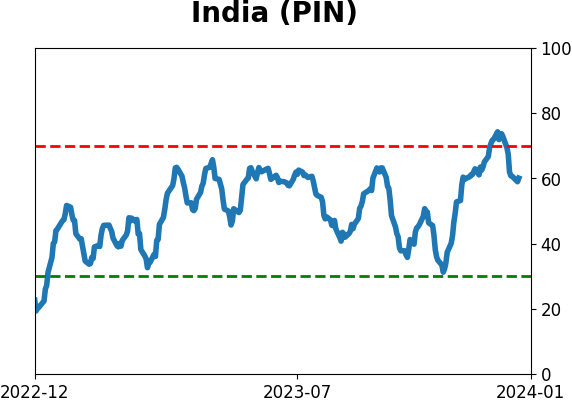
Country ETF's - 10-Day Moving Average
|
|
|
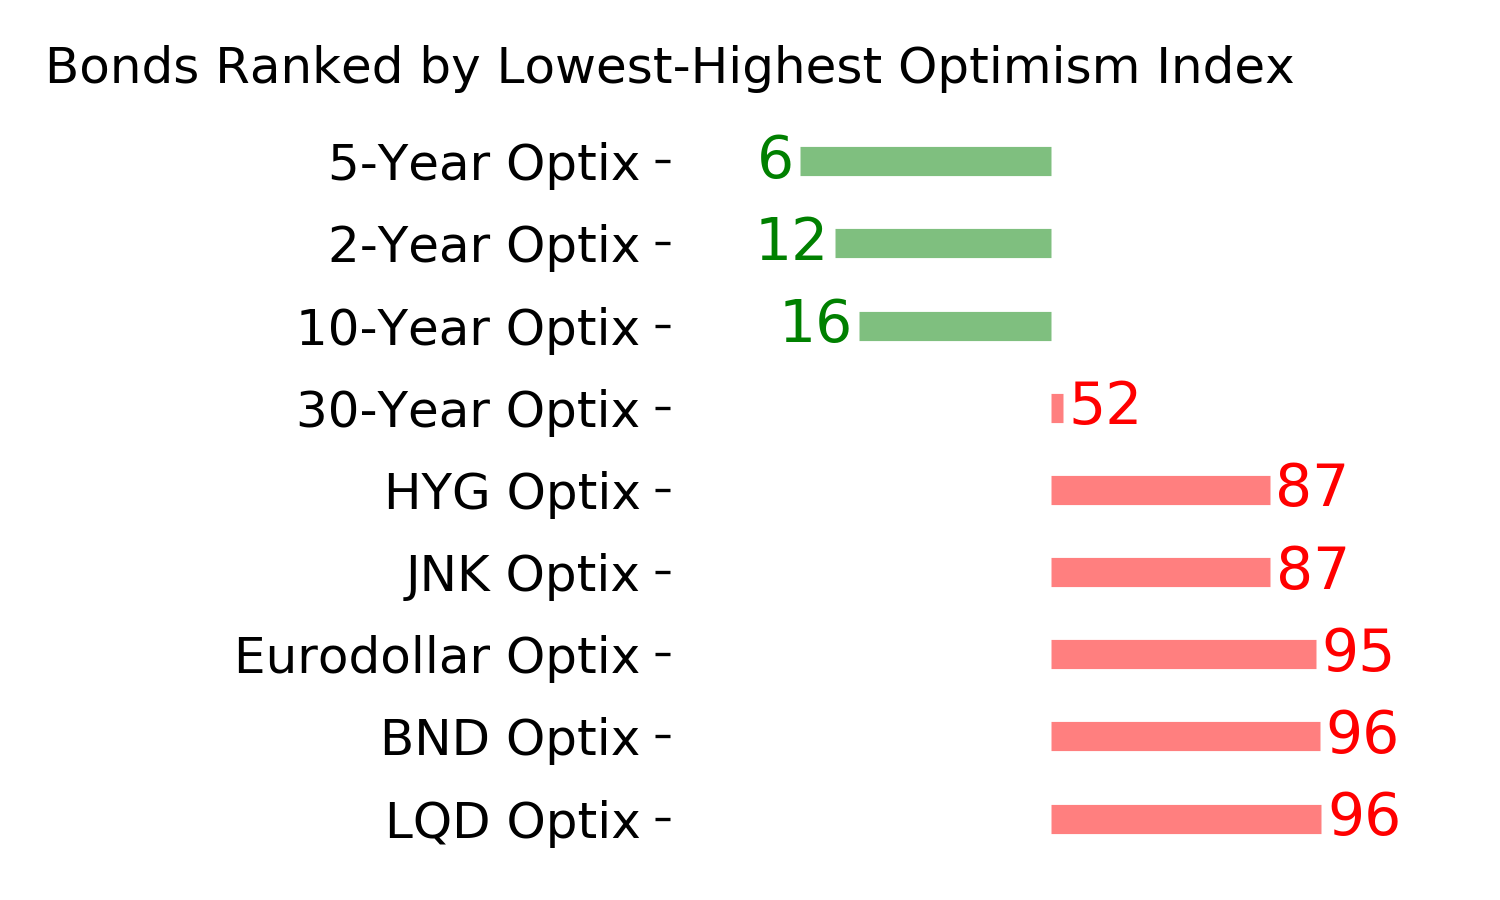
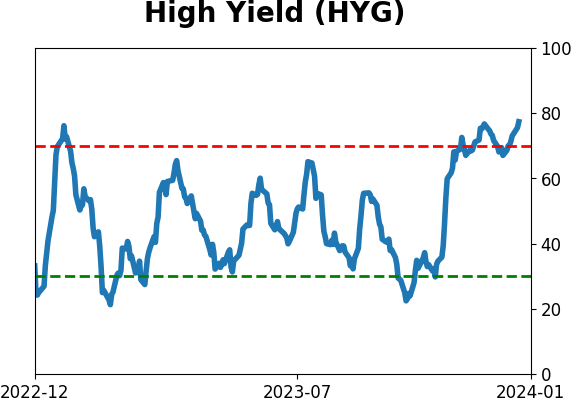
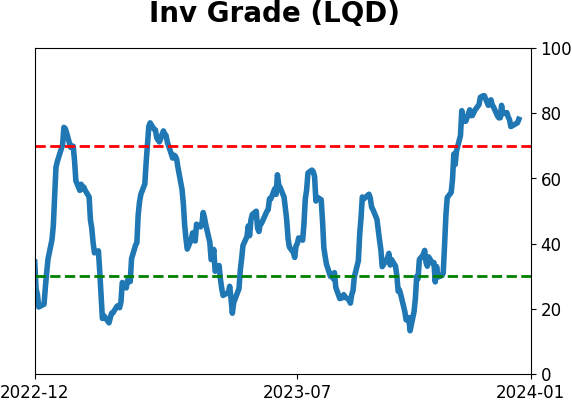
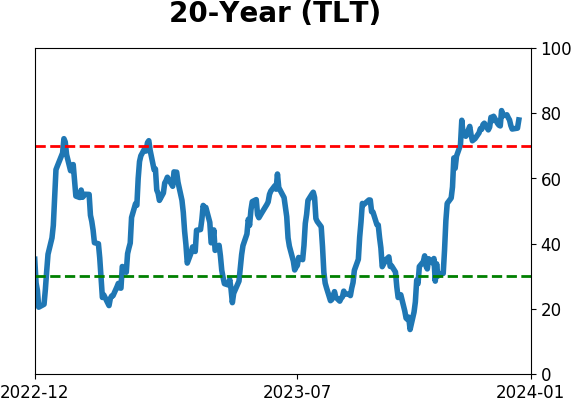
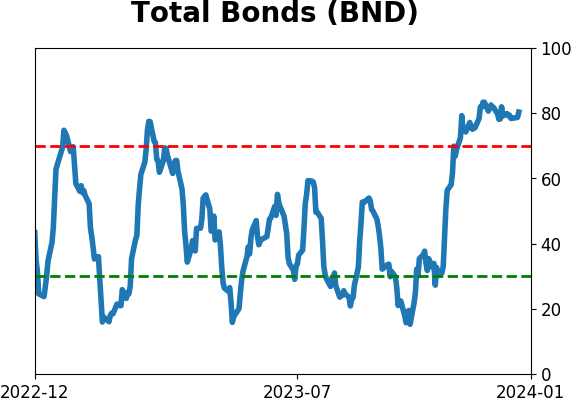
Bond ETF's - 10-Day Moving Average
|
|
|
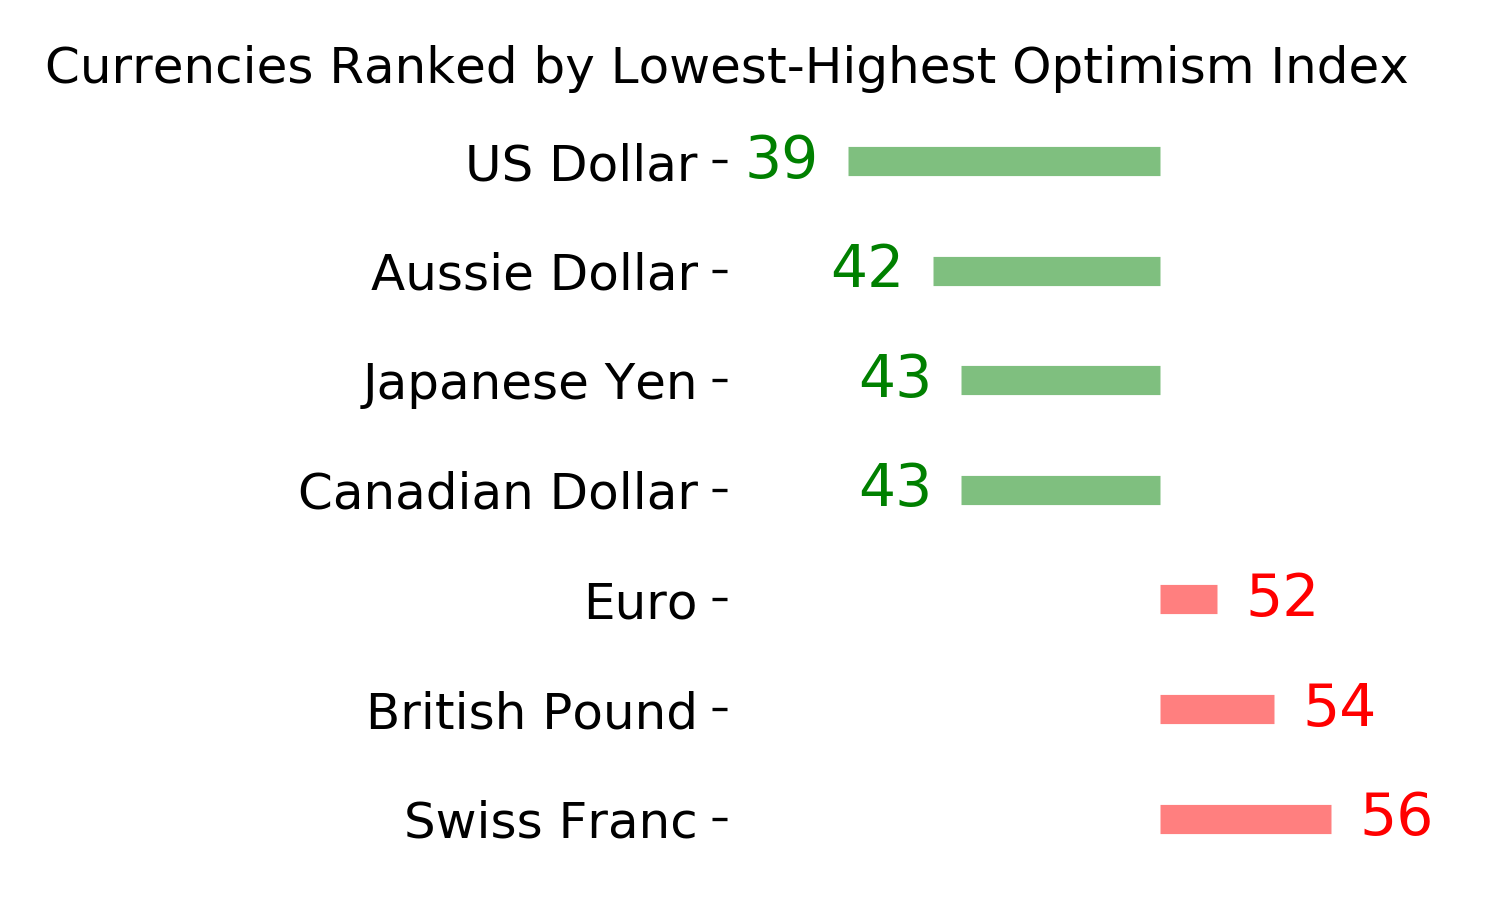
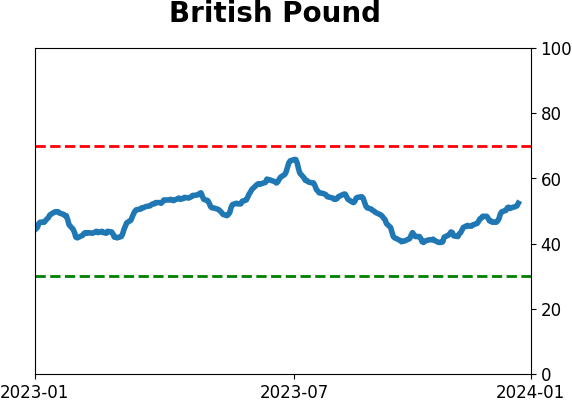
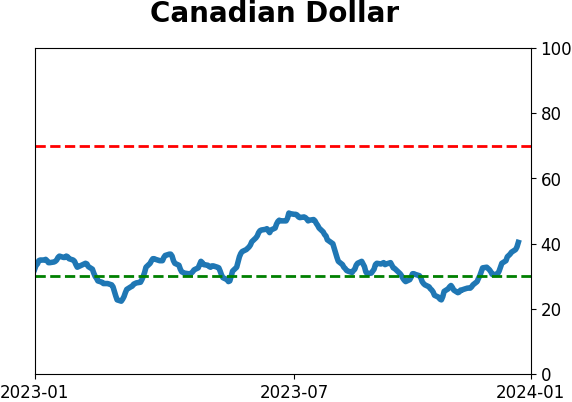
Currency ETF's - 5-Day Moving Average
|
|
|
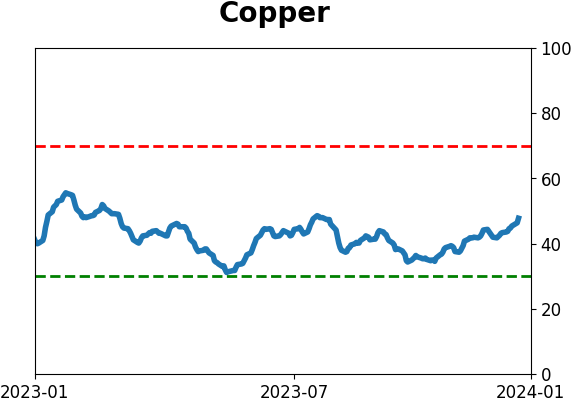
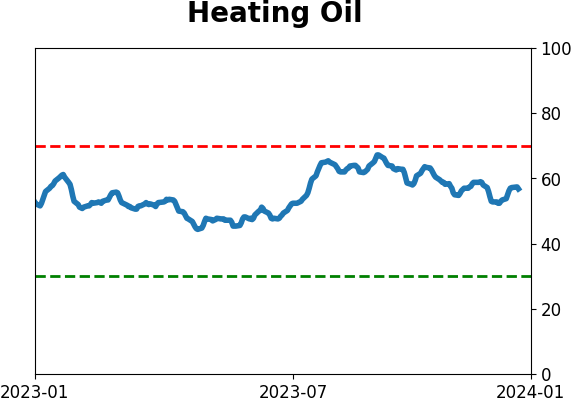
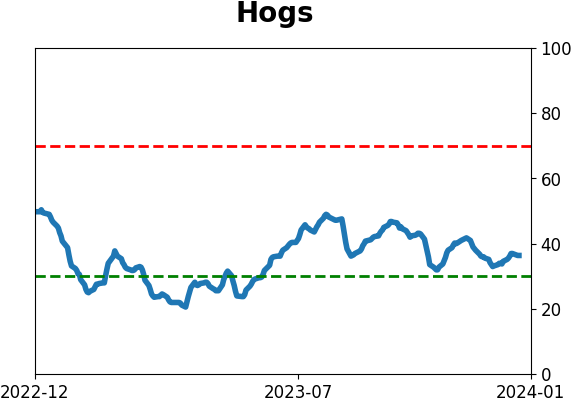
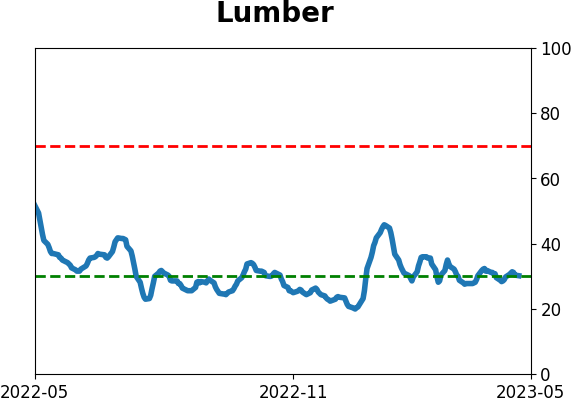
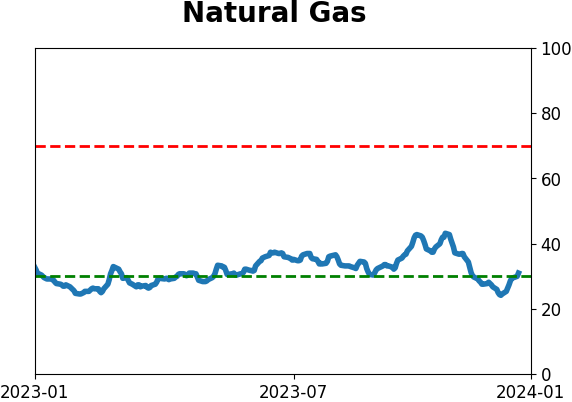
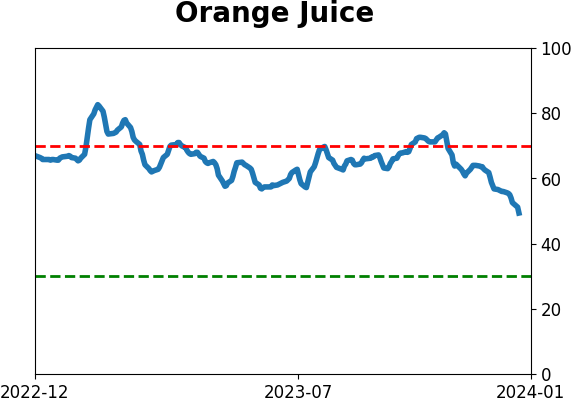
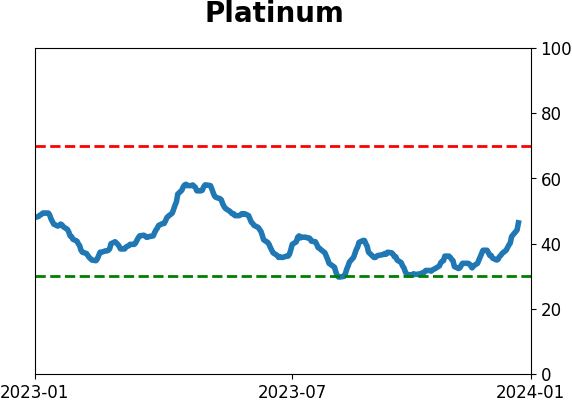
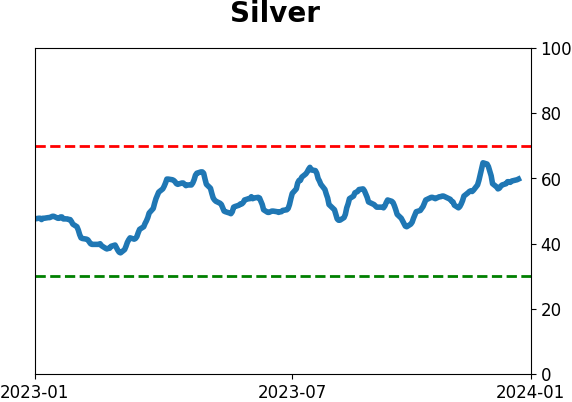
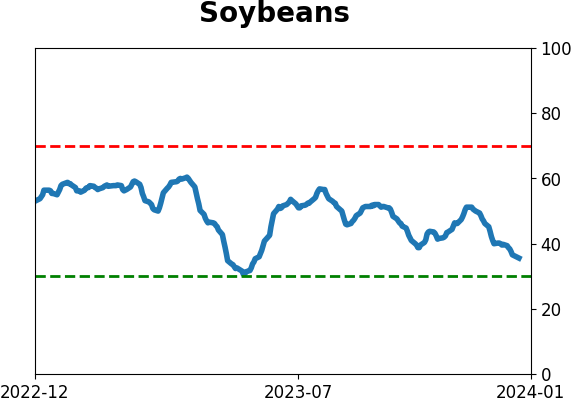
Commodity ETF's - 5-Day Moving Average
|
|