Headlines
|
|
All but 2 sectors are enjoying breadth thrusts:
Almost all stocks in the S&P 500 and 1500 indexes are above their 50-day moving averages. The uptrends are very well dispersed, as at least 8 of the 10 major sectors had more than 89% of their stocks in medium-term uptrends. Similar behavior since 1957 preceded strong returns, especially for the equal-weight S&P 500 index.
|
Smart / Dumb Money Confidence
|
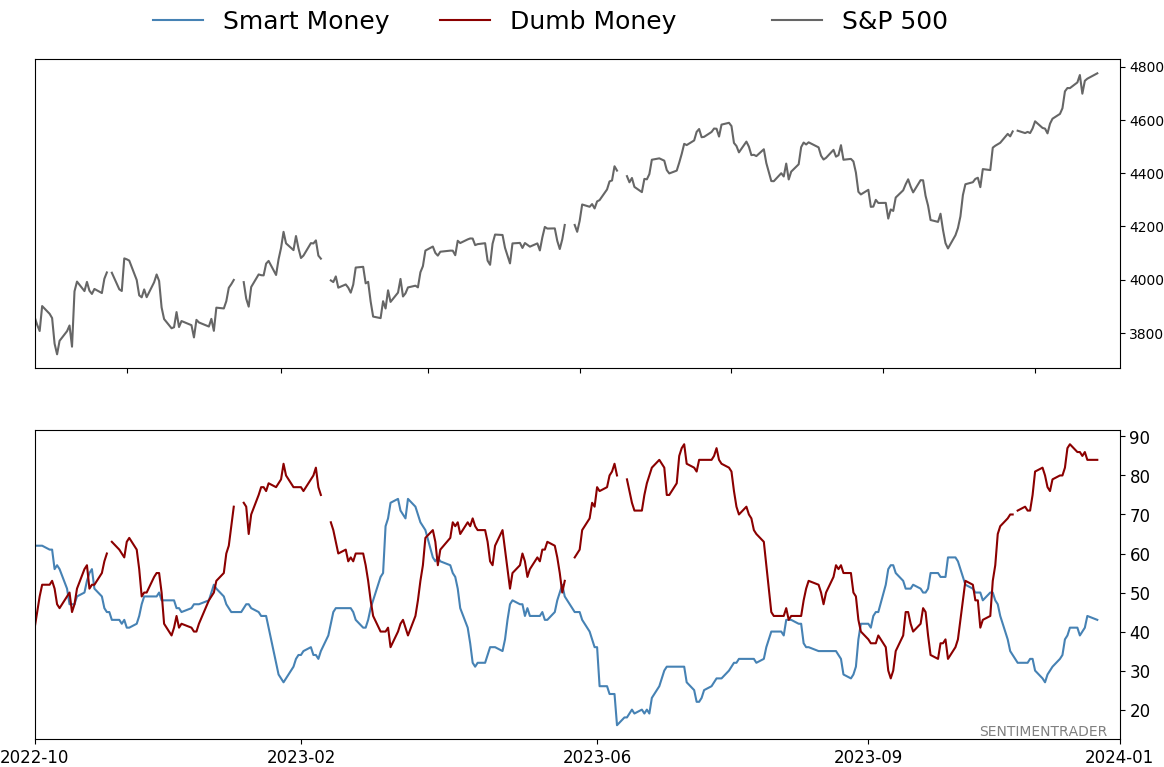
Smart Money Confidence: 43%
Dumb Money Confidence: 84%
|
|
Risk Levels
Stocks Short-Term
|
Stocks Medium-Term
|
|
Bonds
|
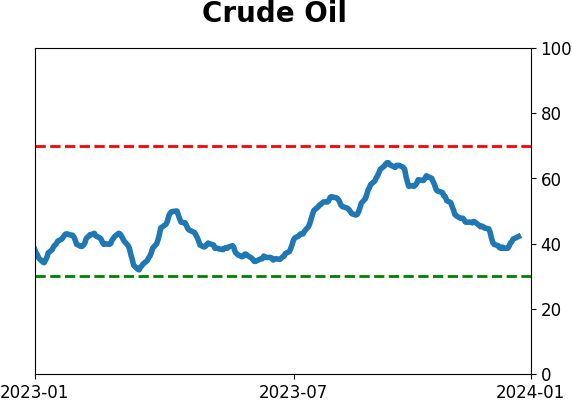
Crude Oil
|
|
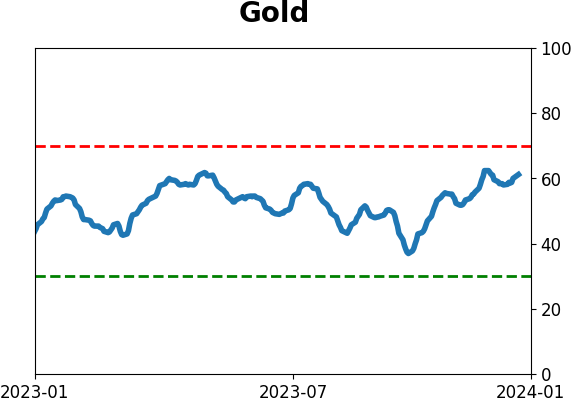
Gold

|
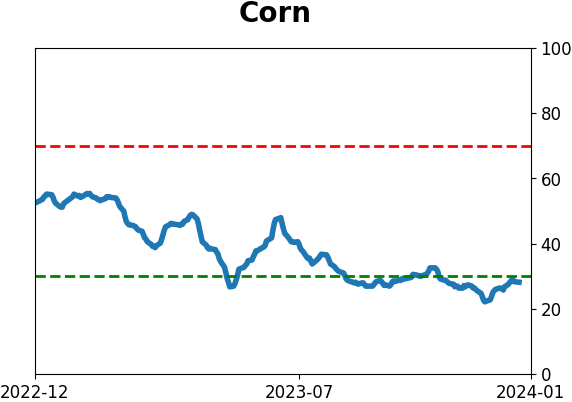
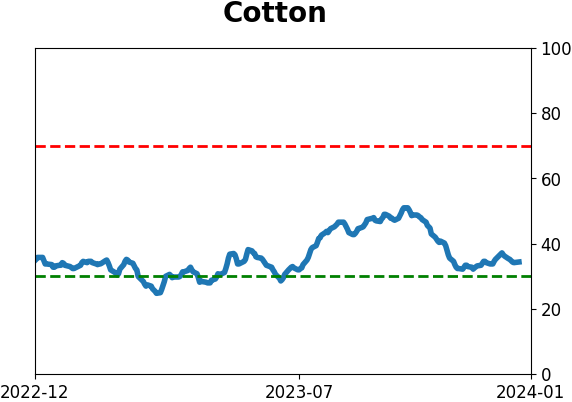
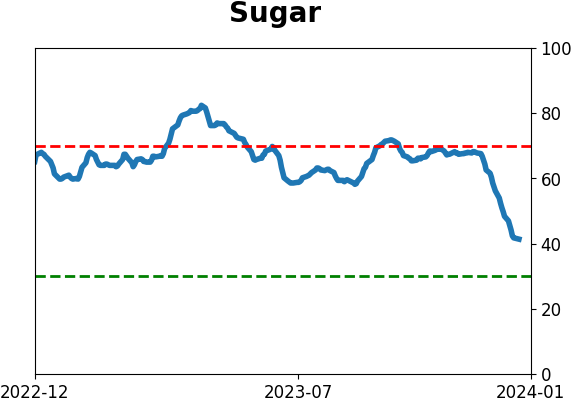
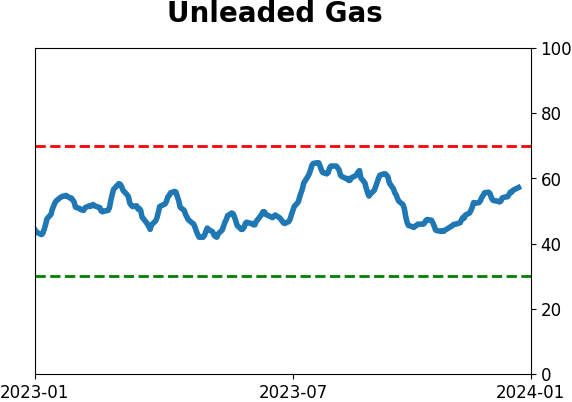
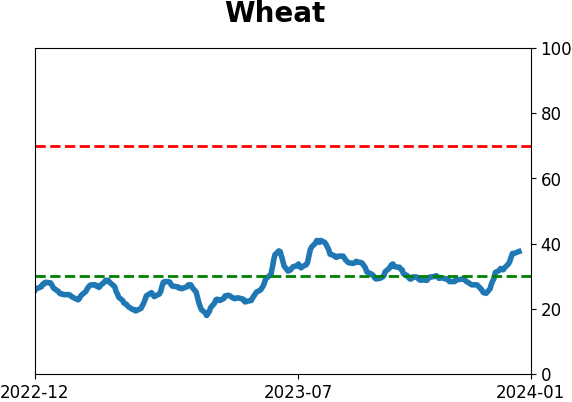
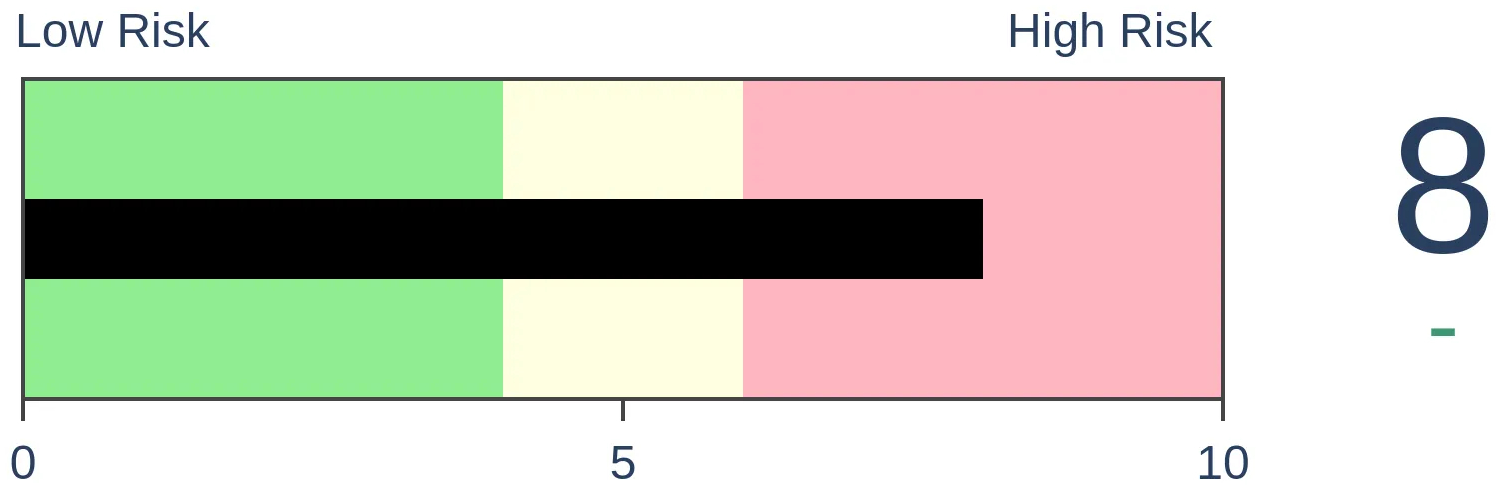
Agriculture

|
|
Research
By Jason Goepfert
BOTTOM LINE
Almost all stocks in the S&P 500 and 1500 indexes are above their 50-day moving averages. The uptrends are very well dispersed, as at least 8 of the 10 major sectors had more than 89% of their stocks in medium-term uptrends. Similar behavior since 1957 preceded strong returns, especially for the equal-weight S&P 500 index.
FORECAST / TIMEFRAME
None
|
Key points:
- All but two S&P 500 sectors have 89% or more of stocks in medium-term uptrends
- This is one of the widest dispersions of uptrends among sectors since 1957
- After other periods of widely dispersed uptrends, the S&P 500 equal-weight index performed exceptionally well
Almost all stocks in almost all sectors are in uptrends
The average stock has had an excellent few weeks. We've seen that from several different perspectives, like a 52-week breakout in the S&P 500 equal-weight index and nearly all stocks in the S&P 1500 being in medium-term uptrends.
Speaking to those uptrends, Dean pointed out that more than 90% of 1,500 stocks are above their 50-day moving averages. That's an impressive feat and preceded almost universal gains in the months ahead.
Another way of looking at this is the distribution of those uptrends among sectors. If a sector has a lot of stocks that are doing well, it can overwhelm the other sectors and skew the results to the positive side. But the distribution has been extremely broad, as 8 out of the 10 major historical sectors (excluding Real Estate) have 90%* or more of their stocks in medium-term uptrends.
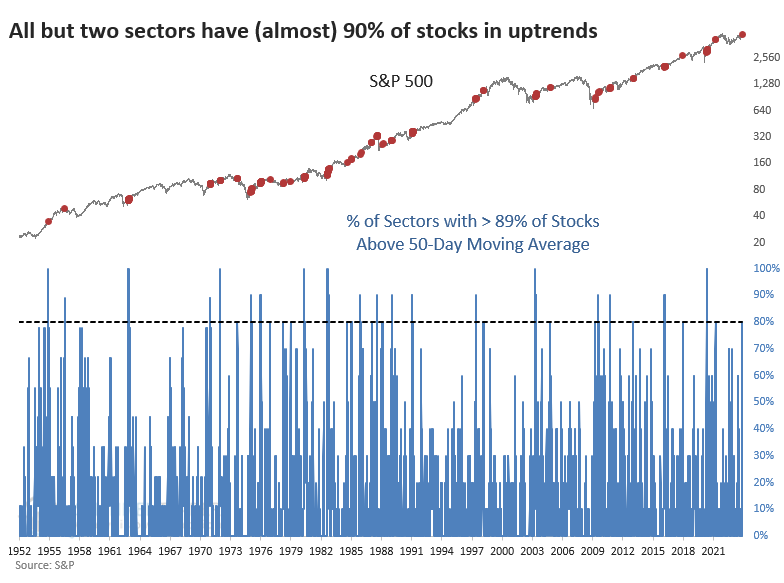
* There is some data mining here because two sectors just barely missed the 90% round number, both exceeding 89% of stocks.
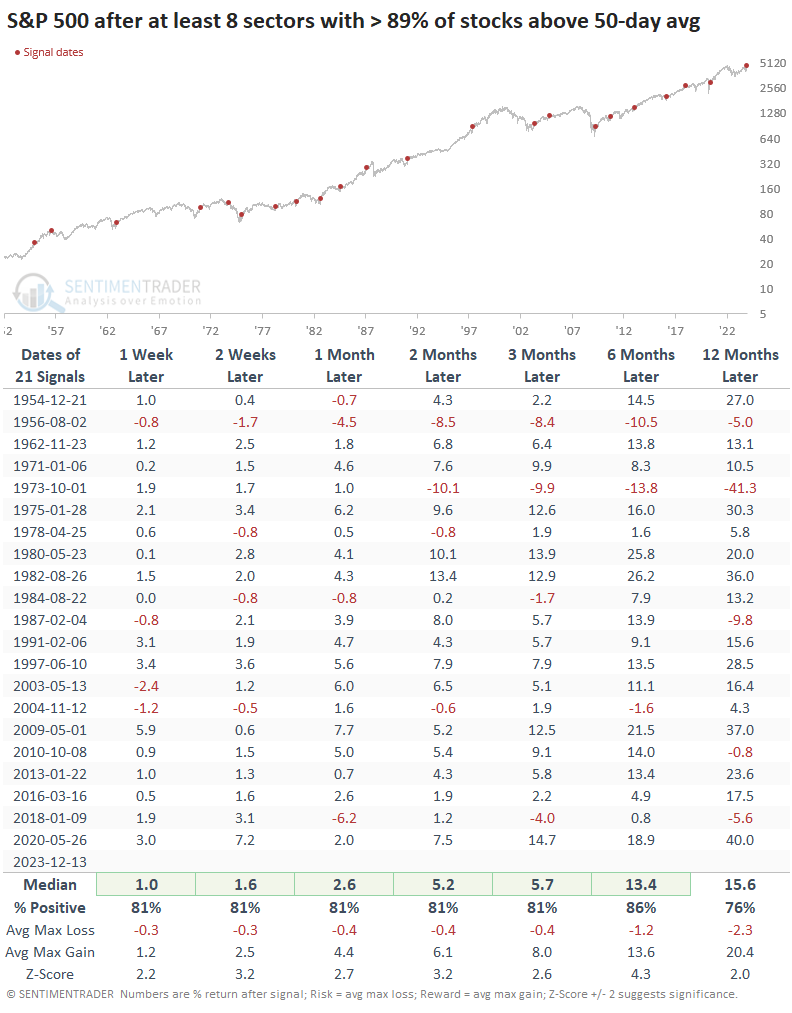
Dispersed participation has been a very good sign
The table below shows returns in the S&P 500 after at least eight sectors had at least 89% of their stocks above their 50-day moving averages. Confirming other studies we've looked at in recent weeks, those returns were quite positive across all time frames.
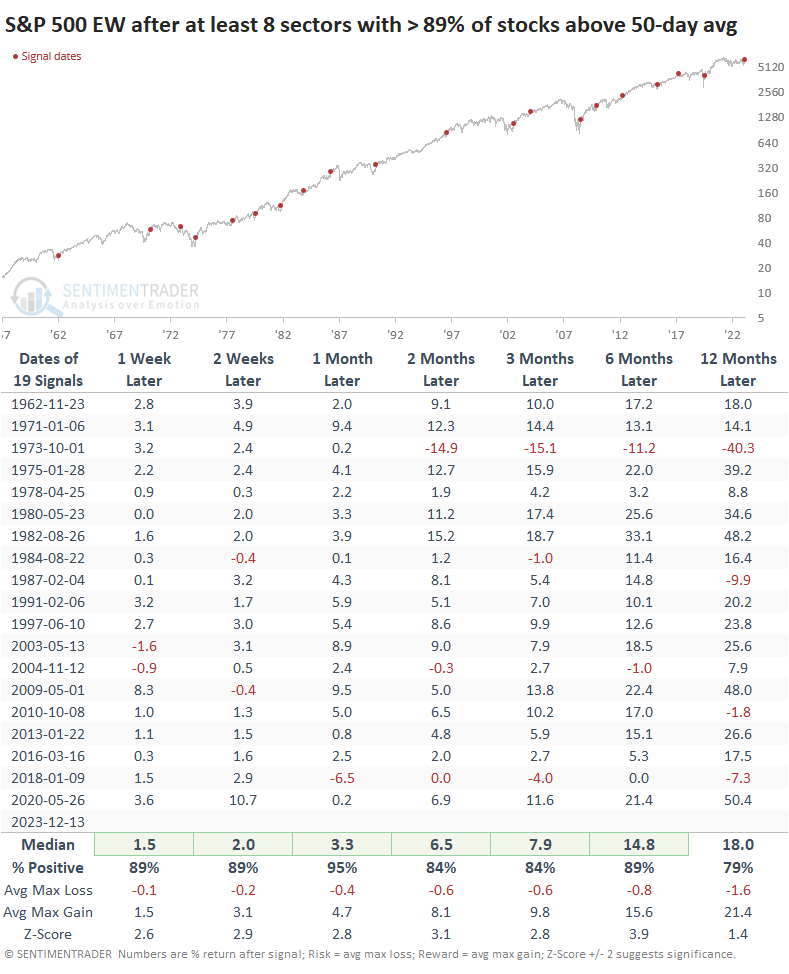
Since the uptrends are so well distributed, looking at performance for the S&P 500 equal-weight index makes sense. There are two fewer signals for this index since we don't have history before 1957. The only major failure was in 1973.
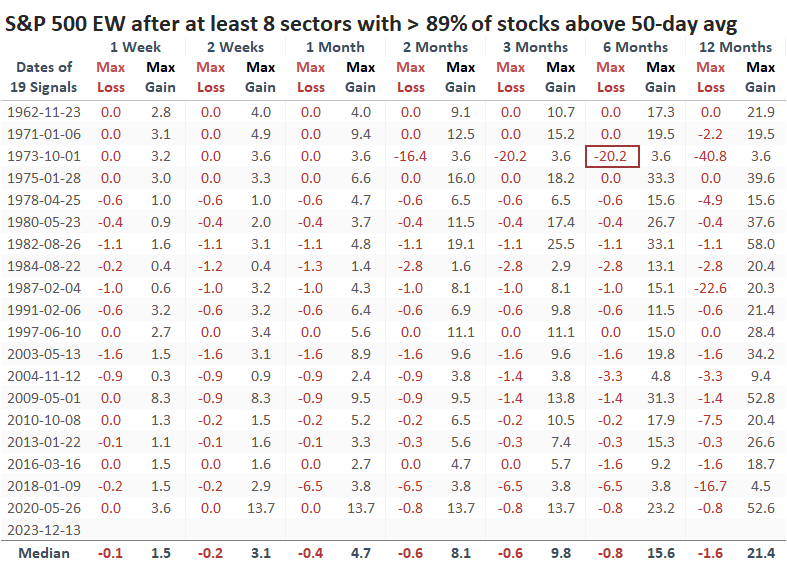
The table of maximum gains and losses across time frames shows that only the 1973 signal suffered a significant drawdown within six months. Remarkably, only two signals witnessed drawdowns worse than -3.3% at any point in the next half-year.
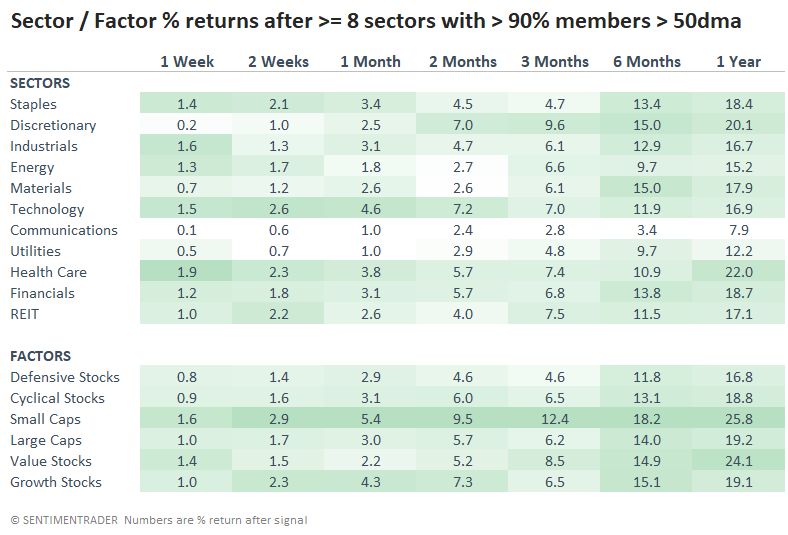
Among sectors and factors, there was a lot of green, which is to be expected given the above. Notably, Small Caps stand out for exceptionally strong returns across all time frames.
What the research tells us...
Since October 2022, we've detailed countless studies about the breadth of the advance at certain points. It has been exceptional, and that rarely, if ever, has occurred during protracted bear markets. Now that most major indexes are at or are within spitting distance of all-time highs, the rally's breadth isn't slowing down much.
While that always raises concerns about an overheated market, and there may be some shorter-term validity to that argument, over a medium- to long-term time frame, participation like this has rarely led to significant declines.
Indicators at Extremes
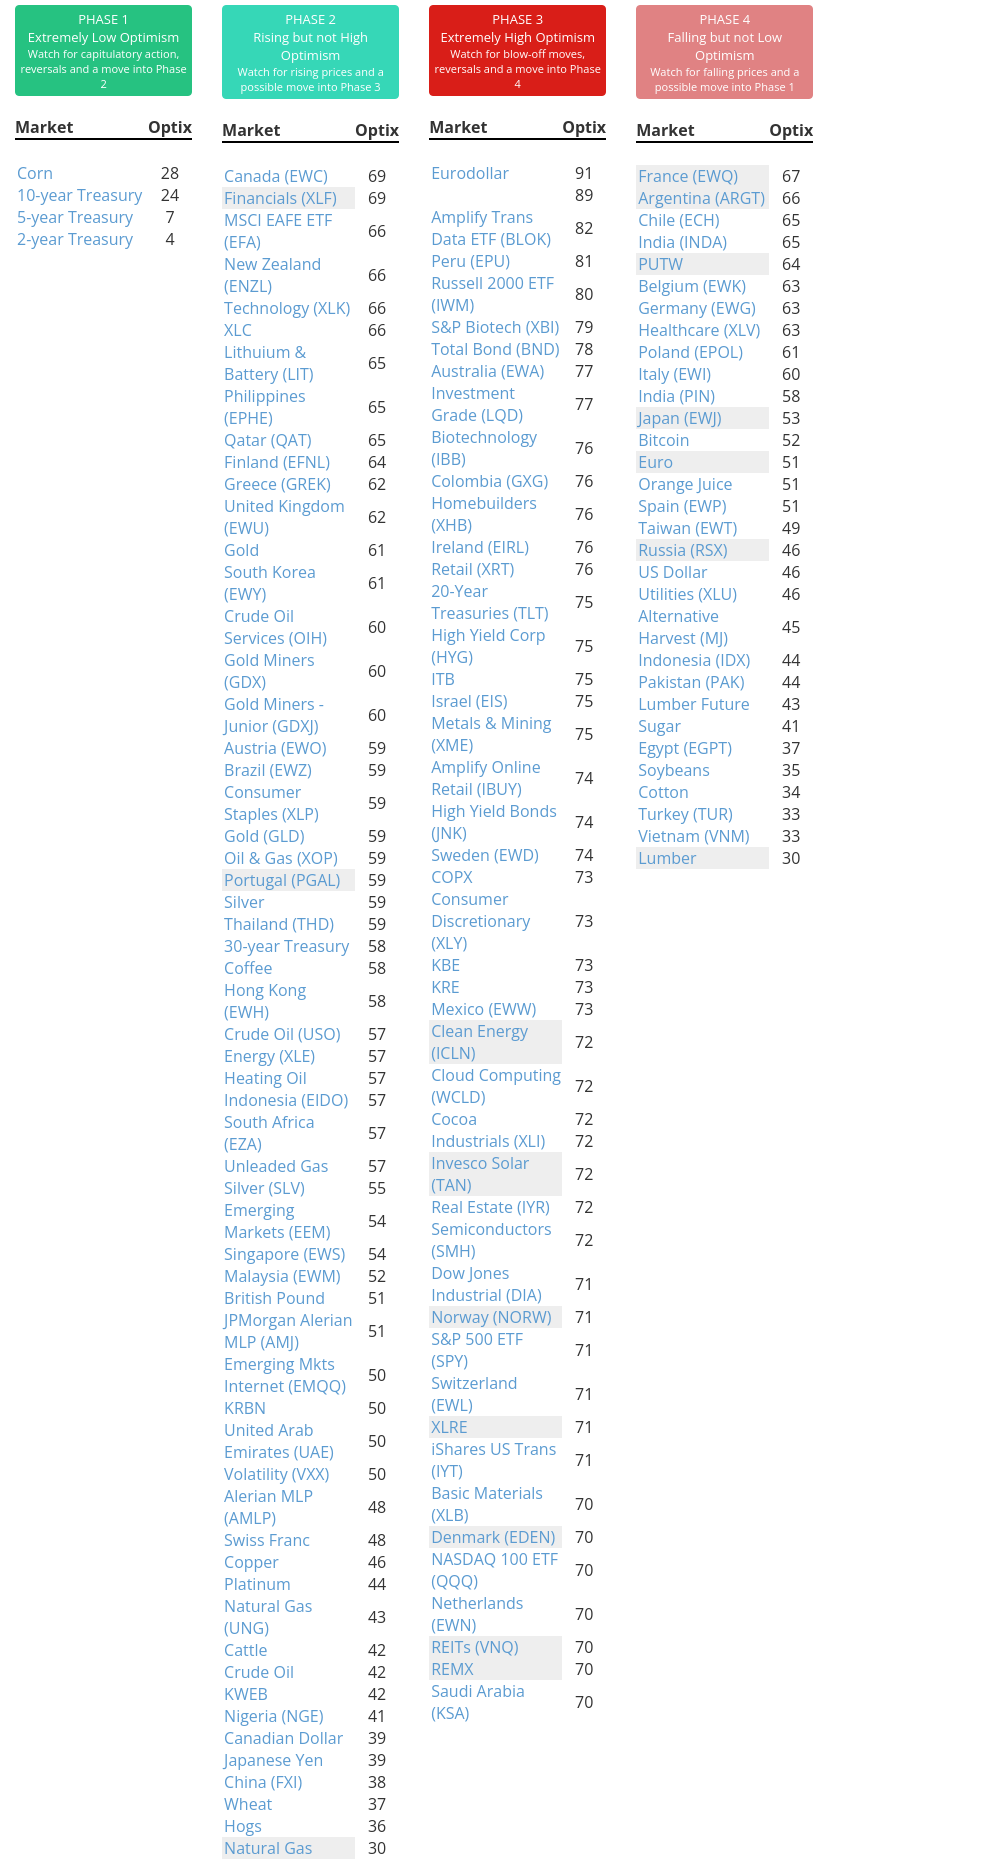
Phase Table
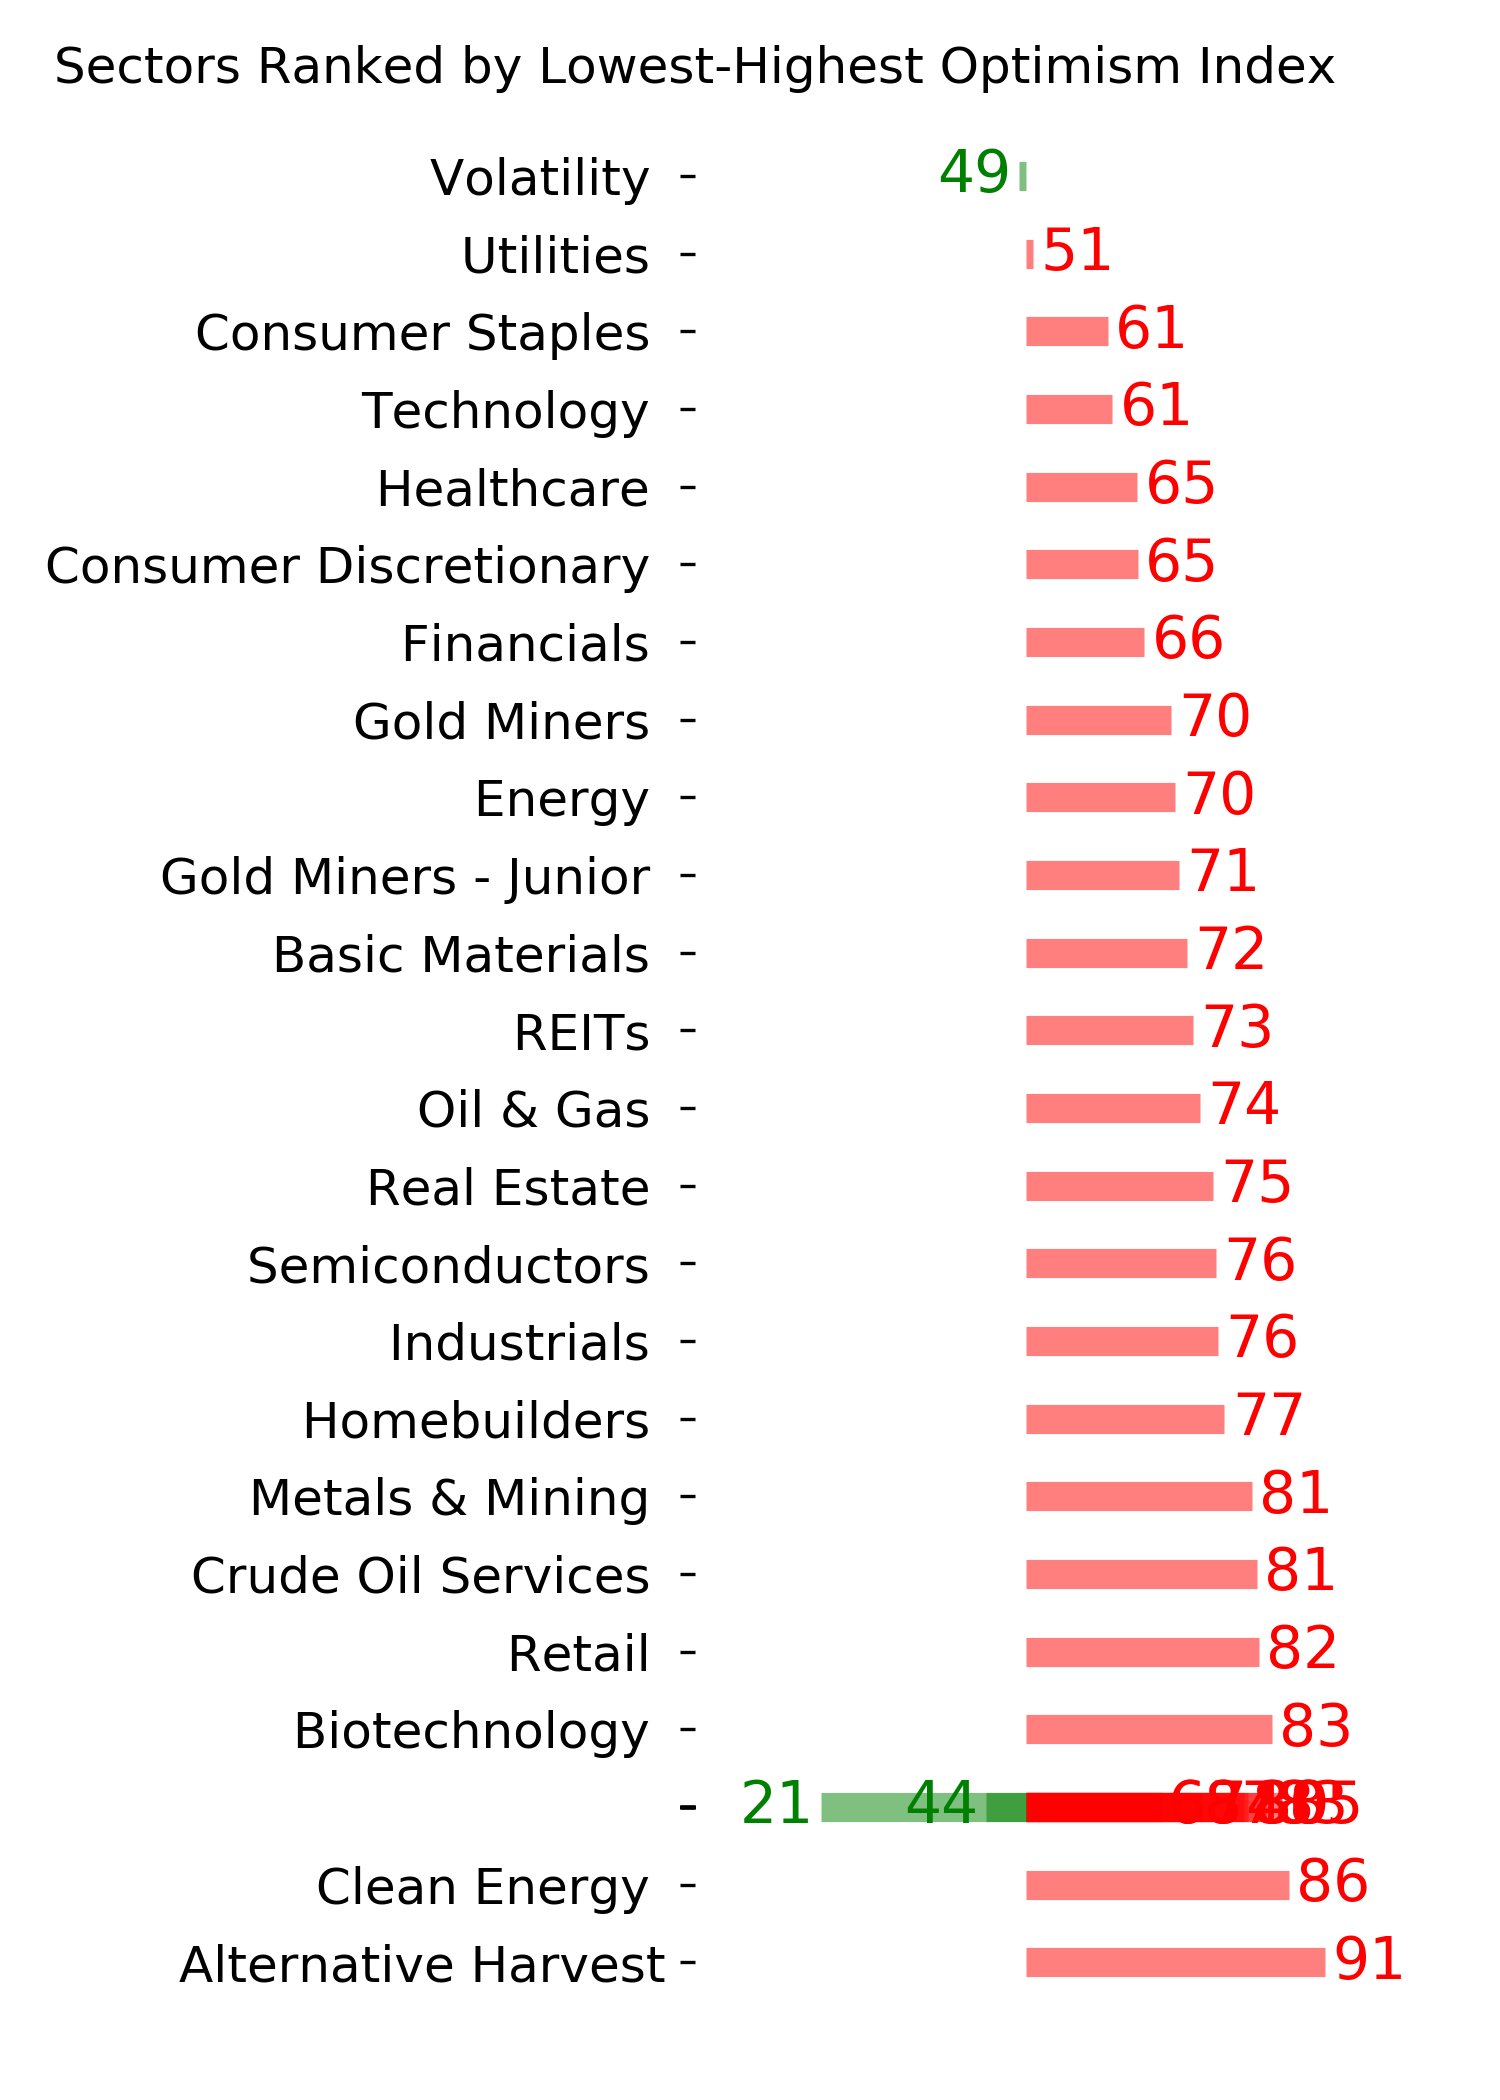
Ranks
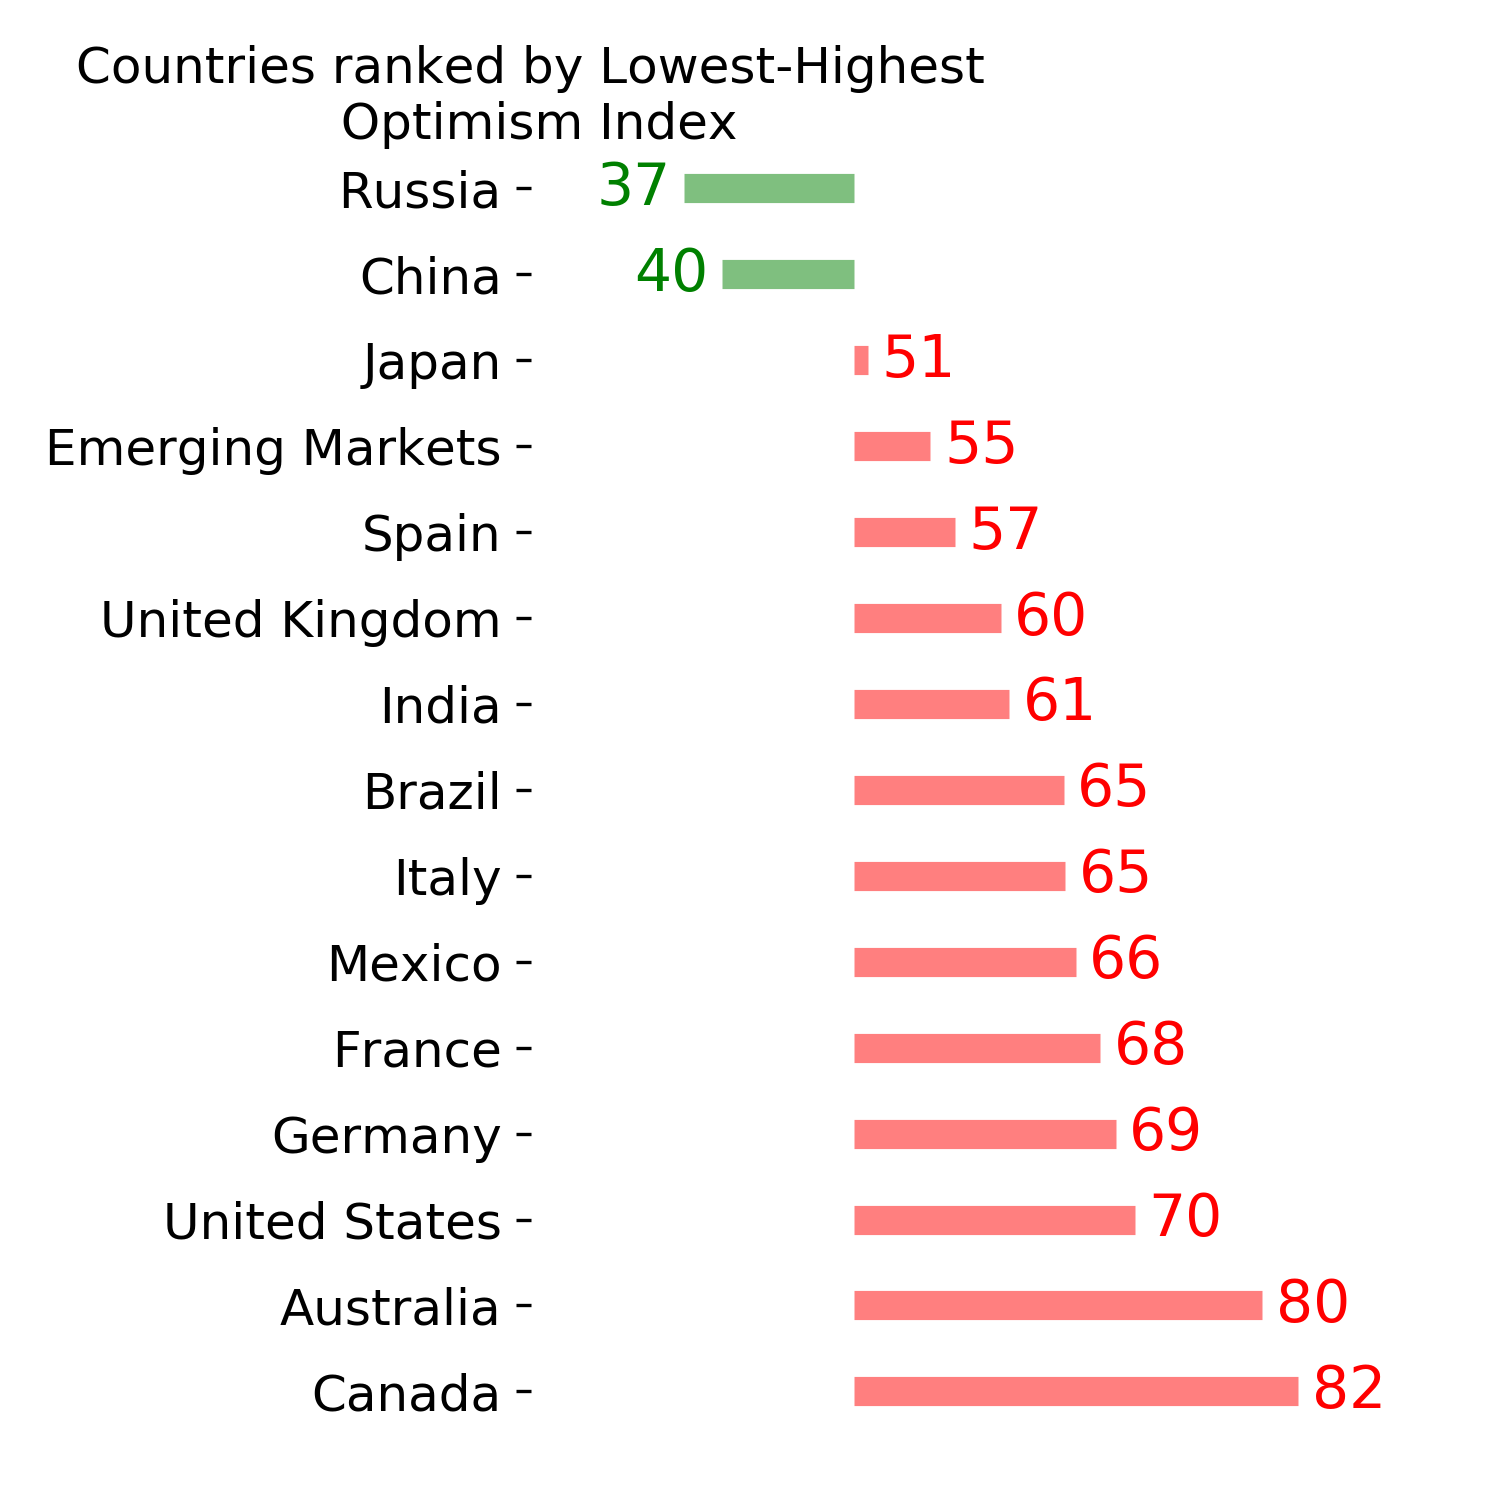
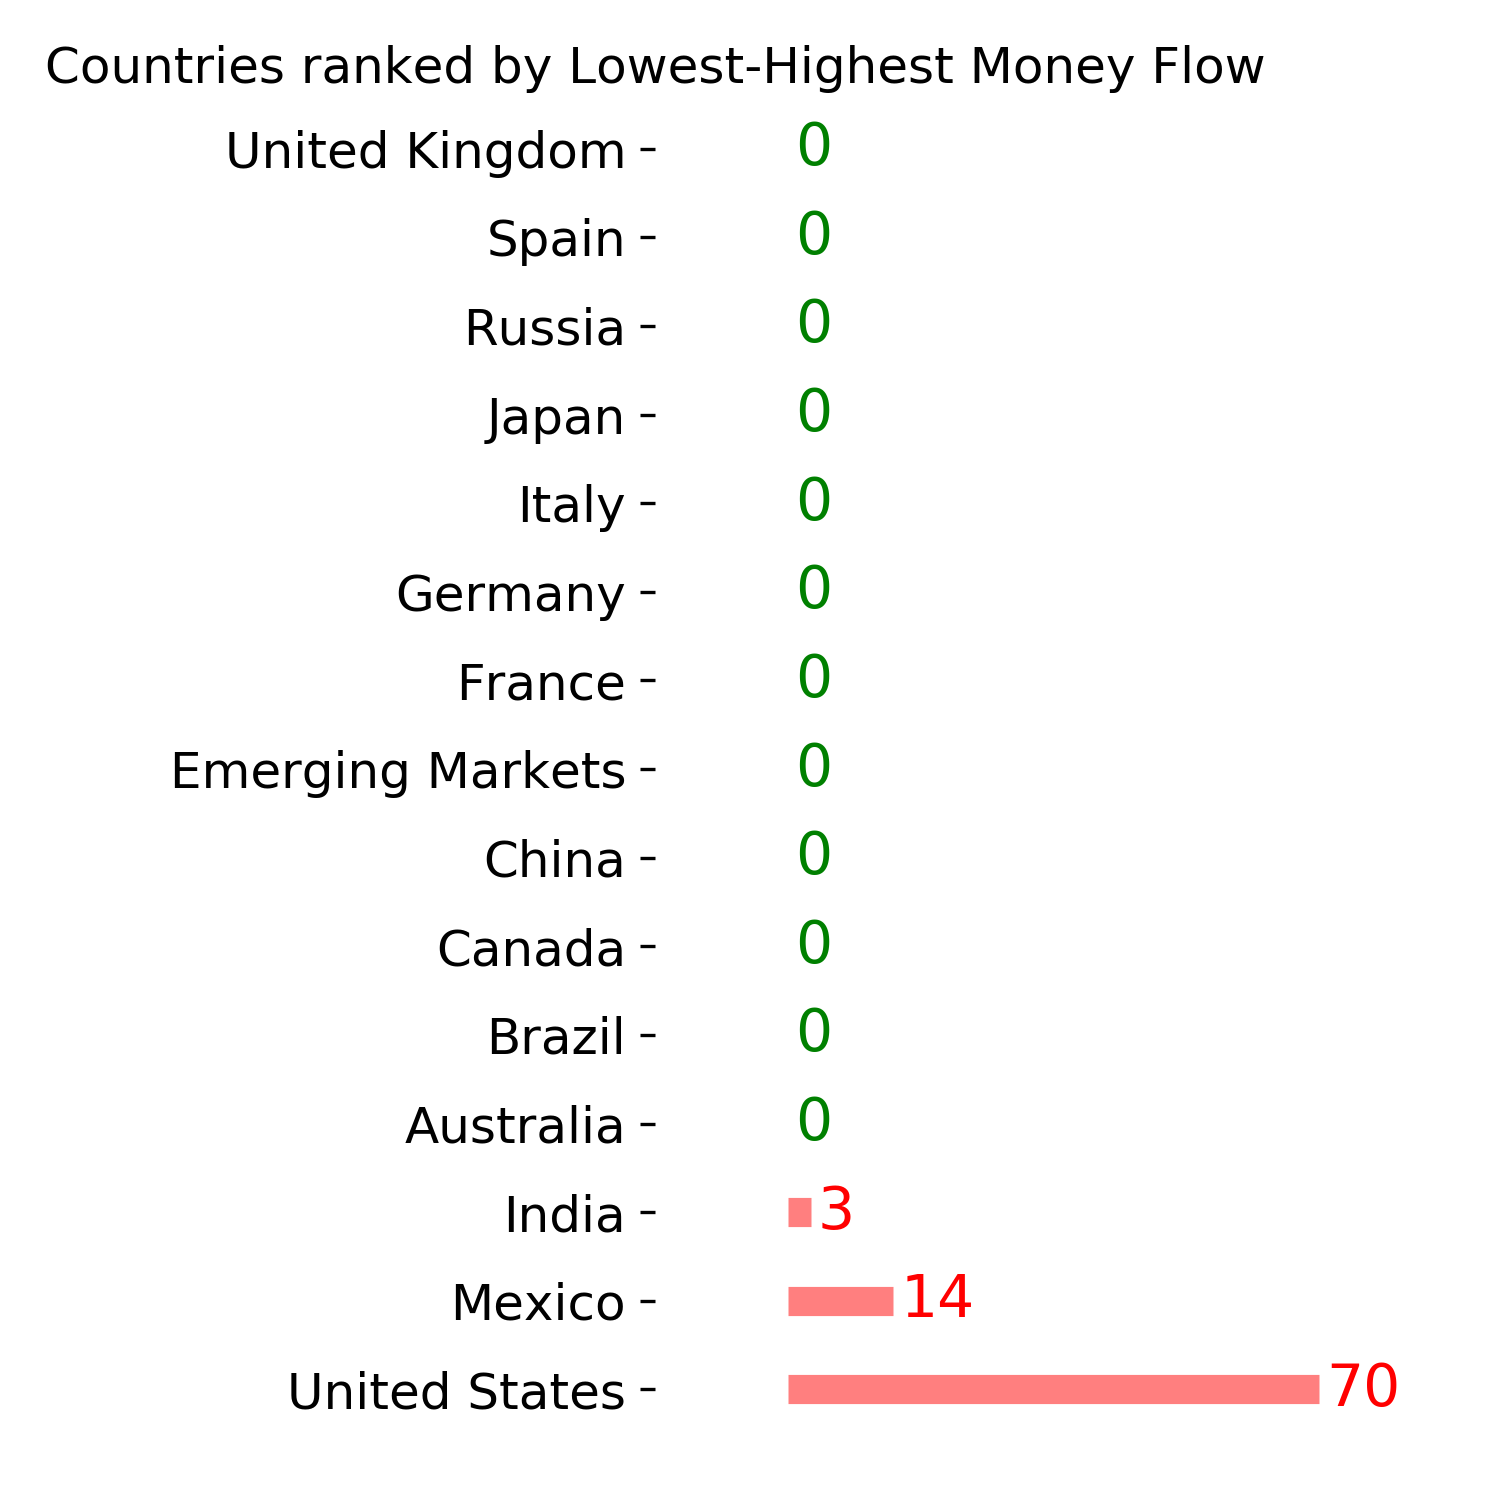
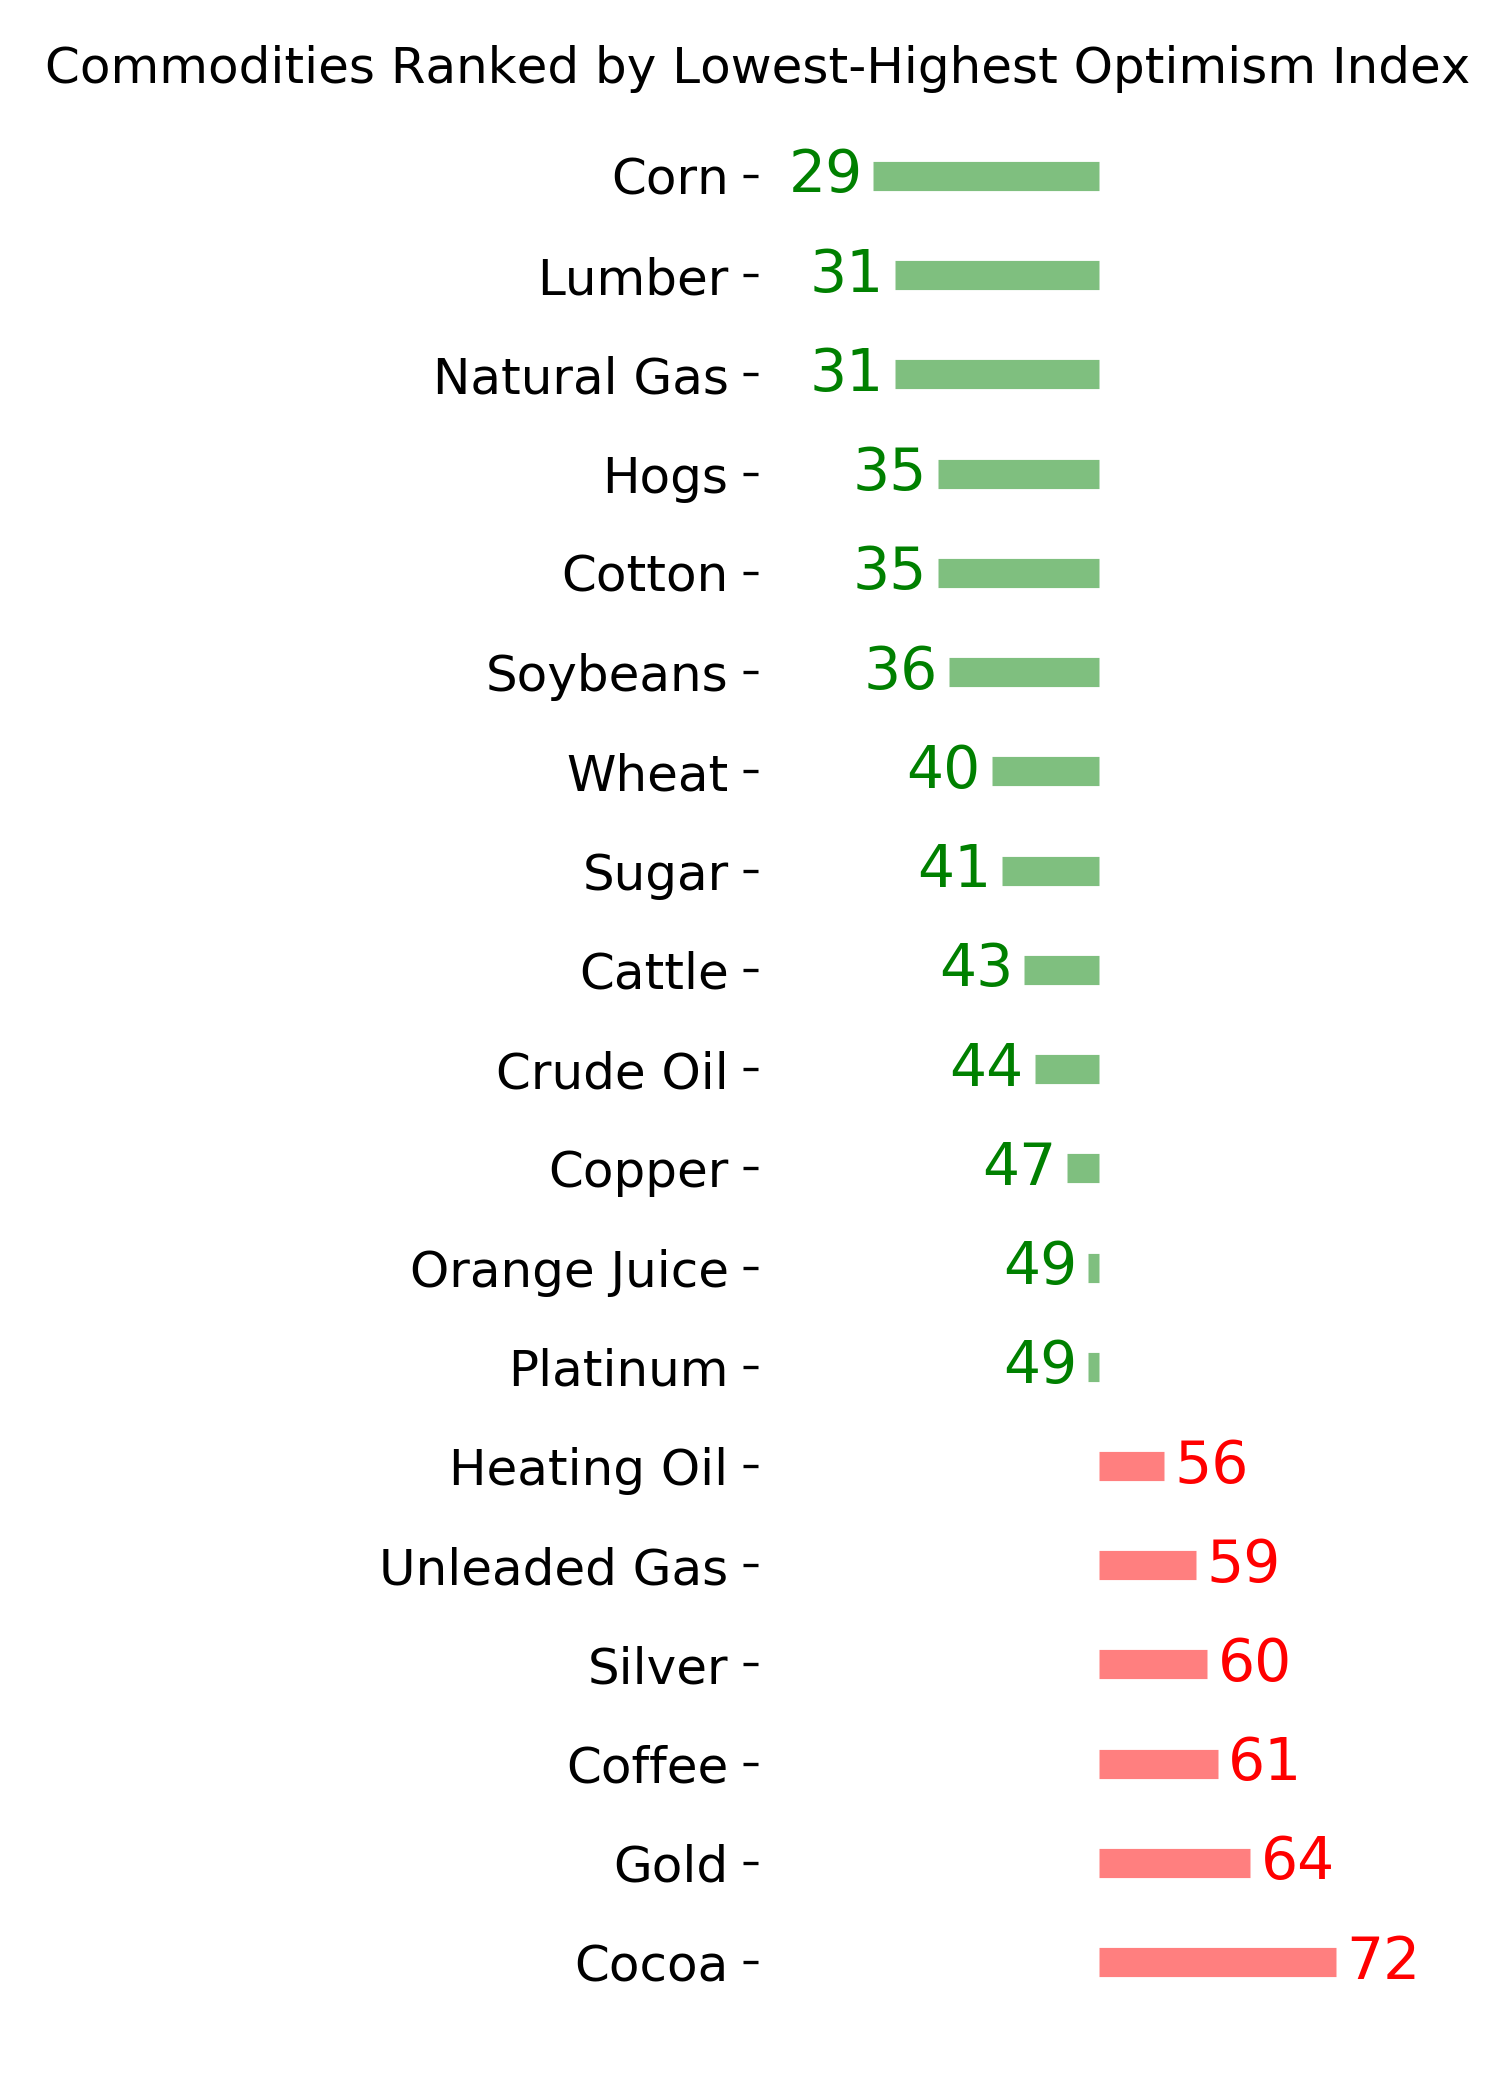
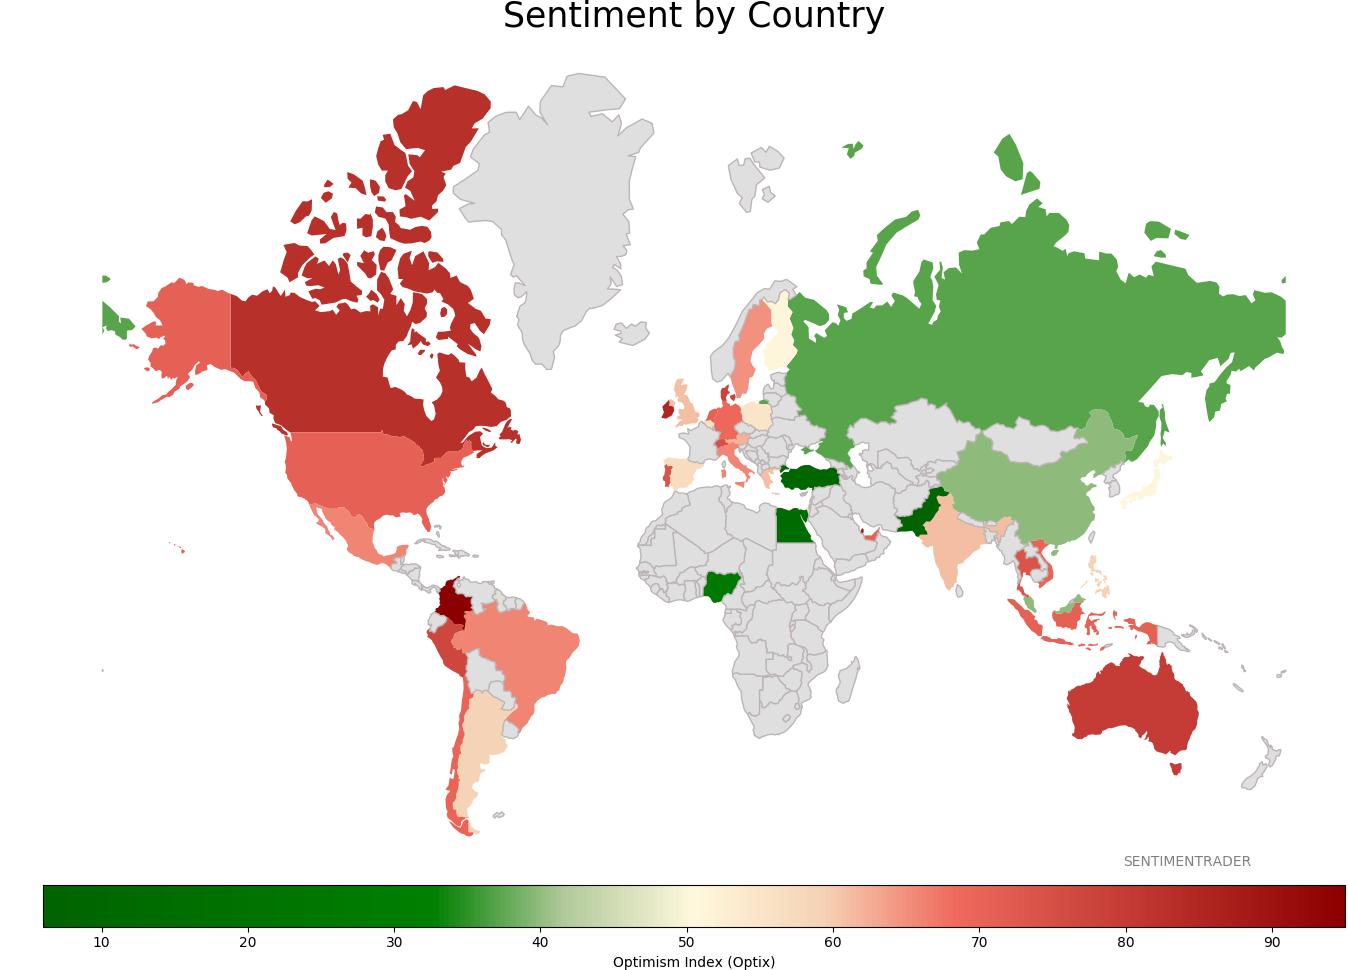
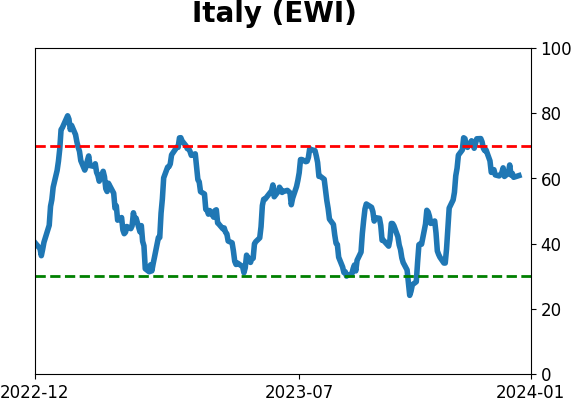
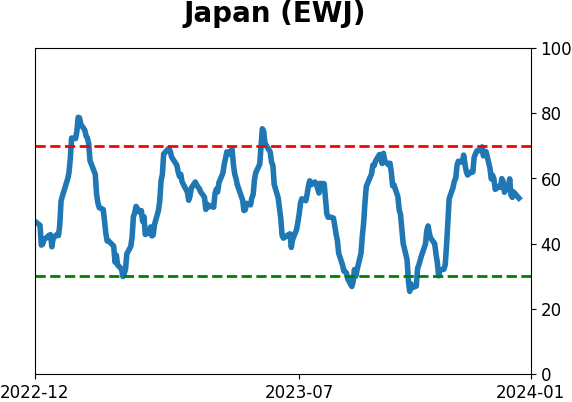
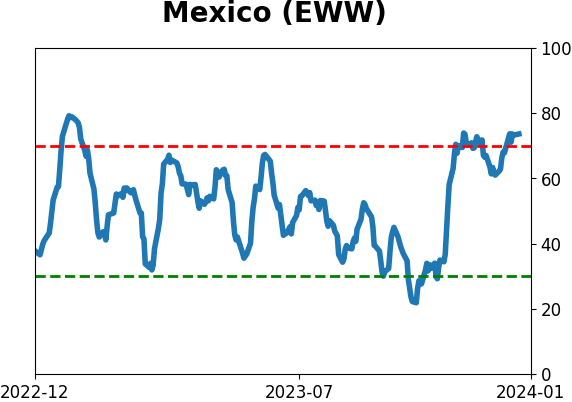
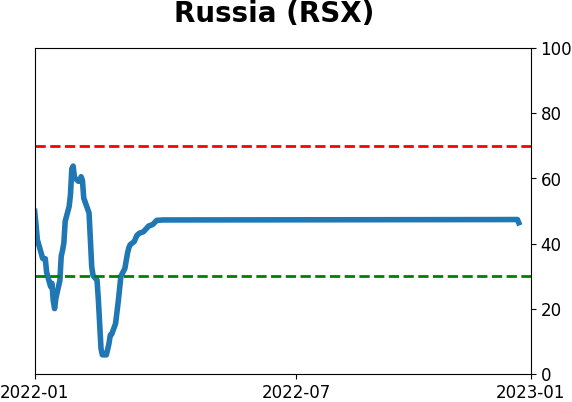
Sentiment Around The World
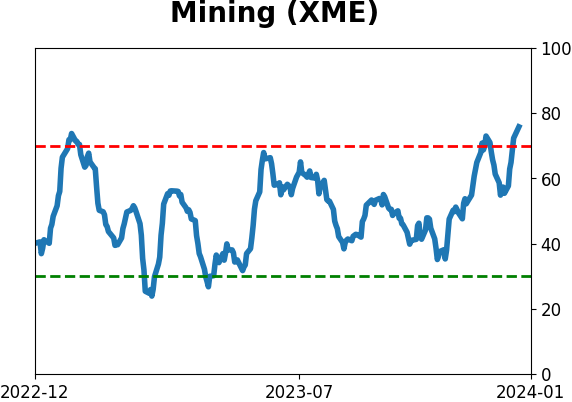
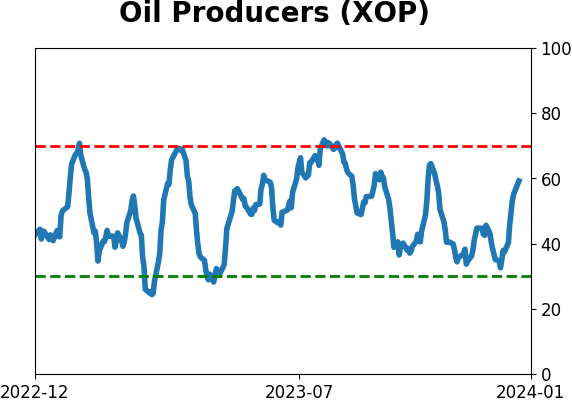
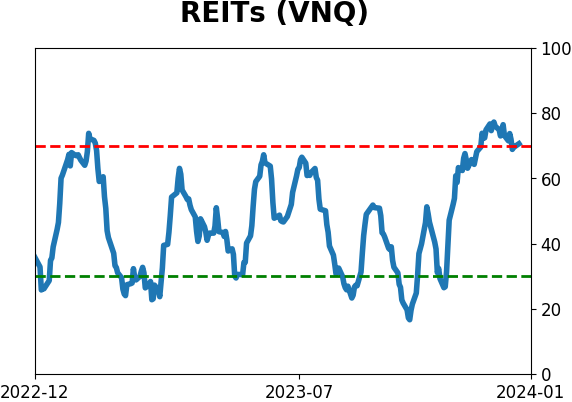
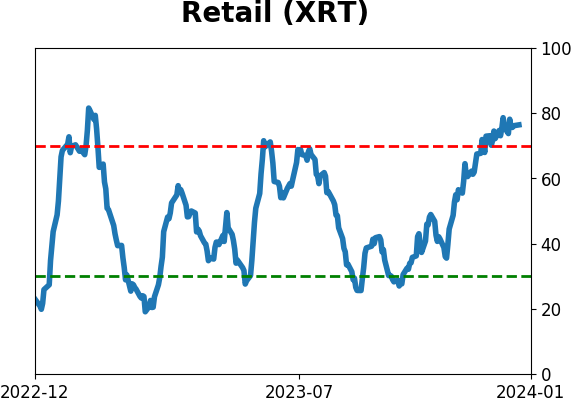
Optimism Index Thumbnails
|
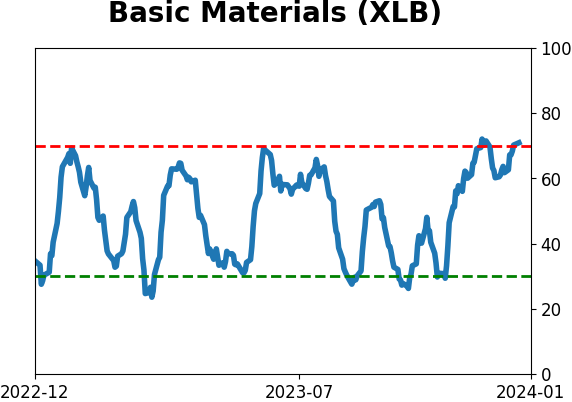
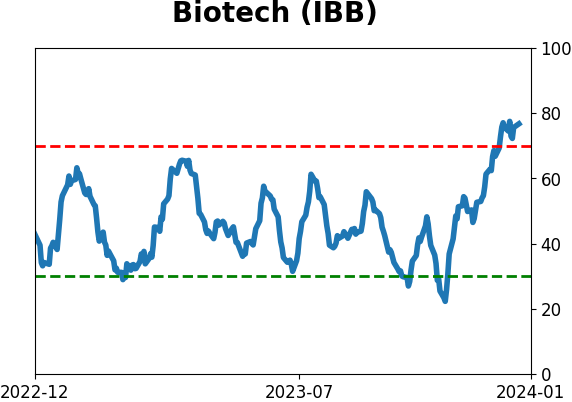
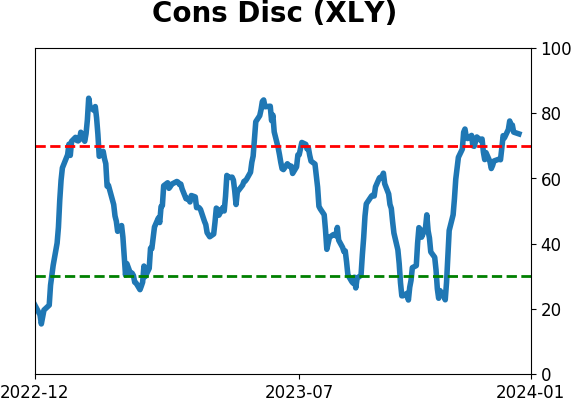
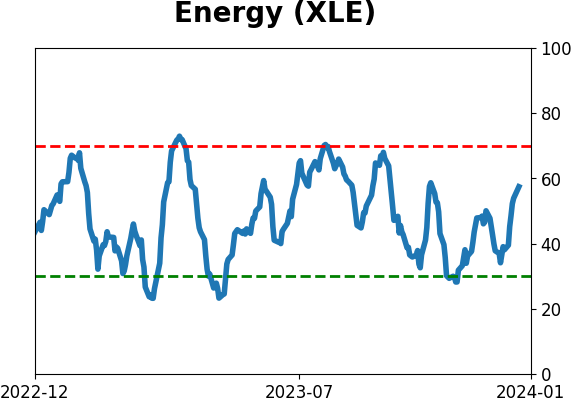
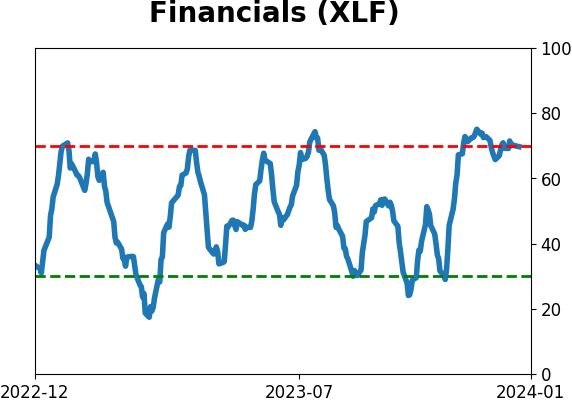
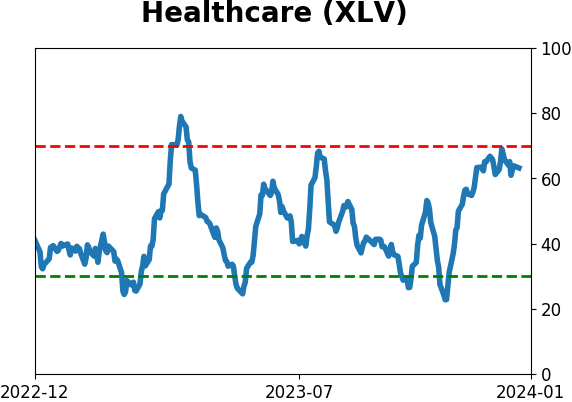
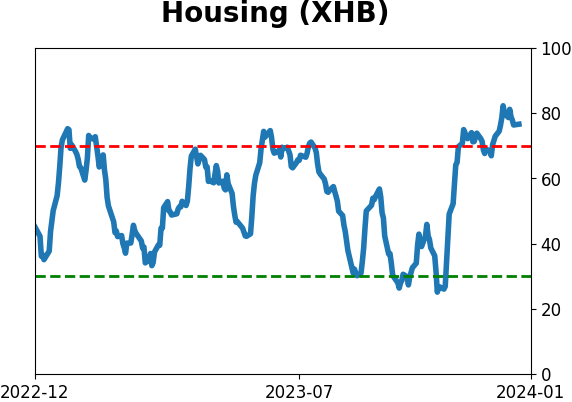
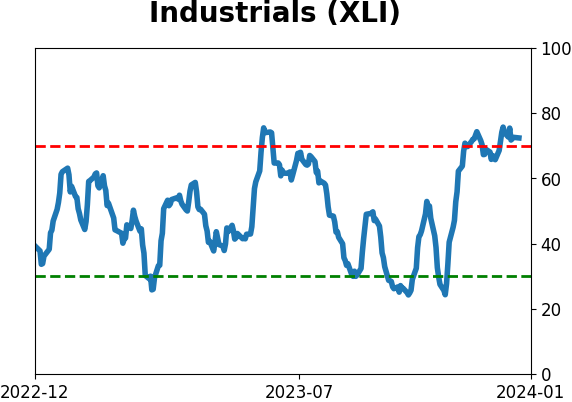
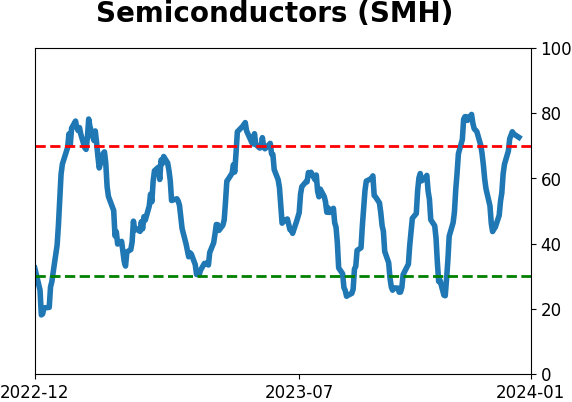
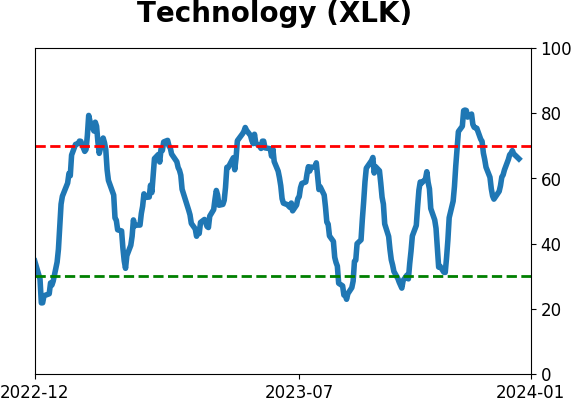
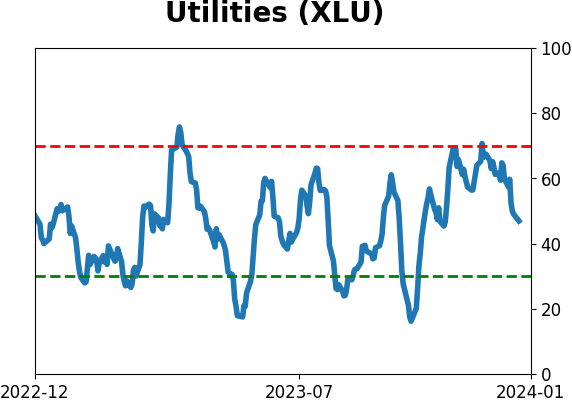
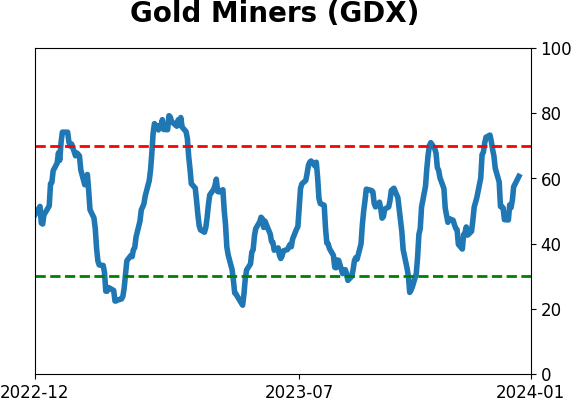
Sector ETF's - 10-Day Moving Average
|
|
|
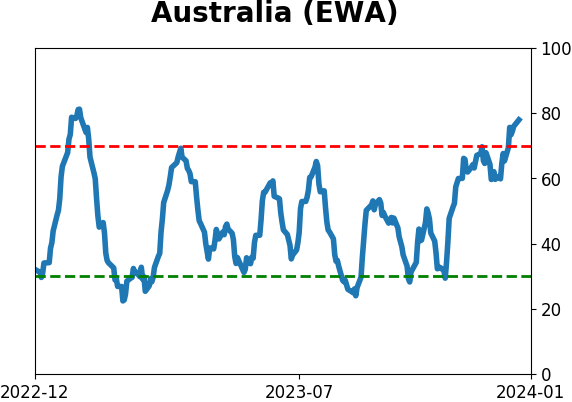
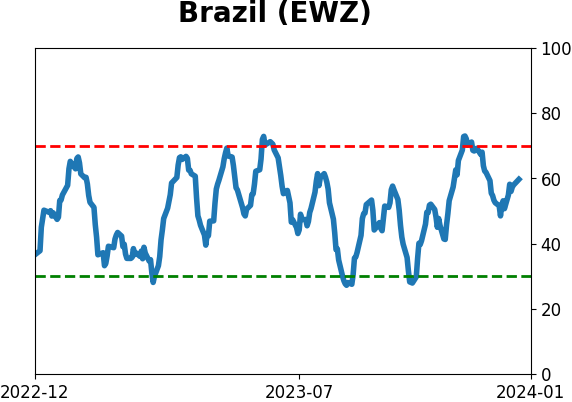
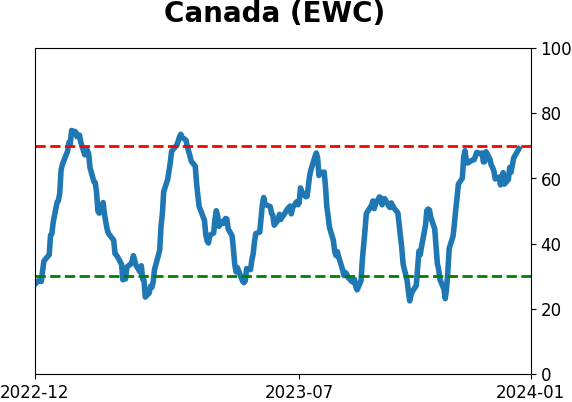
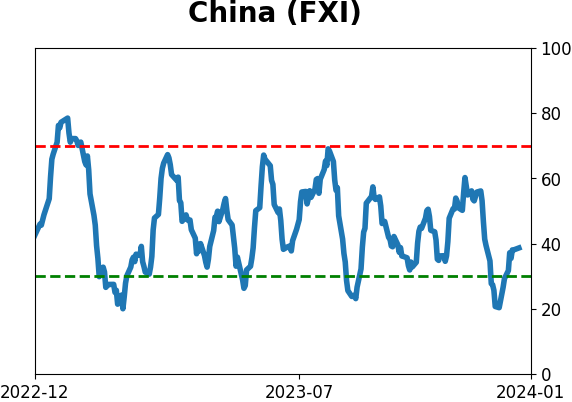
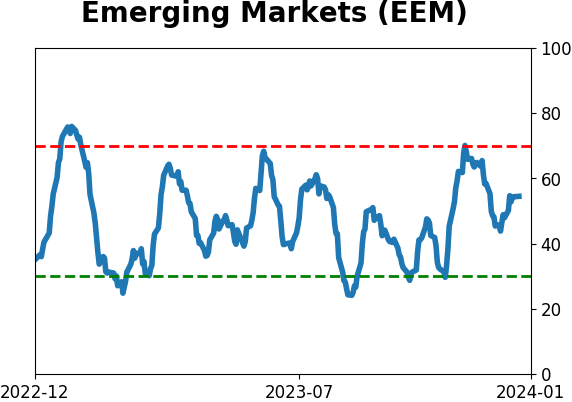
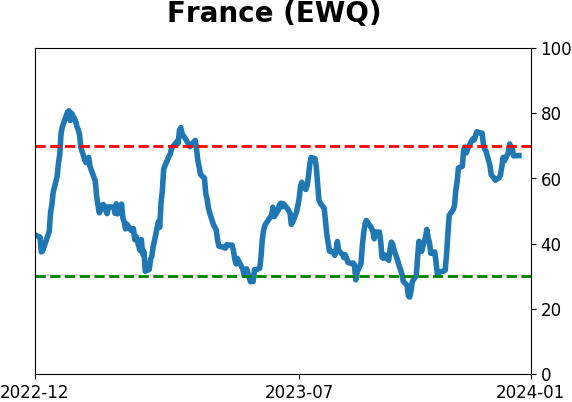
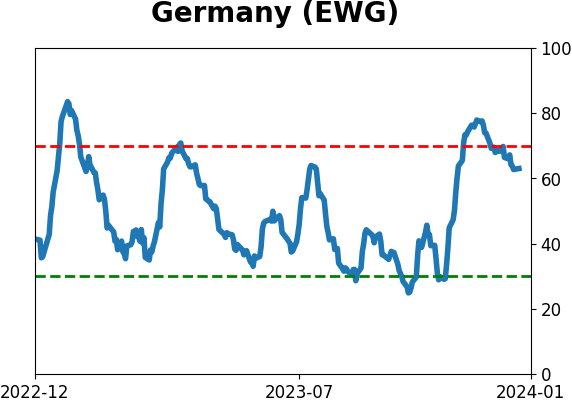
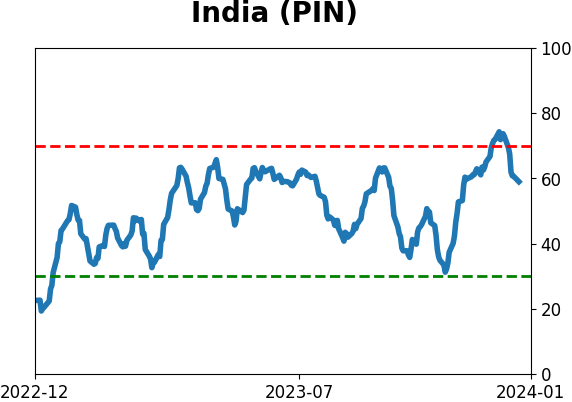
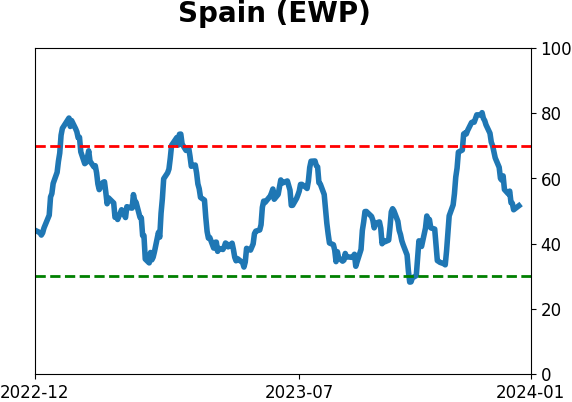
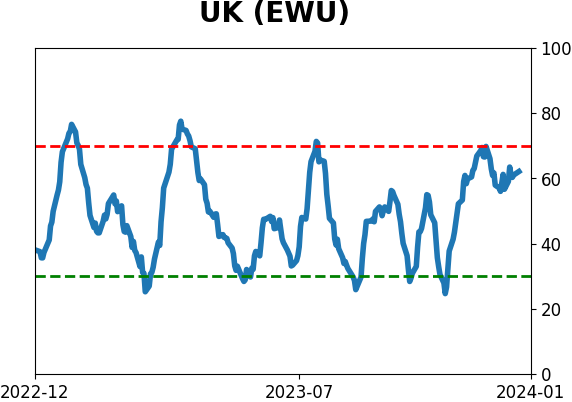
Country ETF's - 10-Day Moving Average
|
|
|
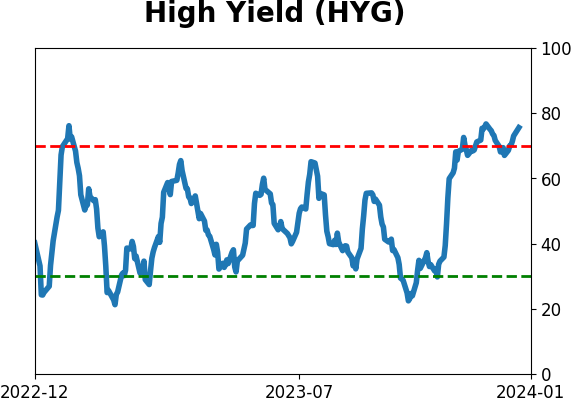
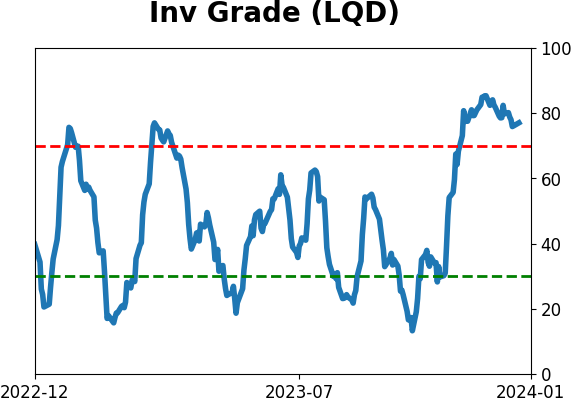
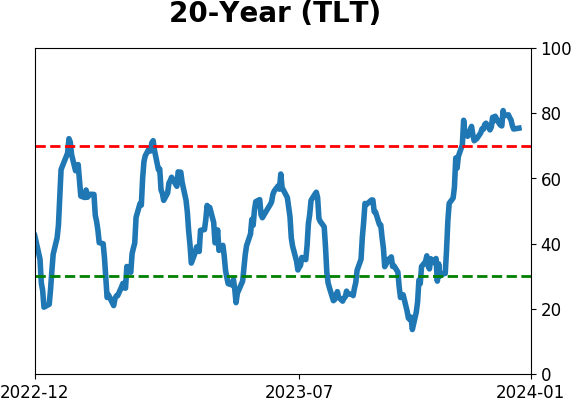
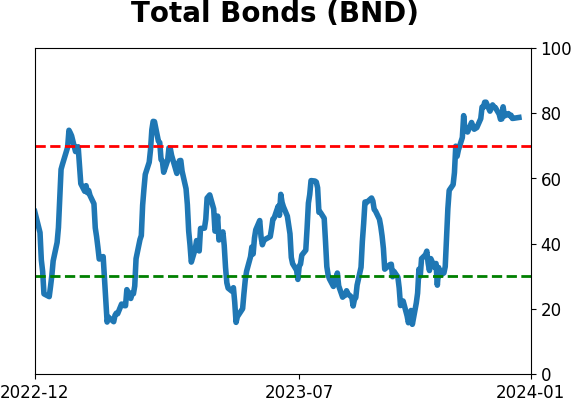
Bond ETF's - 10-Day Moving Average
|
|
|
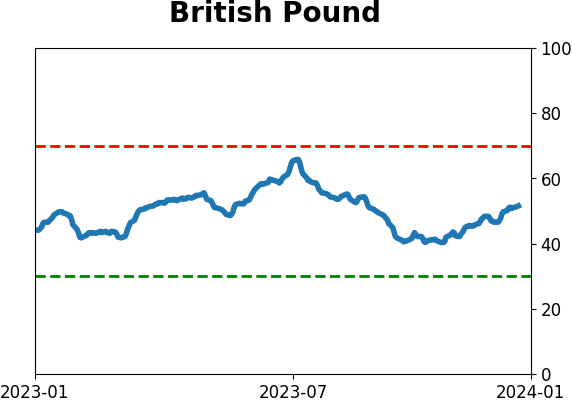
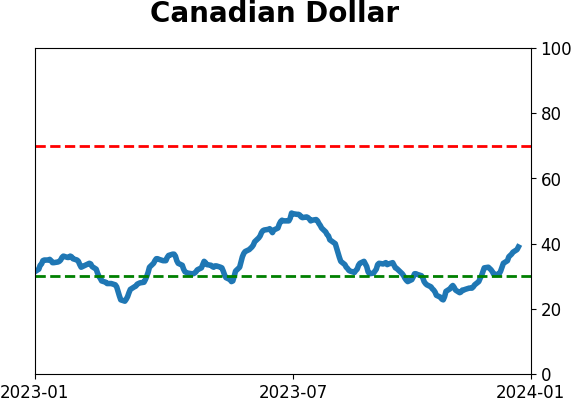
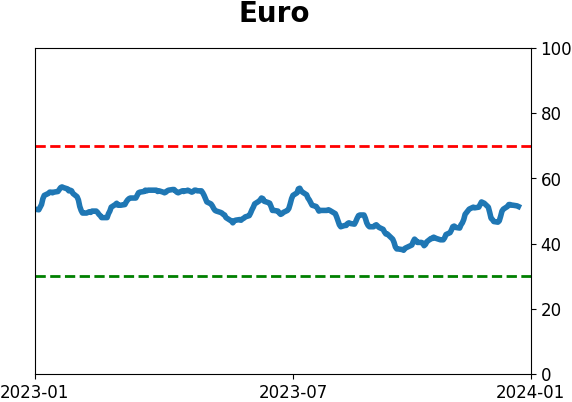
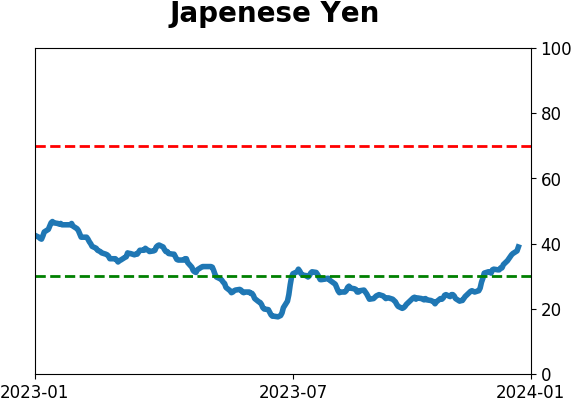
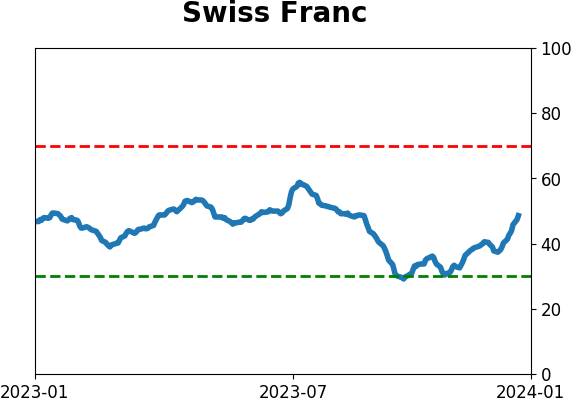
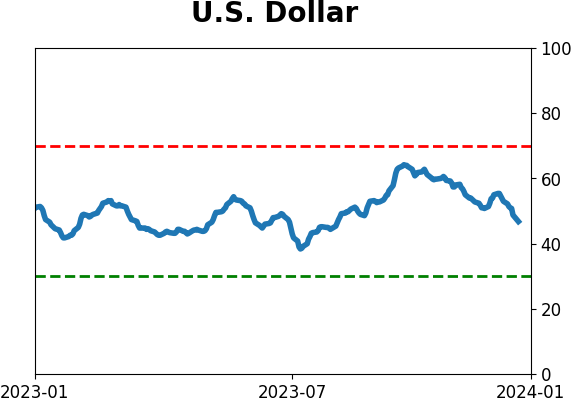
Currency ETF's - 5-Day Moving Average
|
|
|
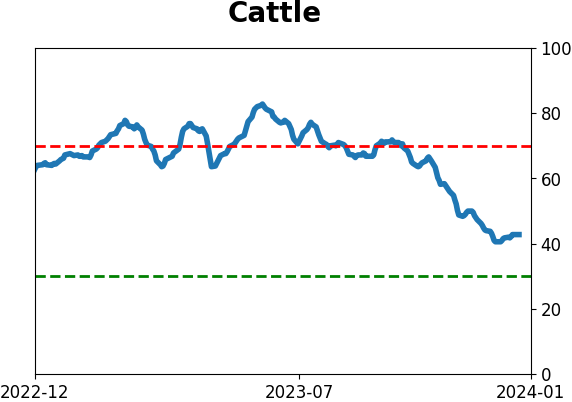
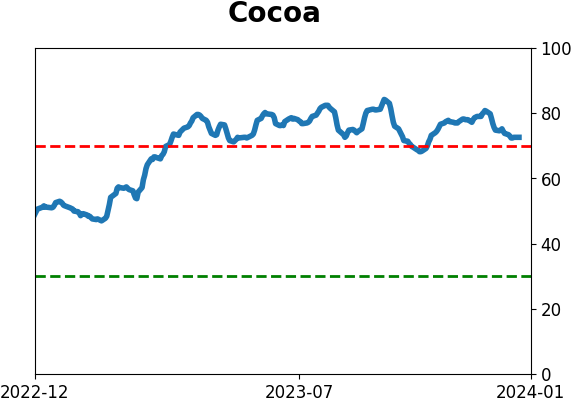
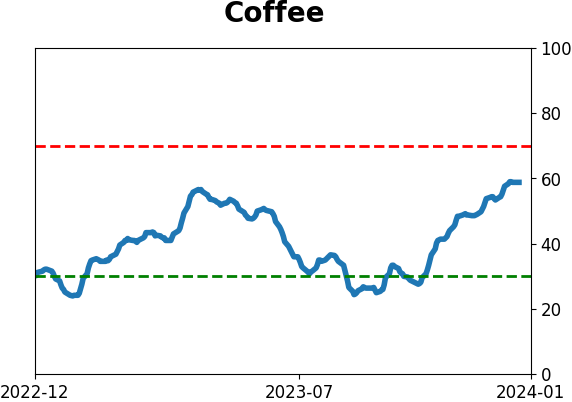
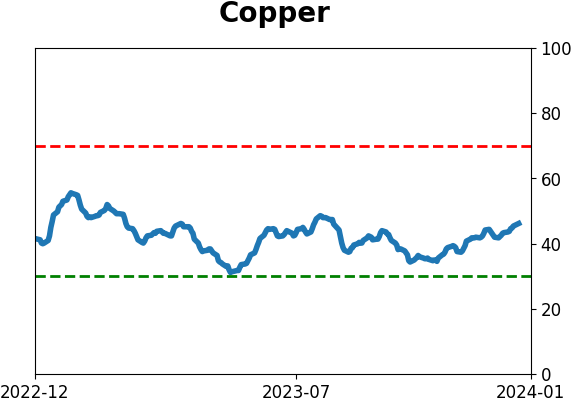
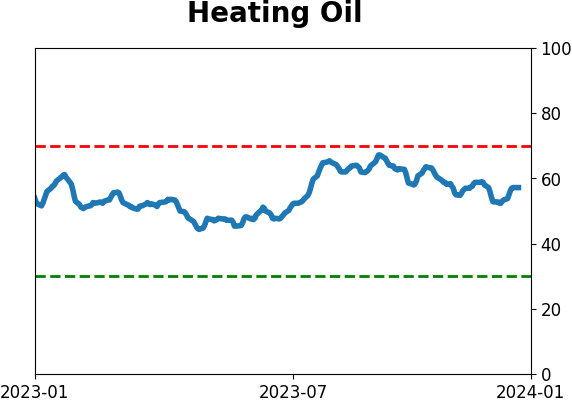
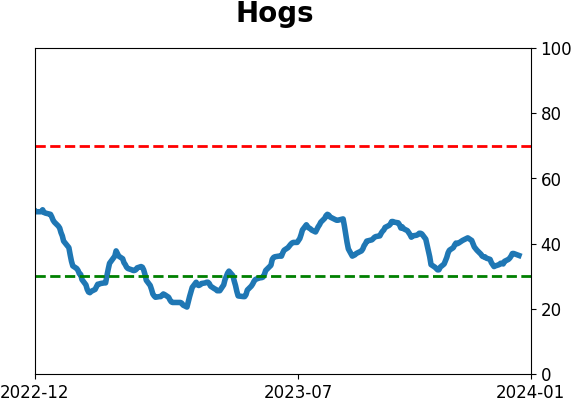
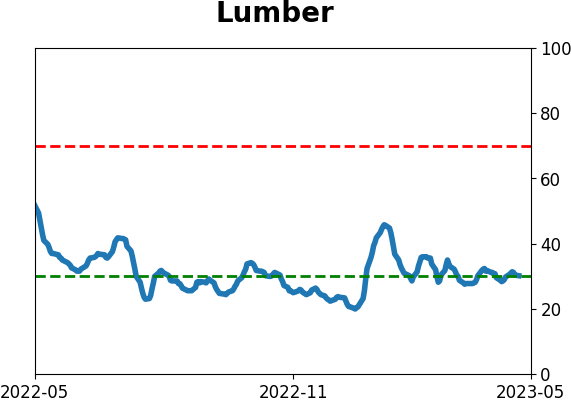
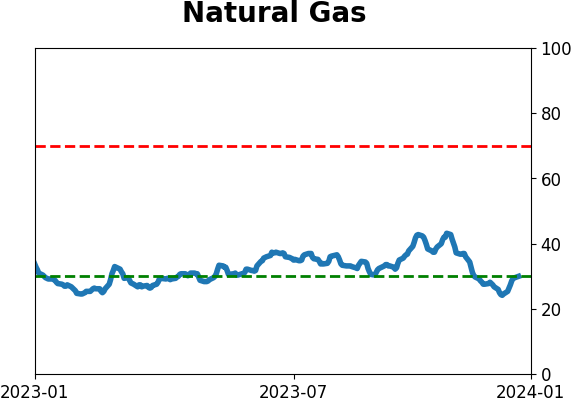
Commodity ETF's - 5-Day Moving Average
|
|