Daily Report : TradingEdge Weekly for Dec 22 - Breakouts everywhere, internal momentum, reversal signals

| View/Print a PDF version of this Report |
Headlines
|
TradingEdge Weekly for Dec 22 - Breakouts everywhere, internal momentum, reversal signals: This week, we saw that Small Caps broke out to a 1-year but not 2-year high, the Dow reached a record ahead of the other major indexes, and the S&P 500 equal weight index cycled from 1-year low to 1-year high in near-record time. All of those factors typically precede even higher prices. Real estate is heading into a nice short-term window, as is platinum. |
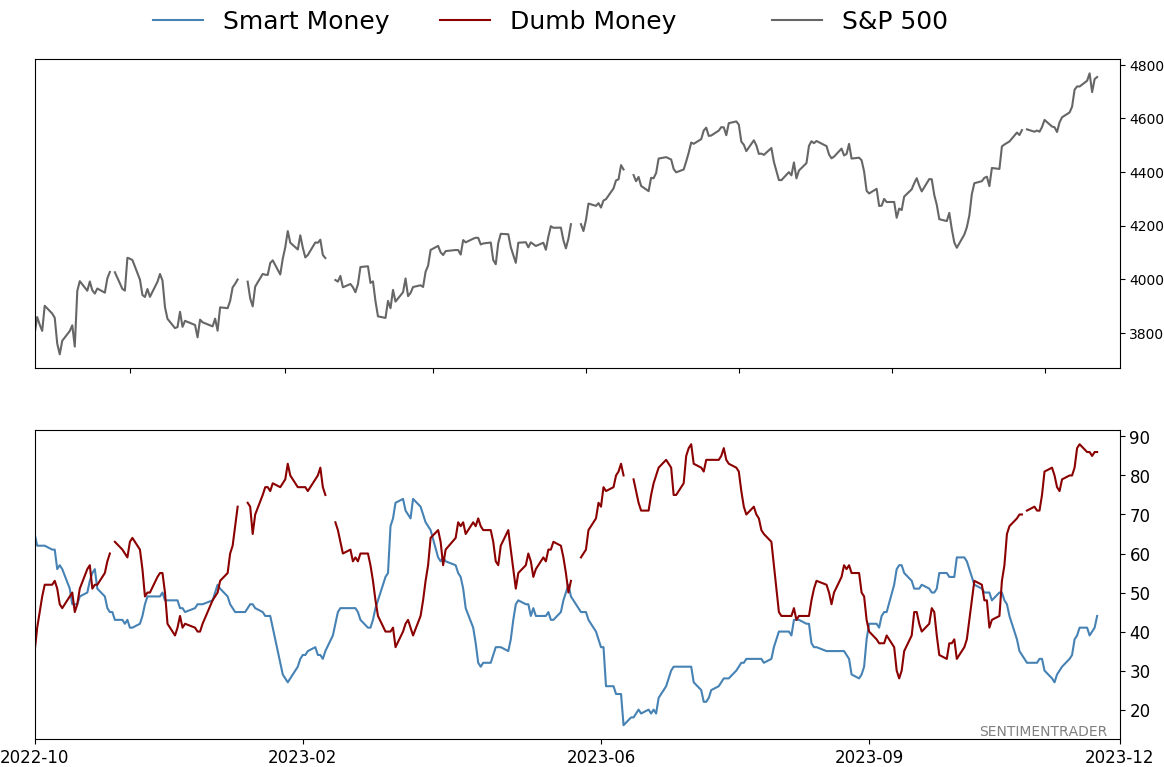
Smart / Dumb Money Confidence
|
|
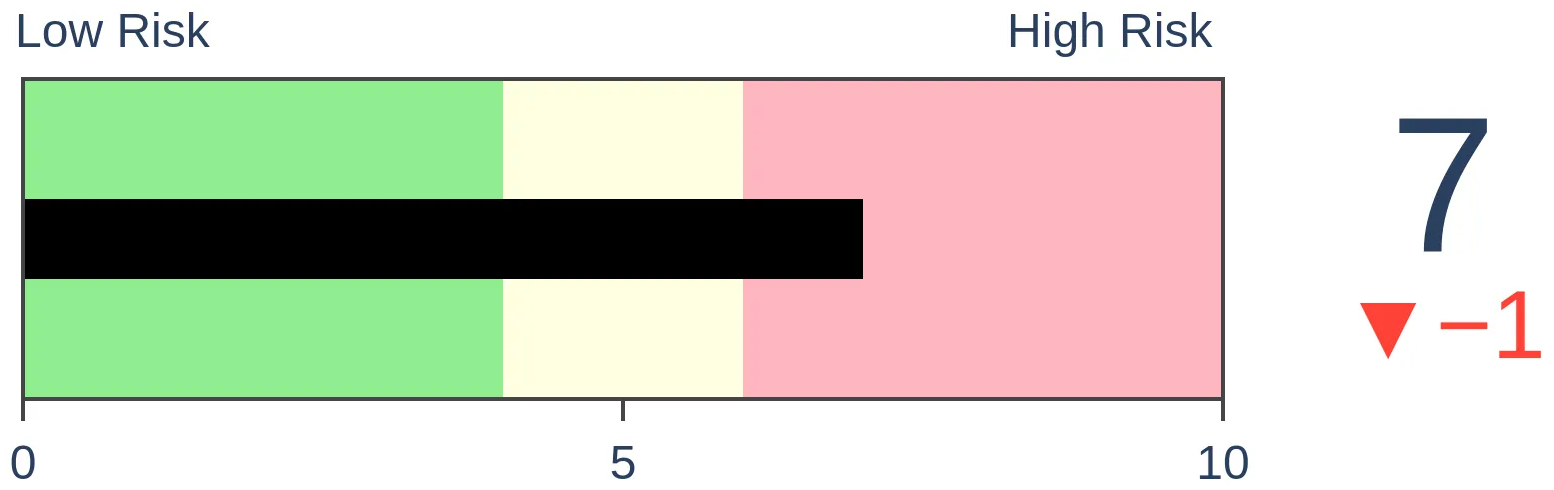
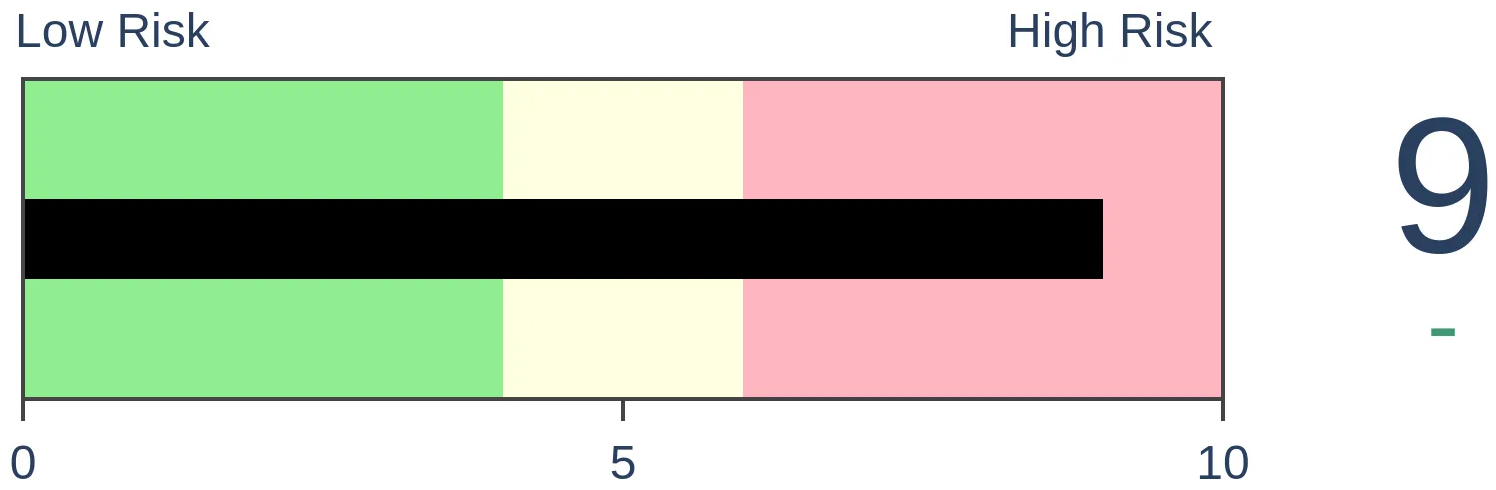
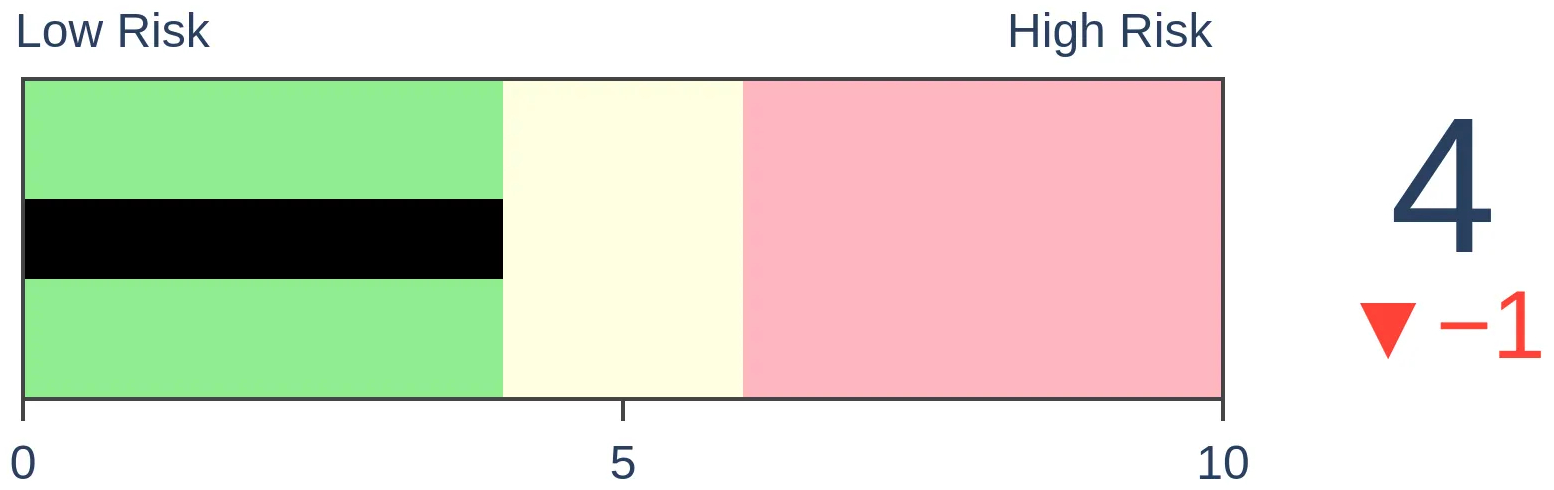
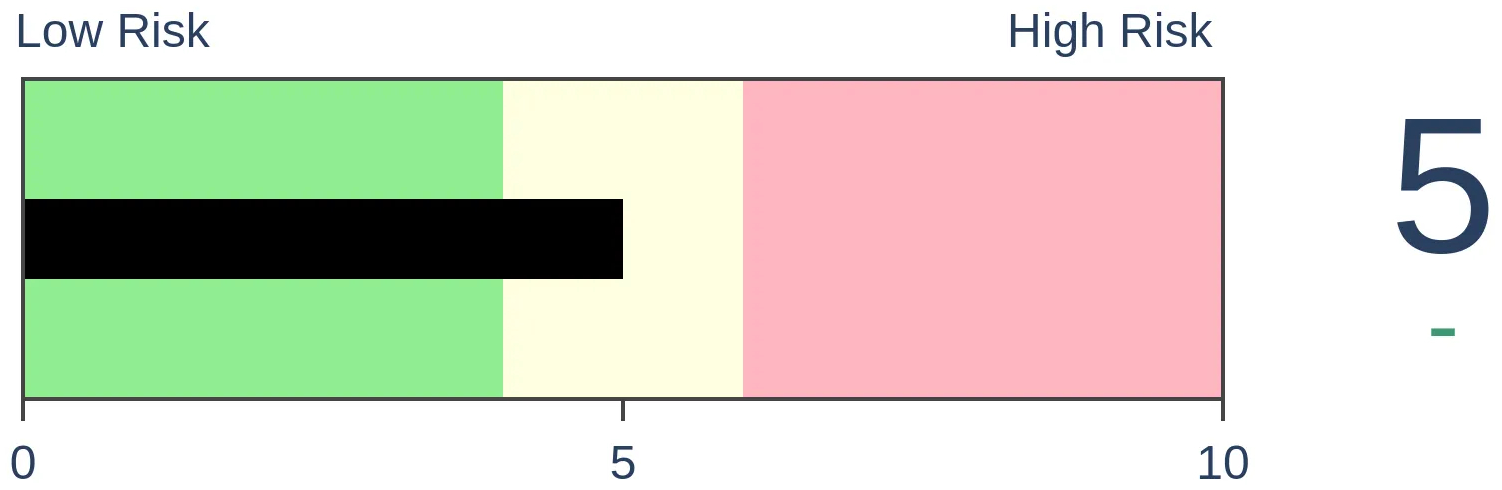
Risk Levels
|
|

|

Research
TradingEdge Weekly for Dec 22 - Breakouts everywhere, internal momentum, reversal signalsBy Jason GoepfertBOTTOM LINEThis week, we saw that Small Caps broke out to a 1-year but not 2-year high, the Dow reached a record ahead of the other major indexes, and the S&P 500 equal weight index cycled from 1-year low to 1-year high in near-record time. All of those factors typically precede even higher prices. Real estate is heading into a nice short-term window, as is platinum. FORECAST / TIMEFRAME |
Key points:
- Small cap stocks broke out to a 1-year (but not 2-year) high
- The Dow Industrials hit a record high, with excellent internal participation, which typically leads other major indexes higher
- The S&P 500 equal weight index quickly cycled from a 52-week low to 52-week high
- The S&P is overbought, and suffered some (very unreliable) reversal signals
- More than 90% of stocks in the S&P 1500 index are in medium-term uptrends
- Not all indicators are quite so bullish
- The German DAX has seen an internal surge among its stocks similar to the Dow Industrials
- The last five days of the year have been especially good for real estate
- It's time to keep an eye on platinum
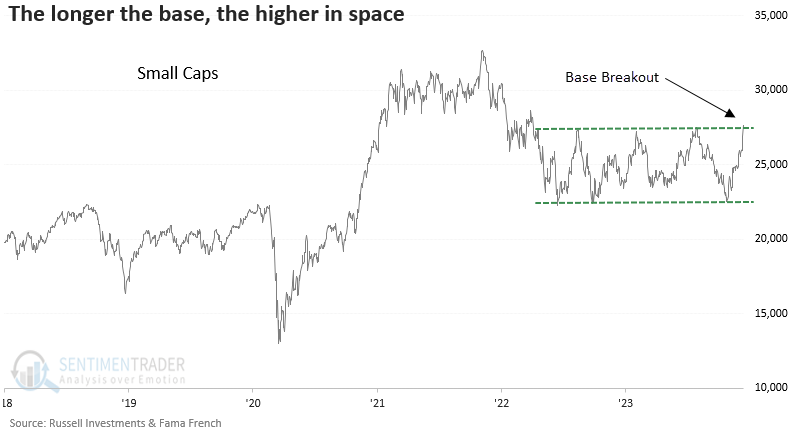
The little guys break out
Small caps closed at a 1-year high but not a 2-year high, completing a base breakout. Dean showed that similar patterns led to a consistent upward bias in the small-cap index over the subsequent year.
With numerous small-cap stocks registering one-, three-, and twelve-month highs last week, the bullish price action from individual stocks contributed to a new 1-year high in the Russell 2000 Total Return Index. For only the 26th time since 1932, the small-cap index closed at a 1-year high but not a 2-year high, completing a base breakout pattern after recording a 1-year low as recently as October.
Small caps show a consistent upward bias over all time horizons after similar behavior. While the previous signal failed miserably, 63-day highs for index components were only 22% compared to the 48% reading from last week.
Since the 1929-49 secular bear market, the small-cap index was higher a year later in 16 out of 18 precedents.
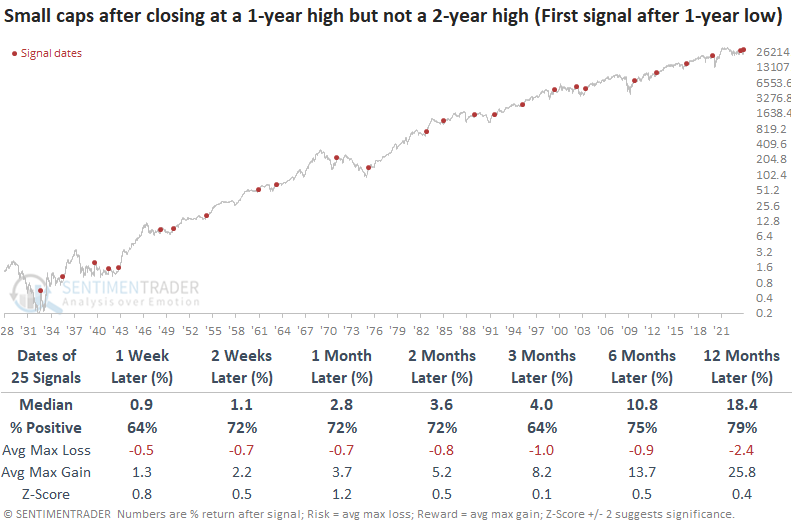
What works well for small-cap stocks tends to be advantageous for large-cap stocks, too. Over the following year, the large-cap index was up 83% of the time, slightly edging out the 79% win rate for small caps.
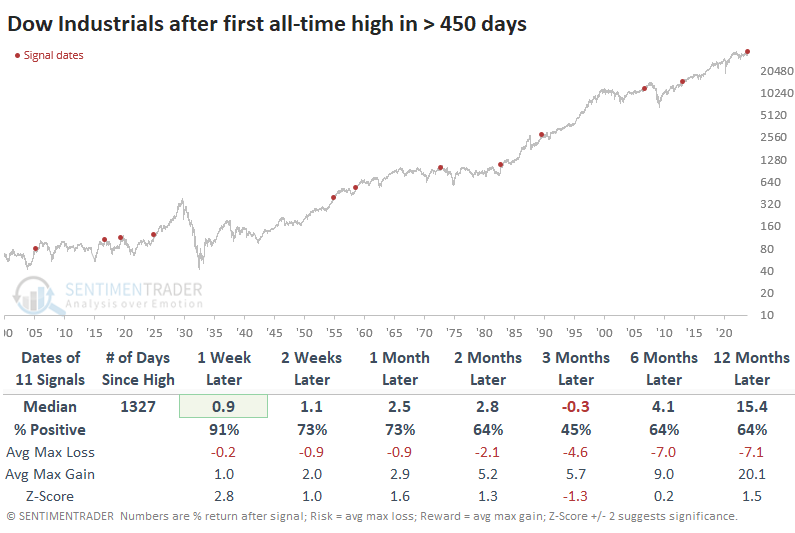
And the big guys hit a record high
The old general finally did it, too - the Dow Jones Industrial Average reached a new all-time high. It was the first record close in nearly two years, which ended one of the longer streaks since 1900.
After the first new high in at least 450 trading sessions, the Dow continued to gain for the next week with only one exception but then often faltered. Three months later, it had added to its gains less than half the time, with a poor median return. Over the next year, however, it enjoyed double-digit gains after 7 of the 11 instances.
One of the points that bears have loved to mock this year has been that all the gains have been due to a handful of stocks. That is demonstrably untrue, as we've discussed multiple times.
One more example of how fruitless that line of anxiety has been is that one of the best measures of the momentum of underlying participation, the McClellan Summation Index, has soared to a multi-year high for the Dow Industrials.
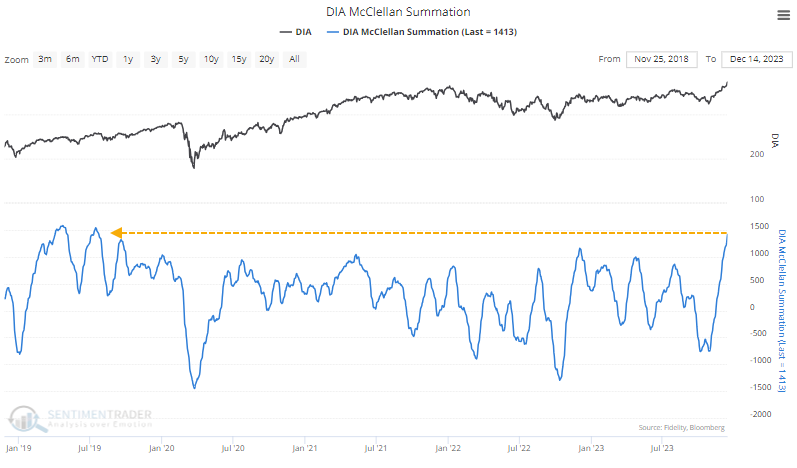
It had been more than 1,000 sessions since the Dow's Summation Index last reached a multi-year high. That's one of the longest streaks in 60 years. After the Summation Index carved out a new multi-year high, the Dow tended to give back some gains over the next month. Only one of the signals didn't pull back at some point over the medium-term. But all of them showed double-digit gains over the next year.
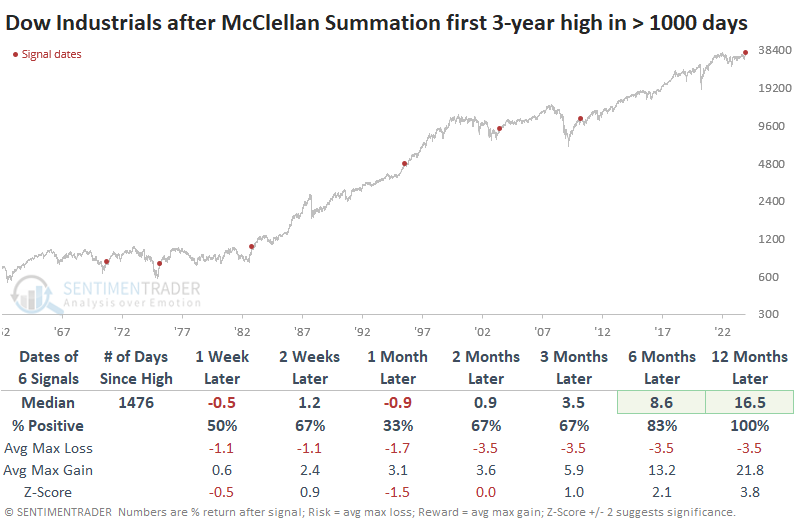
It's tough to rely too heavily on such small sample sizes, but the table below expands the sample a bit by looking at shorter times between new highs in the Summation Index. The conclusions are pretty much the same.
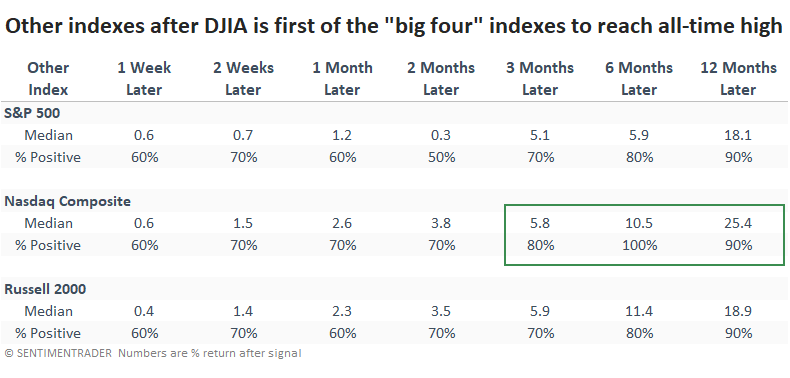
There is some worry that the Dow Industrials is the only index out of the "big four" (DJIA, S&P 500, Nasdaq Composite, and Russell 2000) to reach a new all-time high.
Short- to medium-term returns were nothing special after similar behavior, but the Dow rose all but once over the next 6-12 months. It was even less of a worry for the Nasdaq. Over the next six months, it sported a gain every time, averaging more than +10%.
The average stock is doing just fine, thank you
We're all probably tired of reading about the idea that this year has been dominated by only seven stocks.
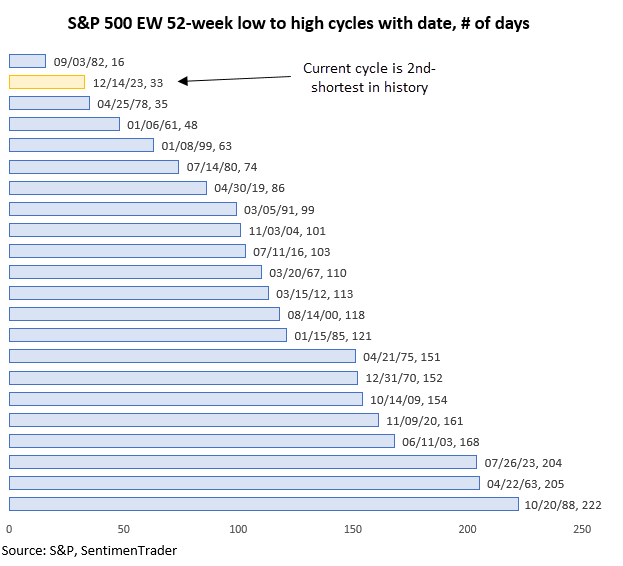
It's an interesting narrative with a catchy name, and that's all it takes for financial media anymore. The fact is that the average stock in the S&P 500 has just cycled from a 52-week low to a 52-week high in barely more than a calendar month. That's an almost unprecedented success.
The S&P 500 equal weight index gives the same weight to all 500+ stocks, as opposed to the capitalization weight index that is cited everywhere and that weights larger stocks more heavily. That equal weight index just went from a 52-week low to a 52-week high in 33 trading days. The only low-to-high cycle that happened faster was at the best bottom of all time, in September 1982.
The table below shows every time the equal weight index cycled from a 52-week low to a 52-week high, regardless of how long it took. And it was a good sign for the average stock, which added to its gains over the next six months every time.
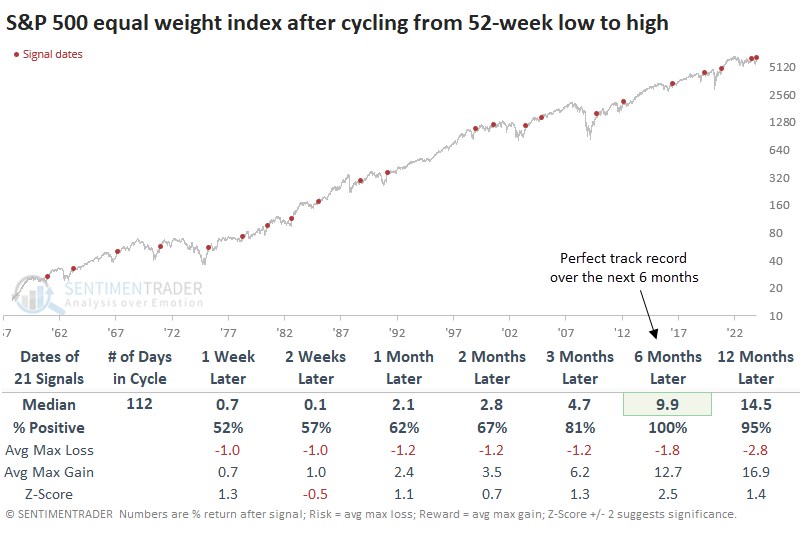
After these signals, the index suffered more than a -10% drawdown within the next six months only once, which is remarkable. The median drawdown was a minuscule -1.8%, while the median drawup (maximum gain) was nearly +13%.
The capitalization weight version of the index also did well after the average stock cycled from a low to a high. However, it suffered one loss over the next six months as the internet bubble burst and some big tech companies dragged the index lower.
If it weren't for the pandemic in 2020, the quickest low-to-high cycles would have a perfect one-year record of gains. As it stands, the few times the equal weight index took 90 days or fewer to cycle to a new high ended up leading to 3-6 month rallies each time, with a ridiculously positive risk-to-reward ratio.
Overbought with reversal signals
Dean noted that the Relative Strength Index (RSI) for the S&P 500 rose above 82, indicating an overbought condition and some reversal signals soon followed.
Over the past few days, market gurus have been vocal about the Relative Strength Index (RSI) surging into an extremely overbought status, the ominous outside day reversal bar, or the staggering increase in downside volume. Of course, none of the click-bate comments provide supporting evidence.
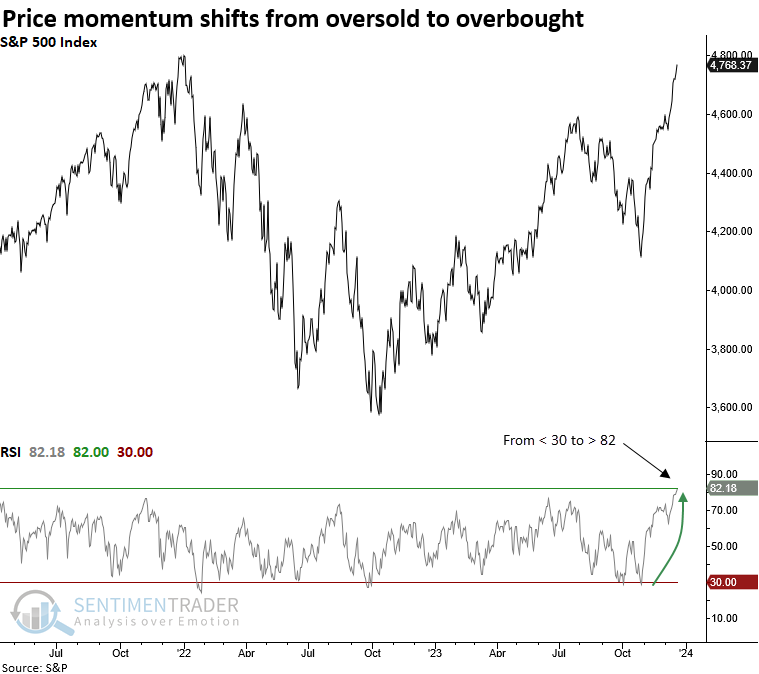
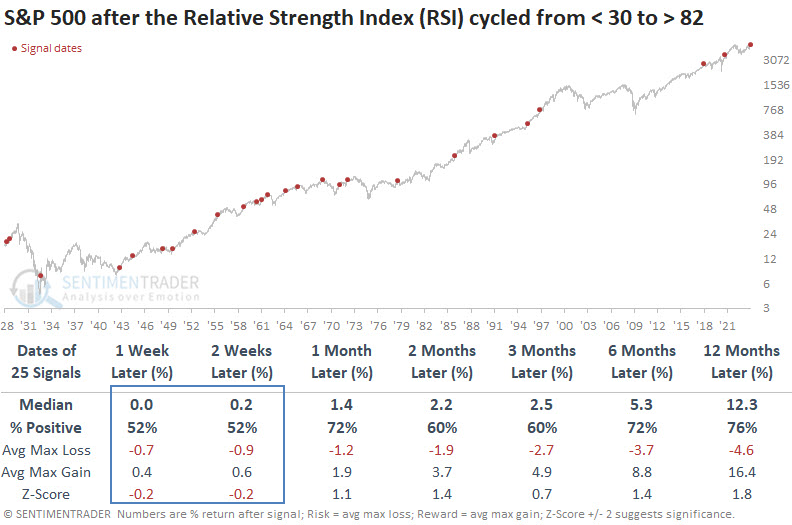
Whenever the Relative Strength Index (RSI) for the S&P 500 cycled from less than 30 to greater than 82, history suggests the large-cap index may experience a brief slowdown in the following weeks. However, the pause tends to refresh the uptrend, with the world's most benchmarked index rising consistently from one to twelve months later.
The NYSE suffered its first greater than -9/1 up/down volume ratio reading since March. However, this precedent occurred one day after the S&P 500 closed at a 1-year high, an event rarely seen since 1950.
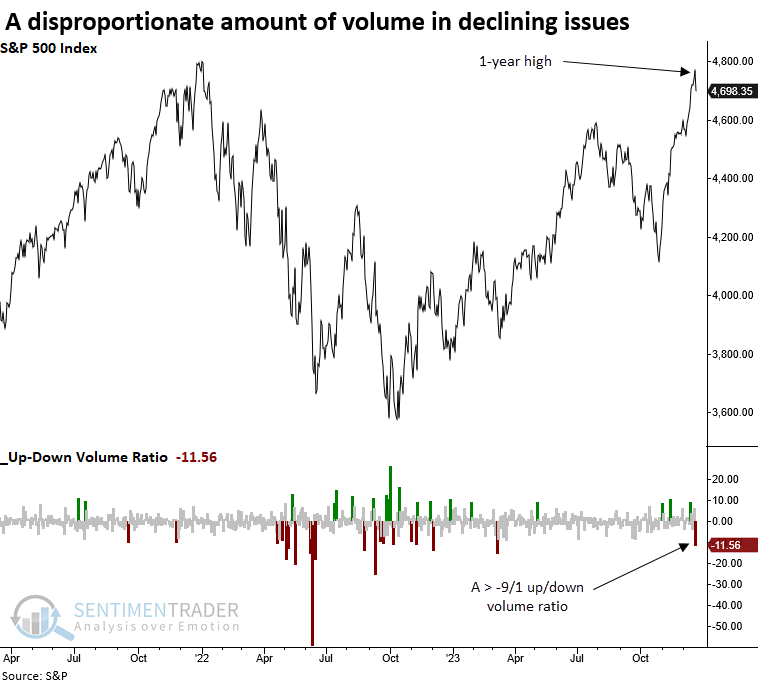
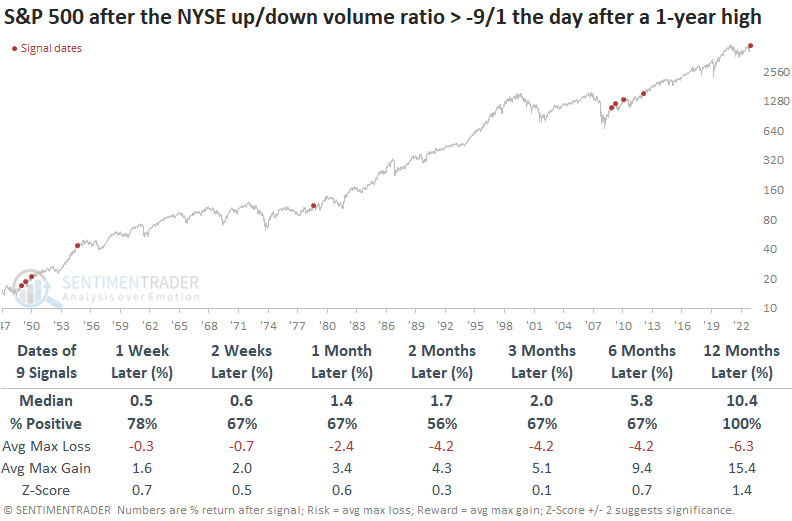
While the sample size is small, the S&P 500 tended to bounce back after similar one-day volume skews after a 1-year high. Over the subsequent month, the S&P 500 showed a gain at some point in every instance, albeit one precedent was minimal. A year later, the world's most benchmarked index was higher 100% of the time.
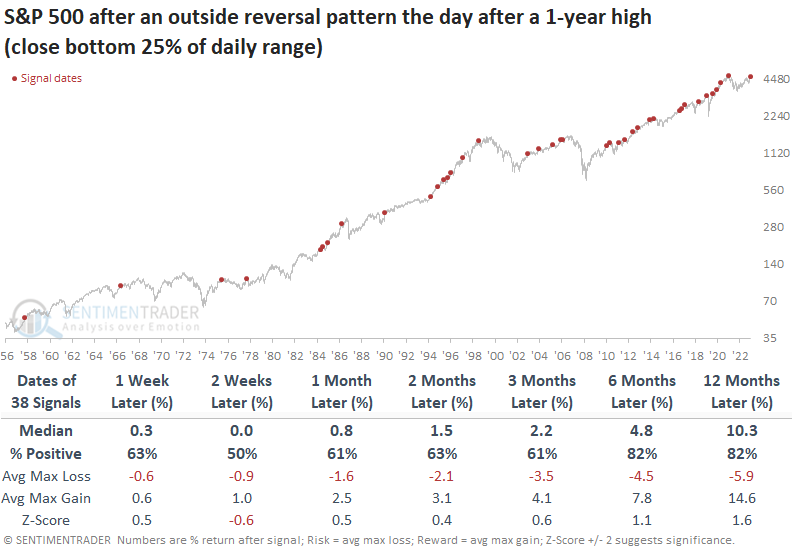
The S&P 500 reversed lower on Wednesday, triggering an outside day. This pattern emerges when the current bar registers a high greater than the previous day's high, accompanied by a low that is less than the low of the prior session.
When an outside day pattern occurs with the S&P 500 closing in the bottom 10% of its daily range, the one-day pattern tends to be a non-event. When it closes in the bottom 25% of its range, you get a coin toss win rate over the following two weeks with a return below the study period average. Six and twelve months later, the S&P 500 was higher 82% of the time.
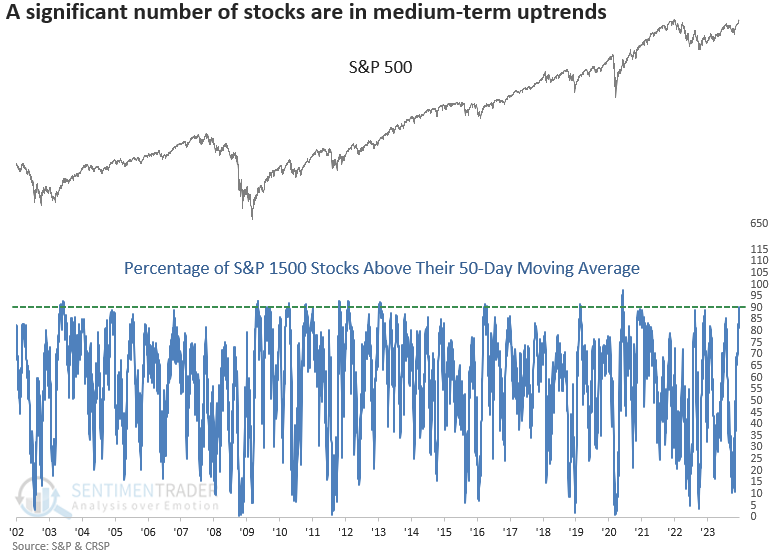
A whole lot of medium-term uptrends
Over 90% of S&P 1500 stocks closed above their respective 50-day moving average. Dean showed that after similar thrusts, the S&P 500 was higher 96% of the time over the subsequent six months and the equal-weighted S&P 500 tended to outperform the cap-weighted version.
On Tuesday, the percentage of S&P 1500 stocks closing above their respective 50-day average increased above 90% for only the 26th time since 1962. The previous signal occurred in May 2020, leading to a substantial stock rally.
Whenever the percentage of S&P 1500 stocks trading above their 50-day moving average increases above 90%, the S&P 500 displayed outstanding results across all time frames. Three and six months later, the world's most benchmarked index was higher in all but one precedent. A year later, it was higher in all but two cases.
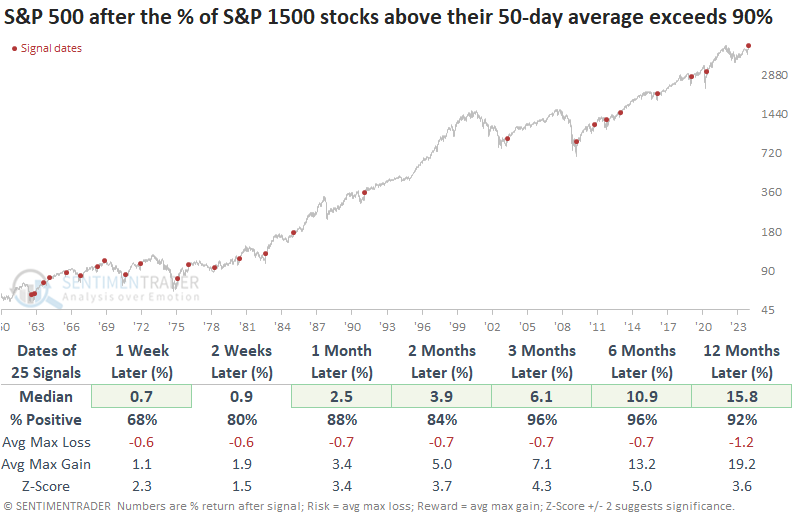
Over the following twelve months, the S&P 500 experienced only one loss exceeding -10% and five more significant than -5%. The median drawdown was a minuscule -1.2%, while the median drawup (maximum gain) was +19.2%.
For the equal-weighted S&P 500, where each of the 500 stocks holds an identical weight, the forward return outlook was even more impressive with a median return of +18.8 and only one loss.
Comparing the two index weighting methodologies suggests investors would have been better off holding a position in the equal-weighted index, which is now easily attainable via an ETF like RSP.
While the outlook for all sectors and industries was bullish, cyclical-oriented stocks tended to outperform defensive ones.
Not every indicator is showing a rosy outlook
Jay showed a couple more indicators flashing positive signs for stocks but also noted that two time-tested warning signs started flashing yellow.
The HiLo Logic Index was created by Norman Fosback in 1979. Intended as a way to observe split market conditions, it looks for times when there are both a large number of 52-week highs AND 52-week lows among securities on the exchange. When there are a lot of both, the market is severely split between winners and losers, and it tends to be negative for stocks.
The chart below highlights those dates when the 10-day average for the Nasdaq High/Low Logic Index crossed above 2.5 in the last 20 years.
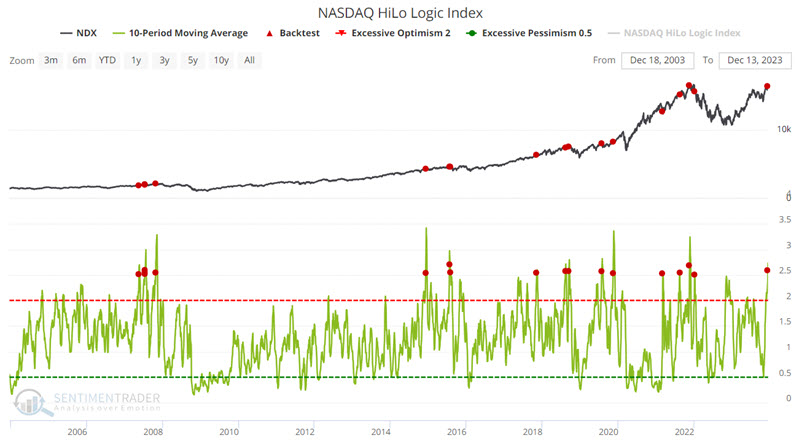
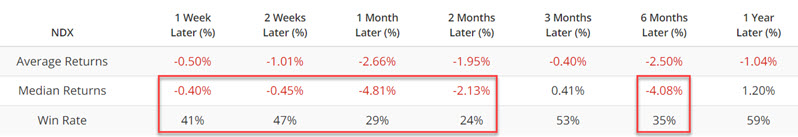
Historical performance is notably poor on average over 1, 2, and 6-month periods. Note also that Win Rates of 24% to 35% suggest a strong tendency for weakness but are by no means a sure thing.
Bill Omaha created the Titanic Syndrome in the 1960s. It highlights a technical market condition when stocks have recently been at a high, and then there is a sudden jump in new 52-week lows versus highs on the Nasdaq. It is a warning sign that typically precedes trouble over the next 1-3 months.
The chart below highlights all dates when the 150-day average for this indicator was above 0.1.
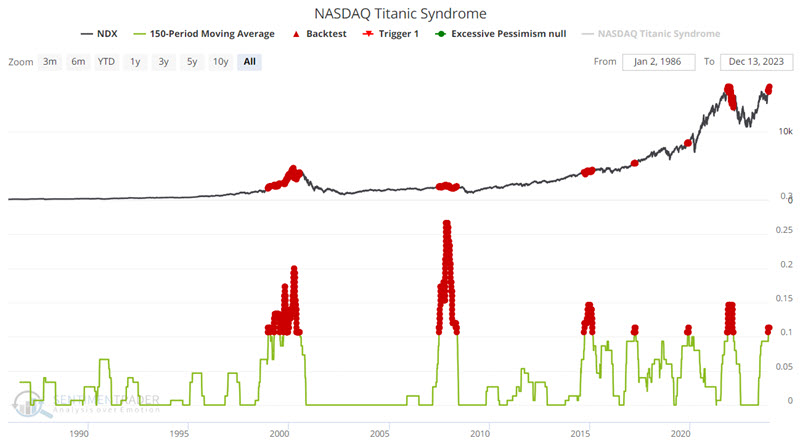
A 36% 12-month Win Rate is far below the historical average. Once again, the message here is not that investors should sell everything and hunker down. The real message is to avoid the temptation to become even more ensconced in a bullish mindset if the market continues to run to higher ground.
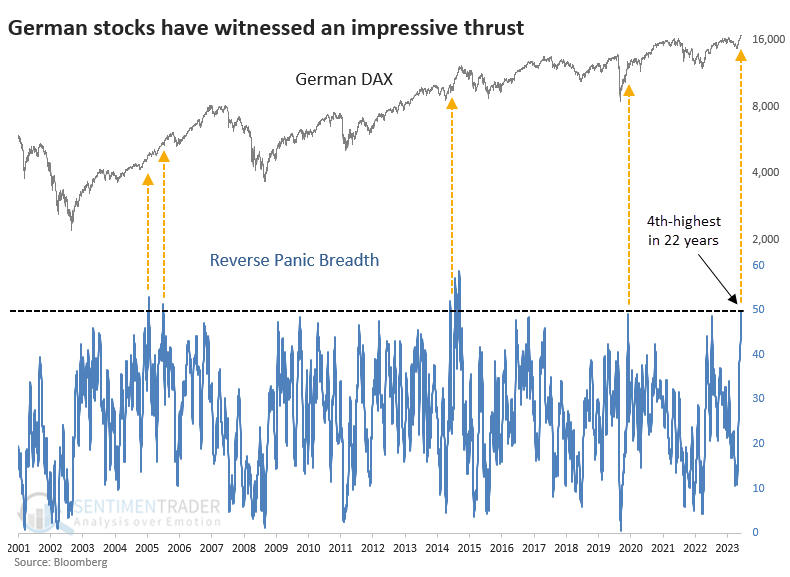
The German DAX gives the Dow a run for its money
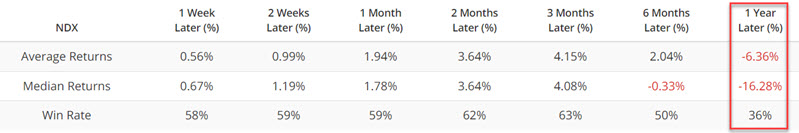
Similar to what we saw in the Dow Industrials above, the McClellan Summation Index for the DAX has jumped to its highest level in four years.
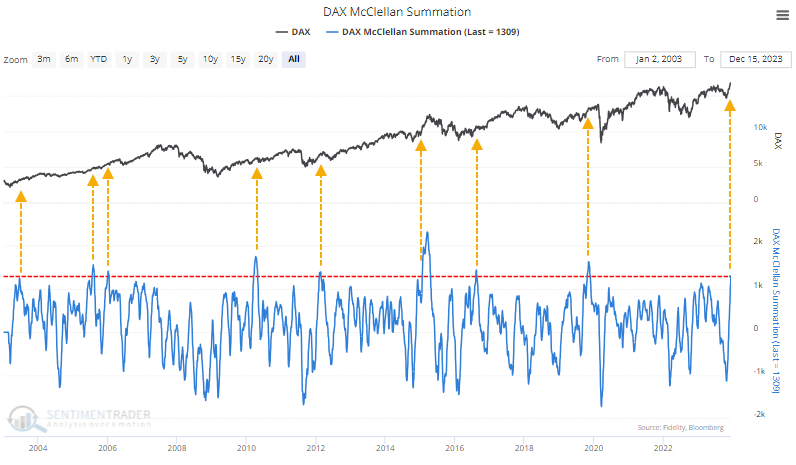
Returns in the DAX were pretty good after similar surges, mostly above average, and with an excellent risk-to-reward ratio. The pandemic interrupted what would have been a perfect record of gains in the six months following these signals.
The Summation Index is an excellent representation of long-term internal participation in an index. But other breadth metrics help flesh out the short- and medium-term behavior of stocks underlying an index or sector.
The Reverse Panic Breadth indicator monitors a half-dozen indicators of breadth, and over the past ten days, it has reached an extreme for the DAX. This composite just jumped to its 4th-highest level in 22 years.
If we relax the parameters, we can get a larger sample size. The table below shows other times when the composite exceeded 45%, which has triggered 11 times since 2001. Notably, the German DAX index added to its gains over the next six months every time, averaging +6.6%.
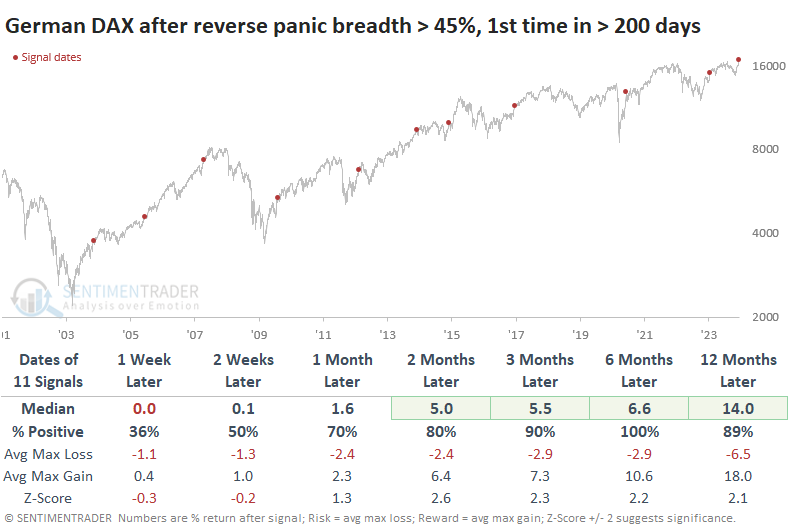
Because of currency fluctuations, returns for U.S.-based investors in the EWG fund were somewhat different, but not necessarily for the worse. The fund showed one loss over the next six months, but median returns from 3-12 months later were higher than for the DAX in euros.
A clear window for real estate
The last five trading days of the year have tended to be favorable for stocks. Jay showed that one sector that has stood out particularly is the real estate sector. For 2023, this period extends from the close on 2023-12-21 through the close on 2023-12-29
The table below displays performance stats for each of the major S&P 500 sectors and factors ONLY during the last five trading days of every year starting in 1926.
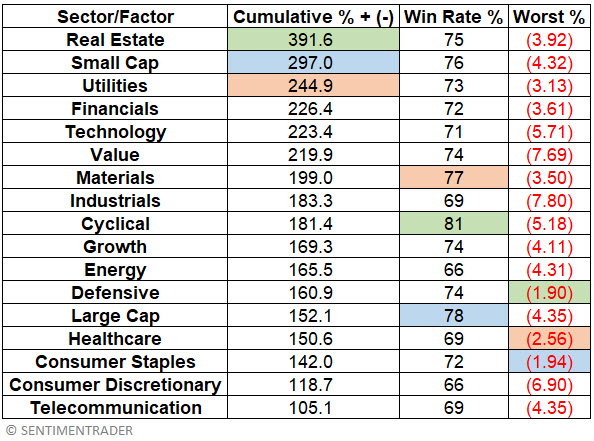
The results are ranked by cumulative growth. The results also show Win Rate % (i.e., the percentage of years when a sector/factor showed a gain during the last five trading days of the year) and Worst % (i.e., the worst single year-end performance). The top performer in each category is highlighted in green, the second best in blue, and the third best in orange.
The chart below displays the growth of $1 invested in the Real Estate sector only during the last five trading days of the year every year since 1926.
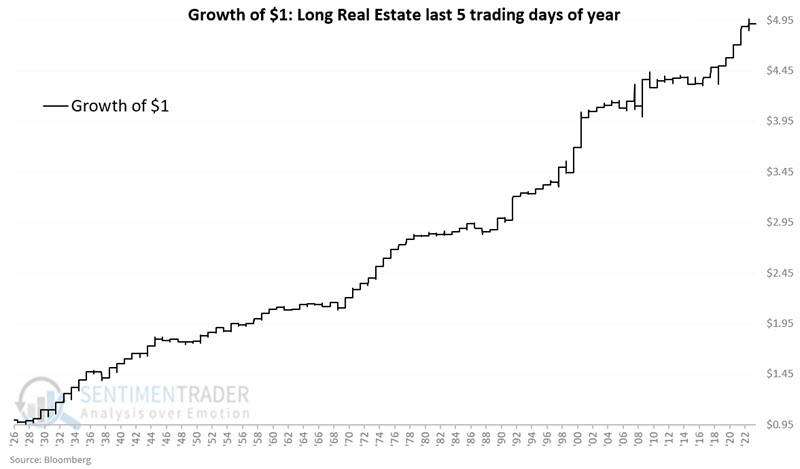
These periods showed a gain 75% of the time, with an average winner that was about twice as large as the average loser. More impressively, the sector gained more than +4% during 16 of the years, while never suffering a more than -4% loss.
There are several choices for a speculative trader wishing to play this seasonal trend, iShares U.S. Real Estate ETF (IYR) and Direxion Daily Real Estate Bull 3X Shares (DRN). IYR tended to show more consistent gains.
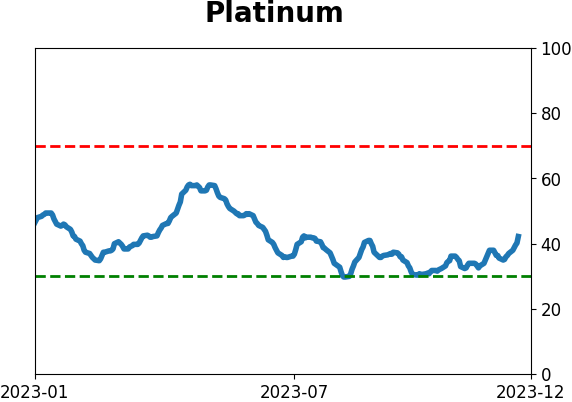
Platinum's time to shine
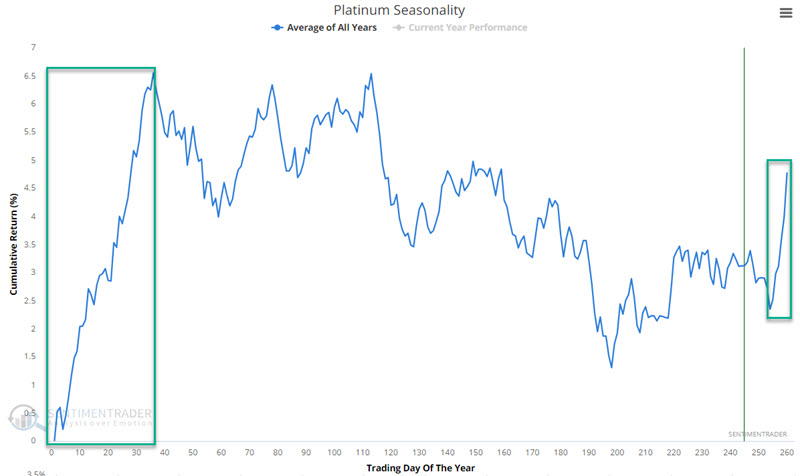
Late December into mid-February has historically been the most favorable time for platinum. Jay noted that the metal's performance during this period especially stands out compared to performance over the rest of the calendar year.
Platinum has been a poor performer for most of 2023. However, if history proves a reasonable guide, it may see some improvement in the weeks and months ahead. The chart below highlights the most favorable time of the year for platinum futures, extending from the close on Trading Day of Year (TDY) #254 through the close on TDY #36 of the new year. For 2023-24, this period extends for futures trading from the close of 2023-12-22 through the close of 2024-02-20.
For platinum futures, each point movement in the price of platinum is worth $50. The chart below displays the cumulative hypothetical $ gain or loss achieved by holding platinum futures during these seasonal windows starting in December 1987.
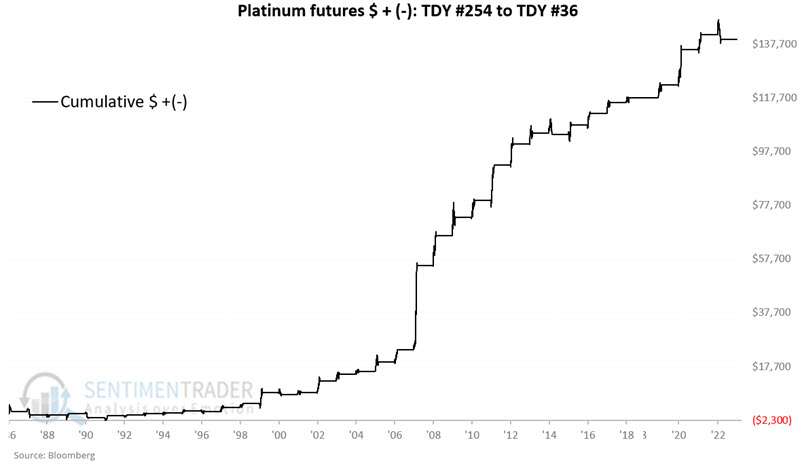
During these windows, the contract gained 86% of the time, with average gains far outpacing average losses. There were 18 years with gains of $2,000 or more versus no years with losses larger than $2,000.
The one glaring problem with the information above is that most individuals will never trade platinum futures. The abrdn Physical Platinum Shares ETF (ticker PPLT) is an ETF intended to track the price of platinum bullion.
Because this ETF does not trade electronically on market holidays like the futures contract we follow, it has fewer trading days in a typical year than the futures contract. As a result, the seasonally favorable period for PPLT is slightly different and includes the last five trading days of the current year through the first 33 trading days of the next year. This year, the favorable period for PPLT extends from the close on 2023-12-21 through the close on 2023-02-16.
Over the past 13 years, PPLT has returned +174% during seasonally favorable periods and -81% during all other trading days. As always, this guarantees nothing but is a good reminder of the importance of giving the bullish case the benefit of the doubt during the upcoming window - and to be careful to avoid trying to swim upstream the rest of the year.
About TradingEdge Weekly...
The goal of TradingEdge Weekly is to summarize some of the research published to SentimenTrader over the past week. Sometimes there is a lot to digest, and this summary highlights the highest conviction or most compelling ideas we discussed. This is NOT the published research; rather, it pulls out some of the most relevant parts. It includes links to the published research for convenience, and if you don't subscribe to those products, it will present the options for access.
Indicators at Extremes
|
|
|
Phase Table
|
|
|
Ranks
|
|
|
|
|
|
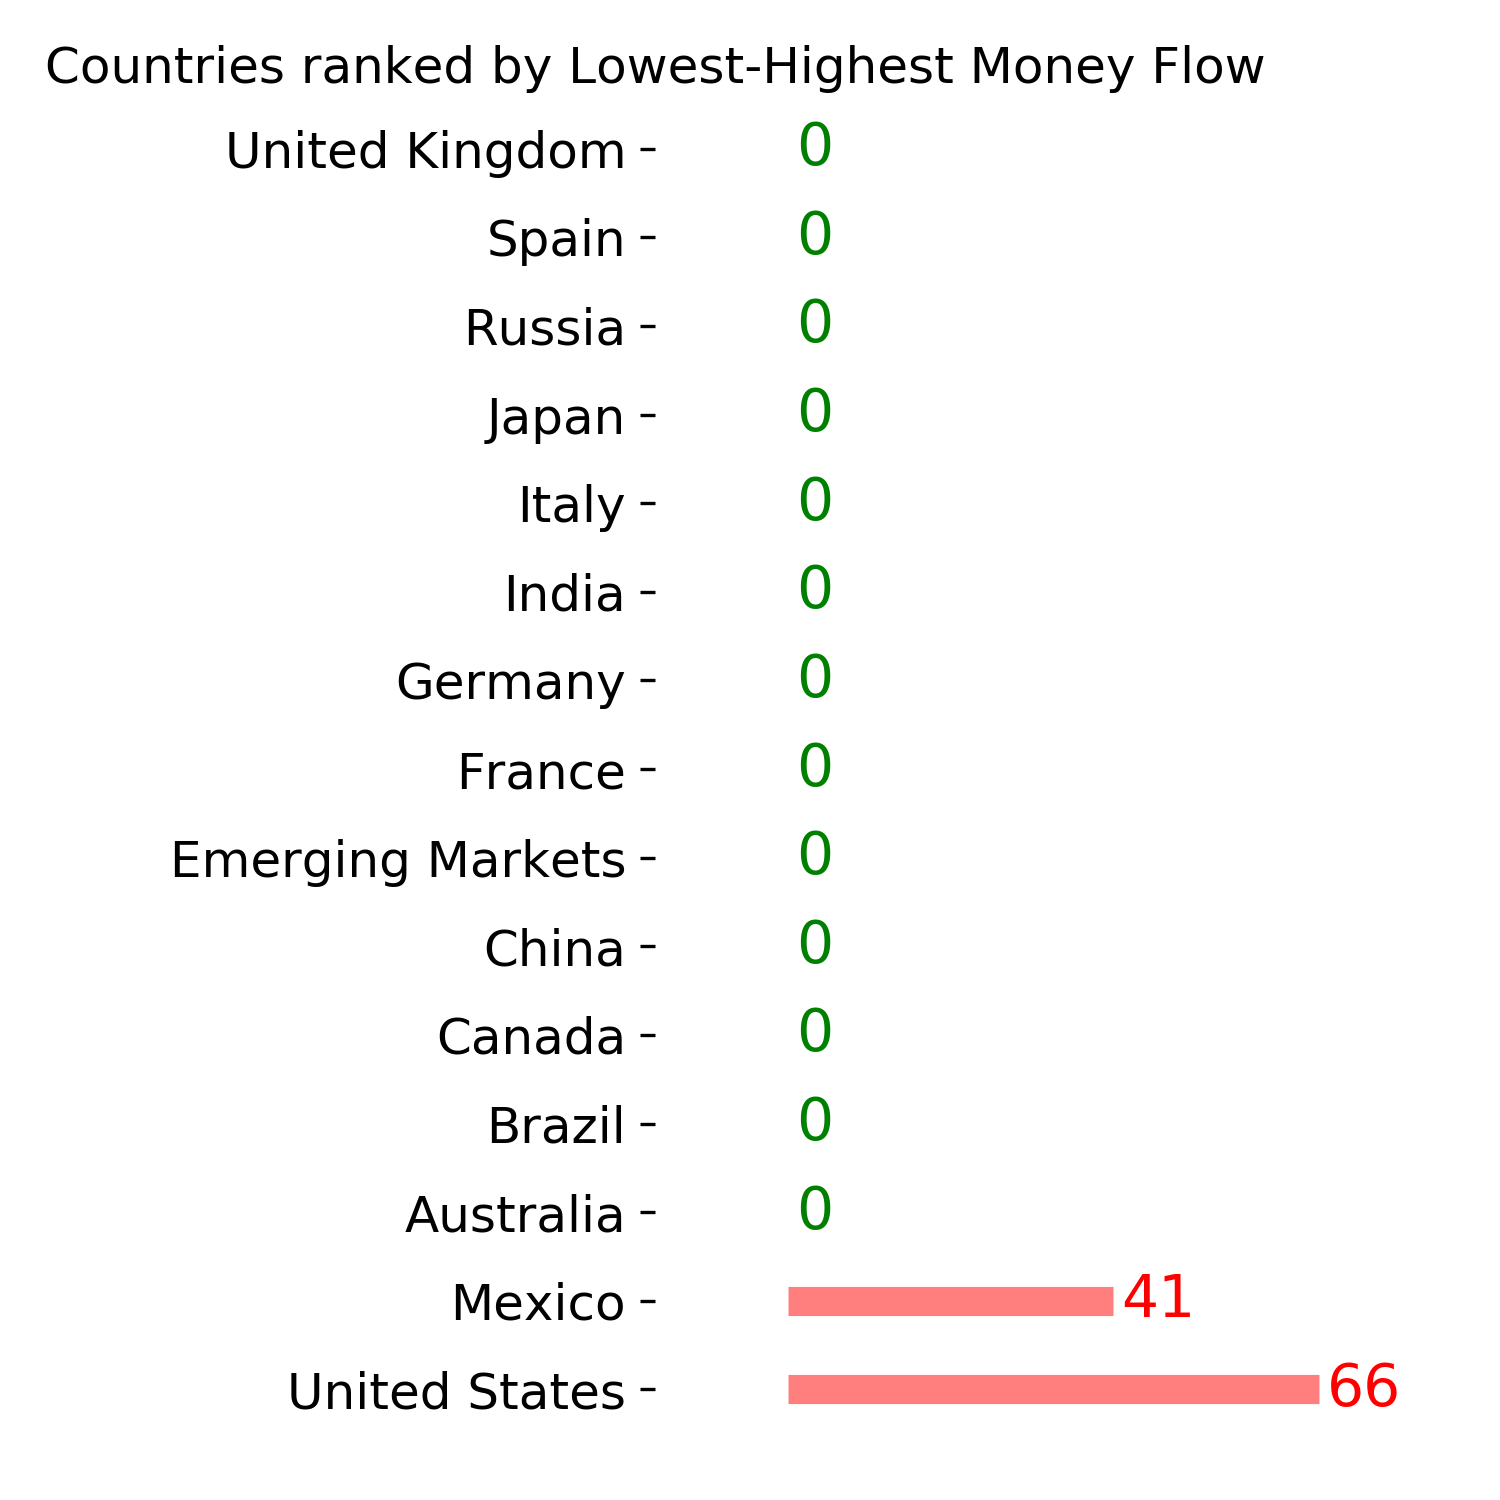
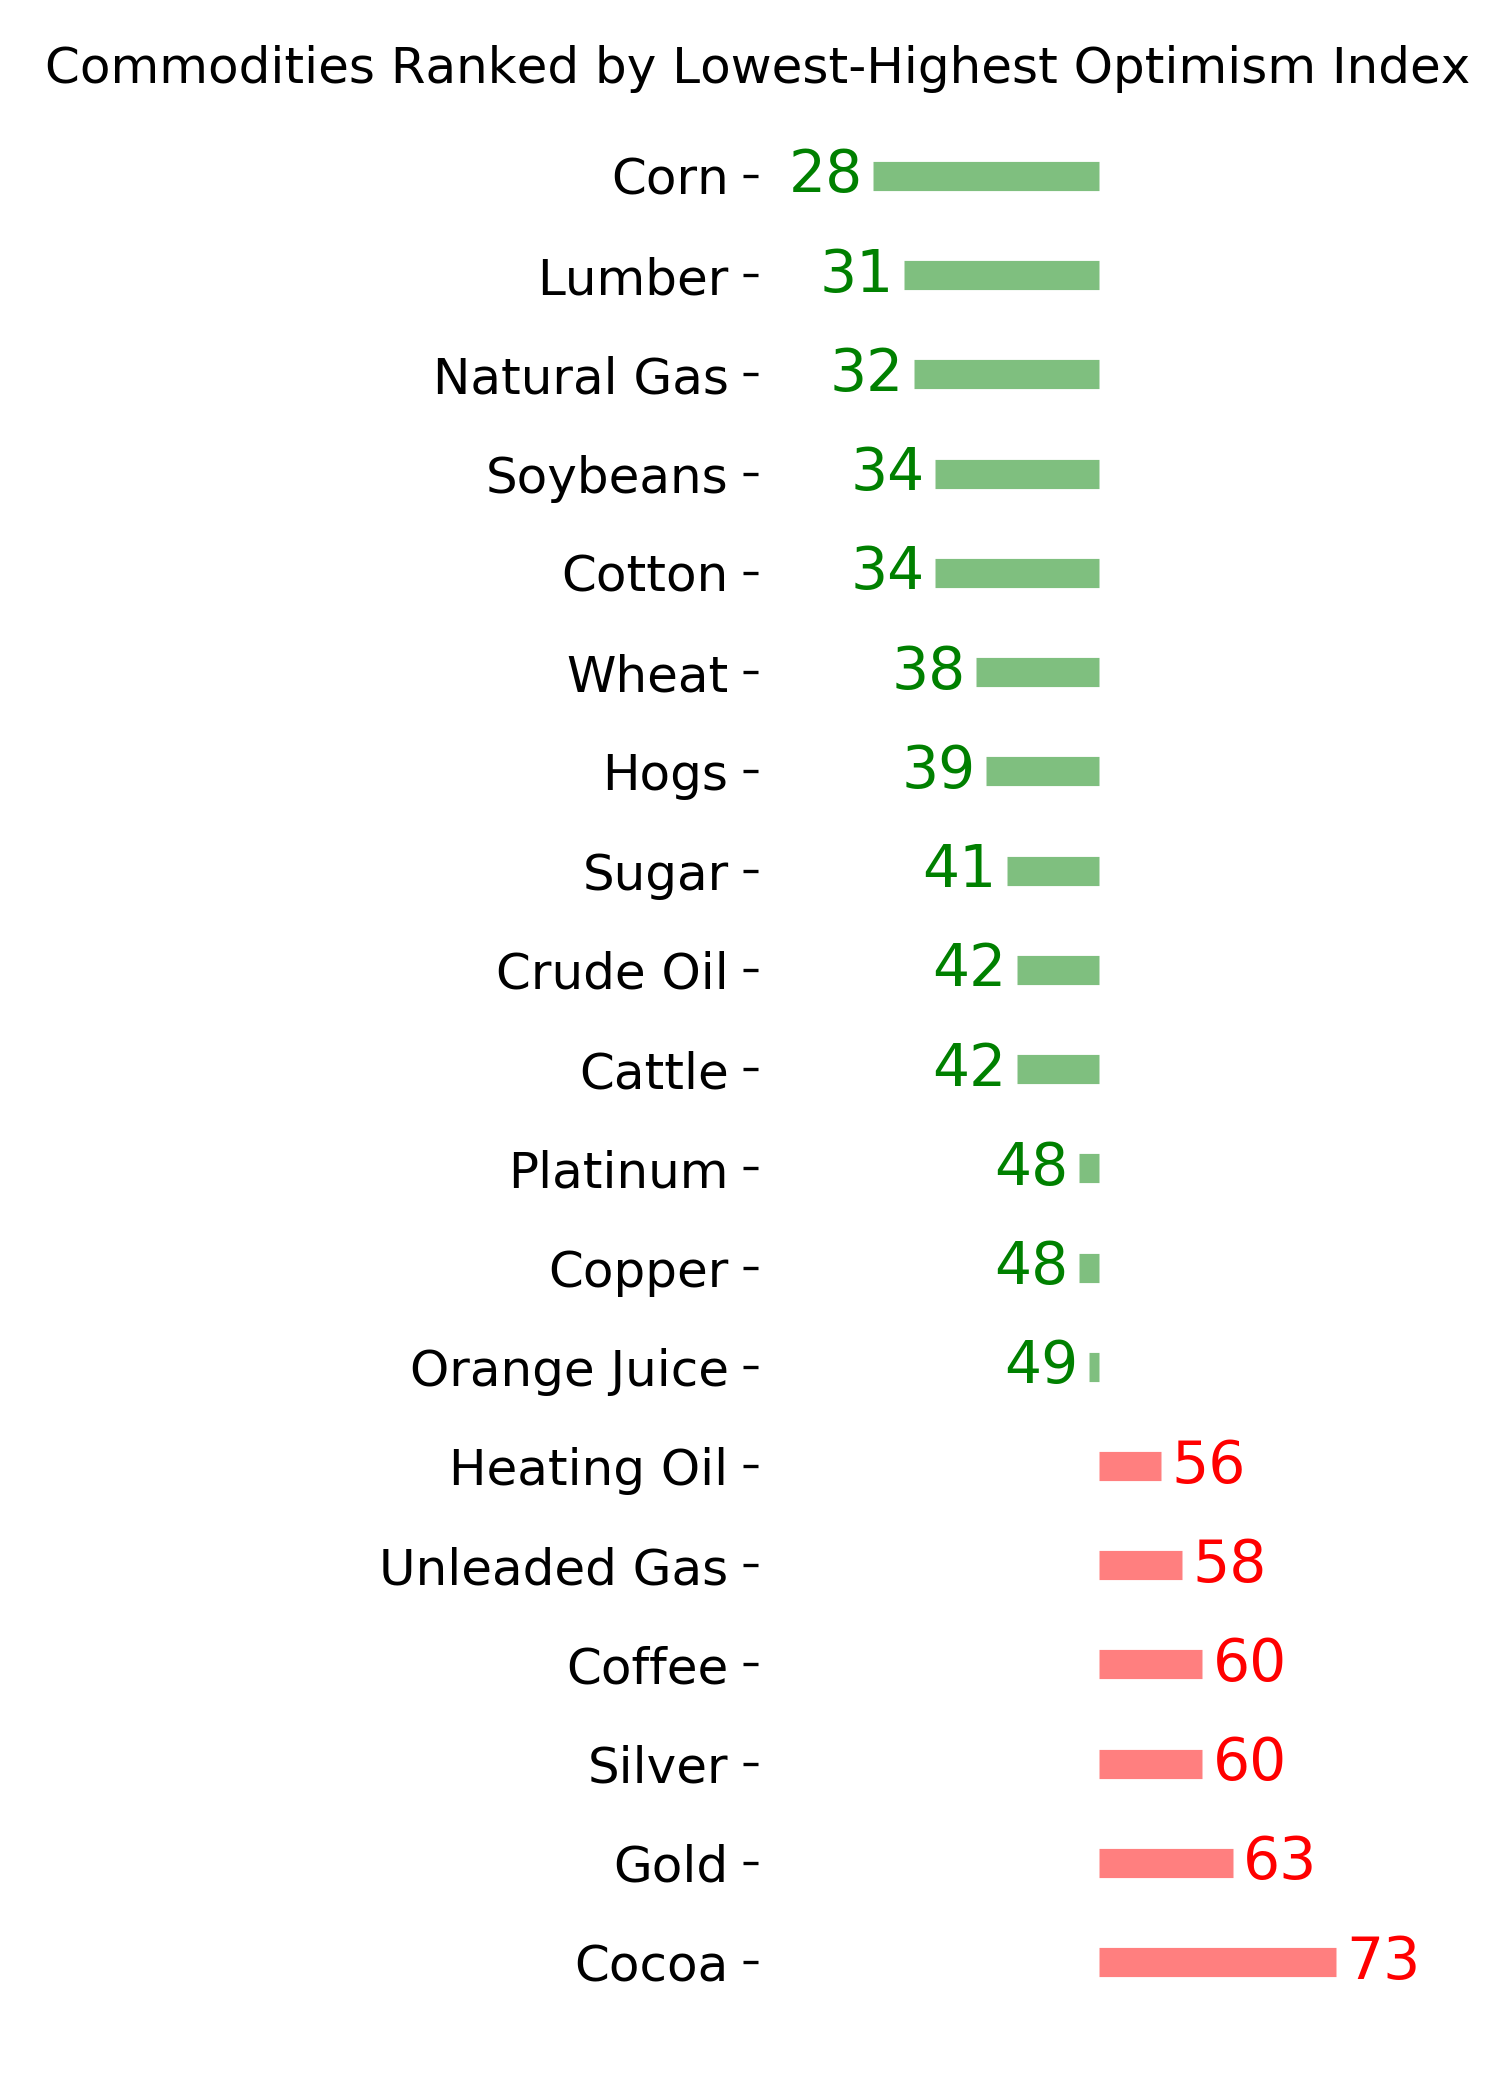
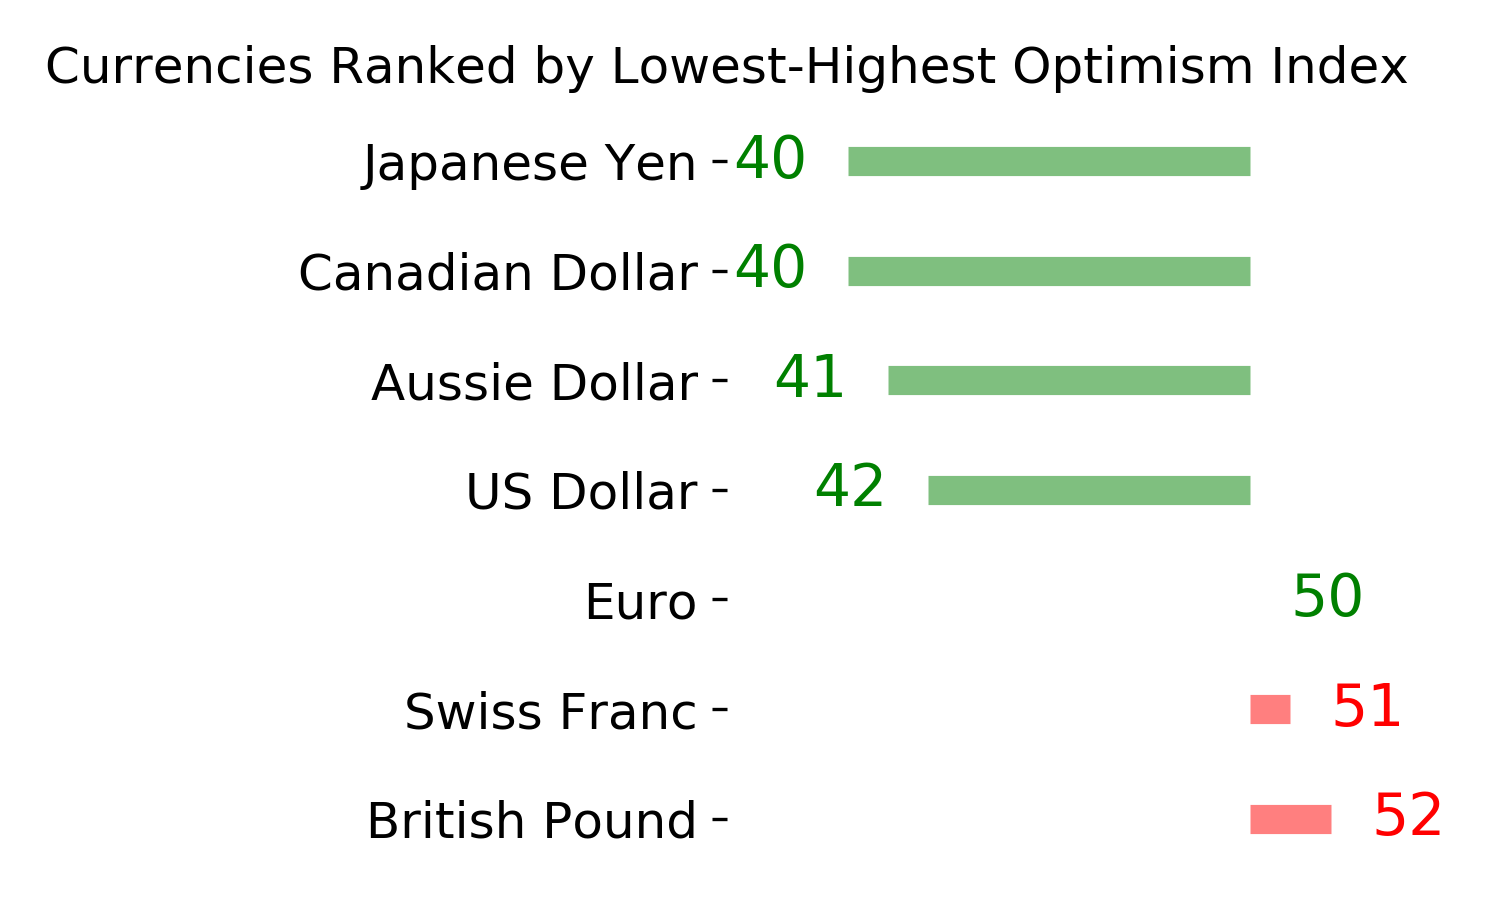
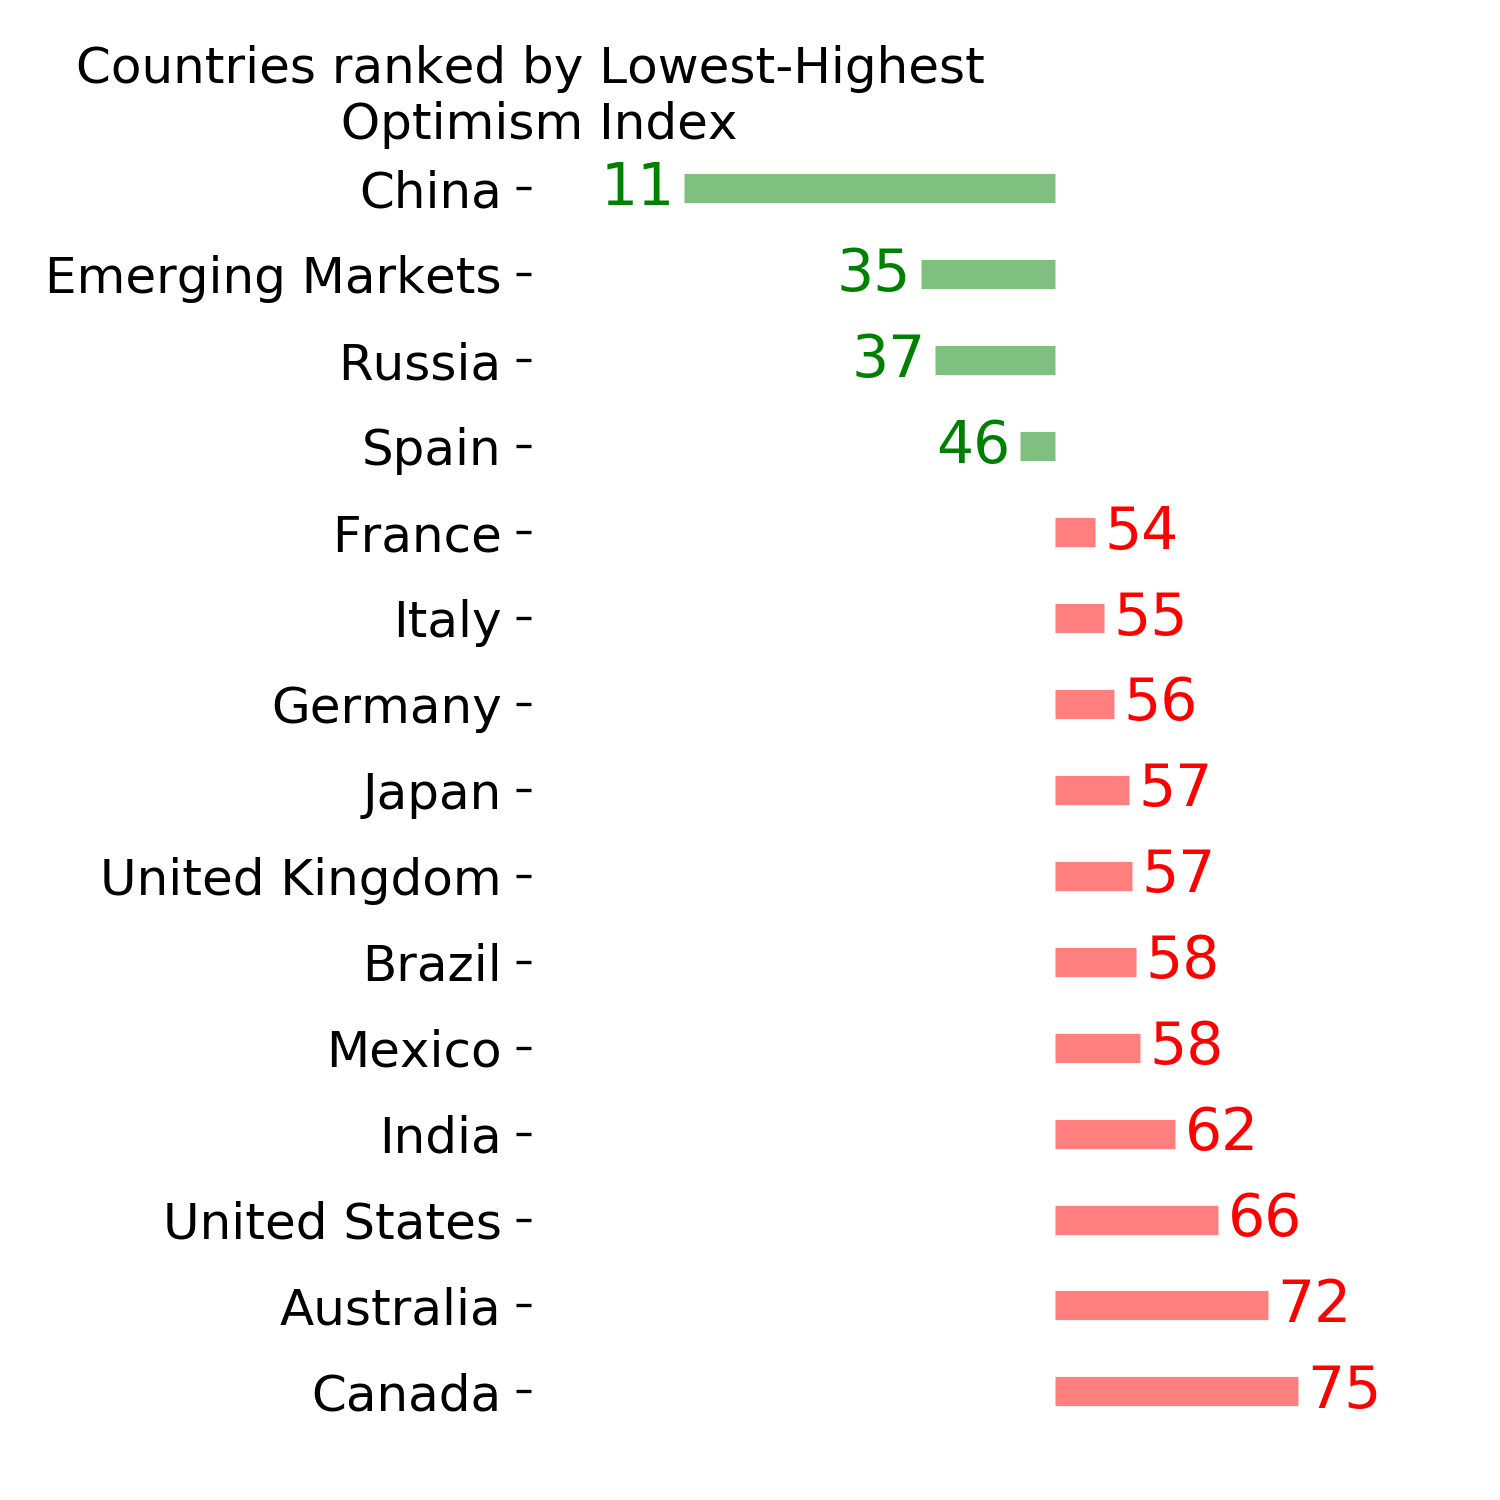
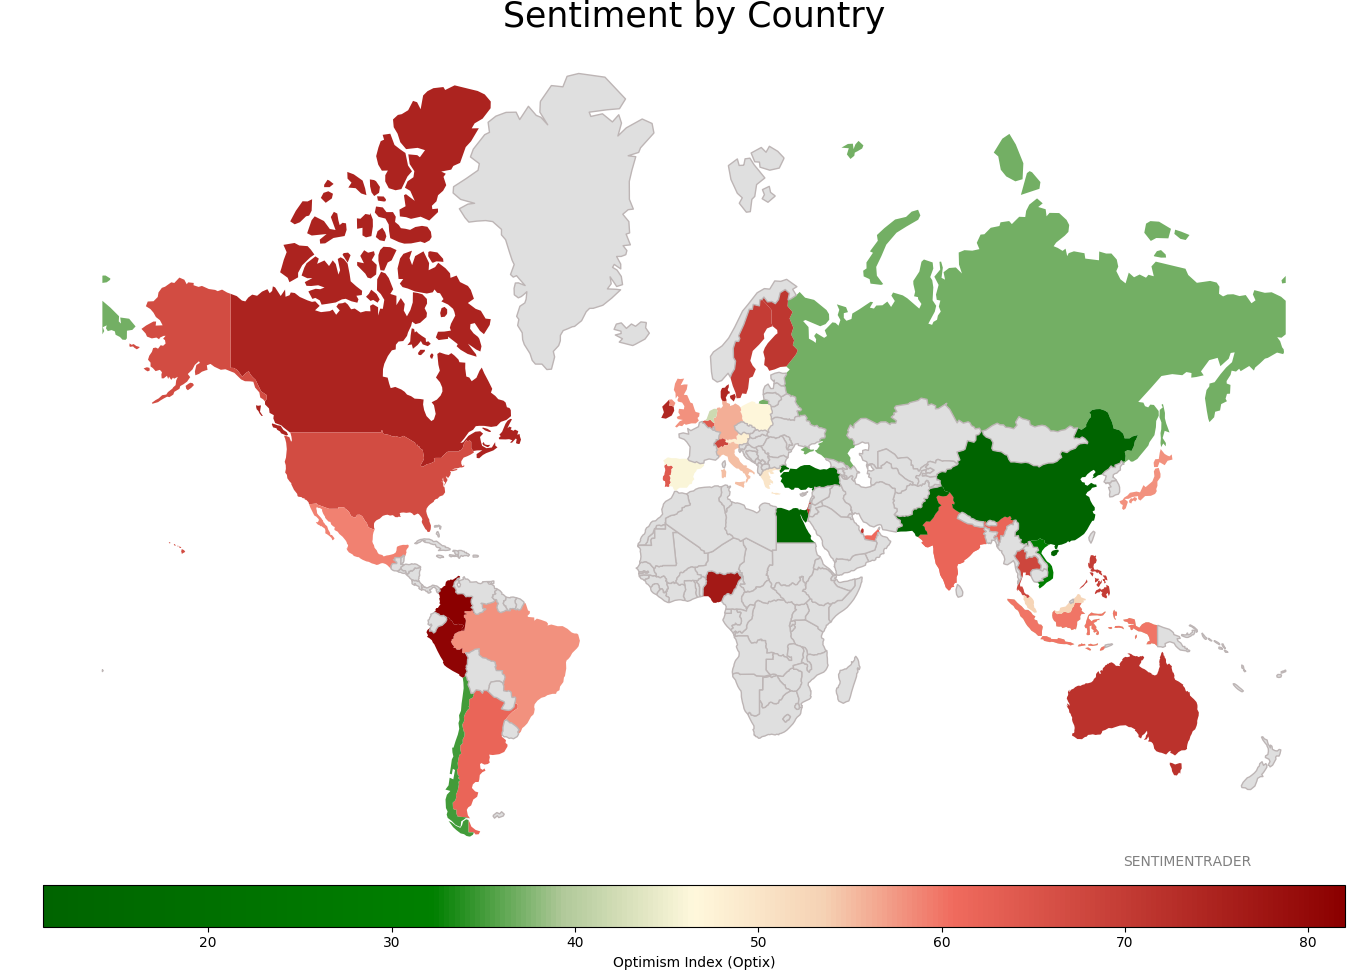
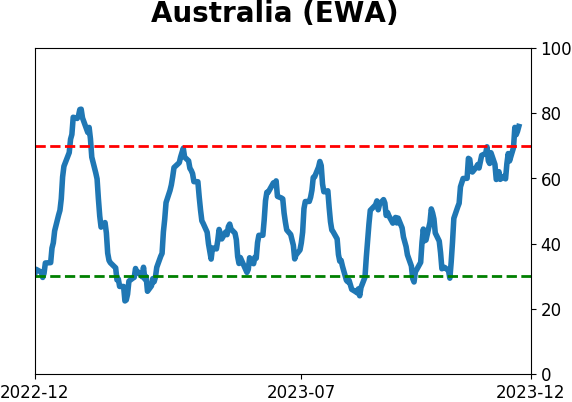
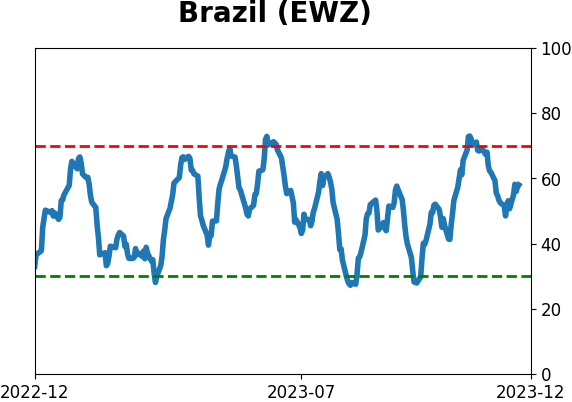
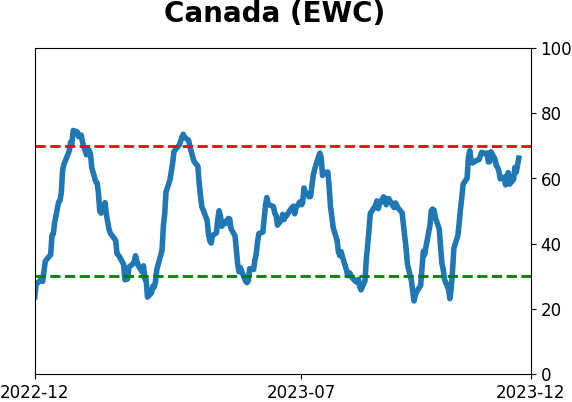
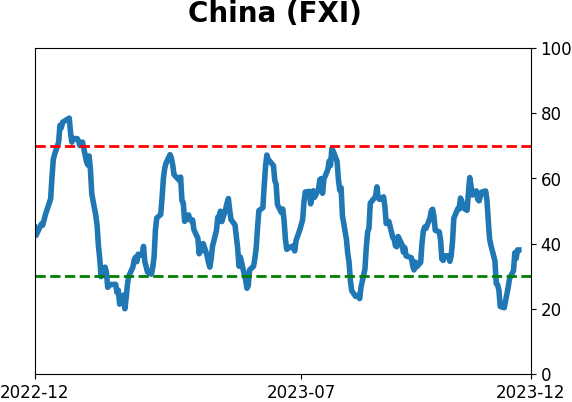
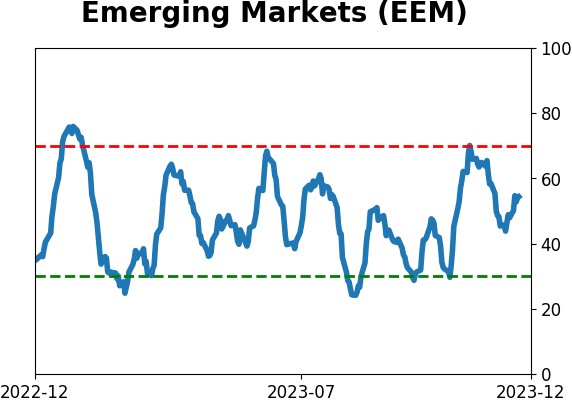
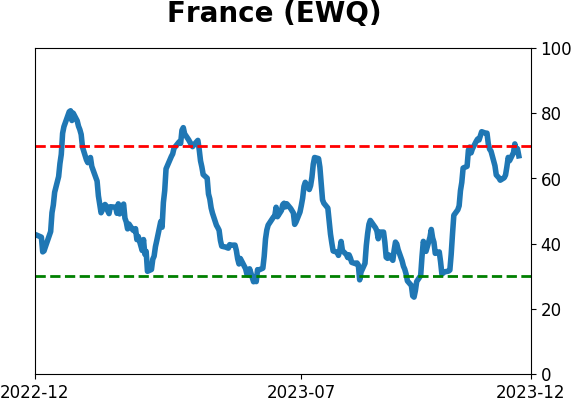
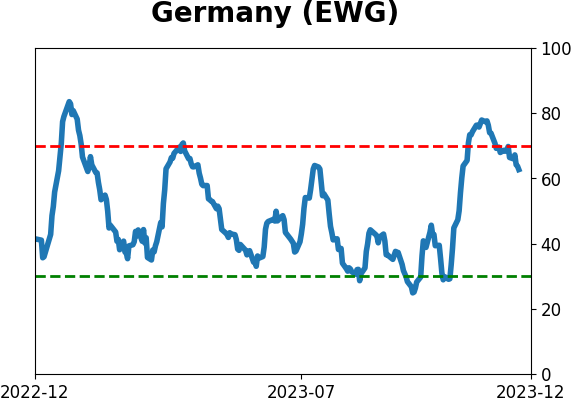
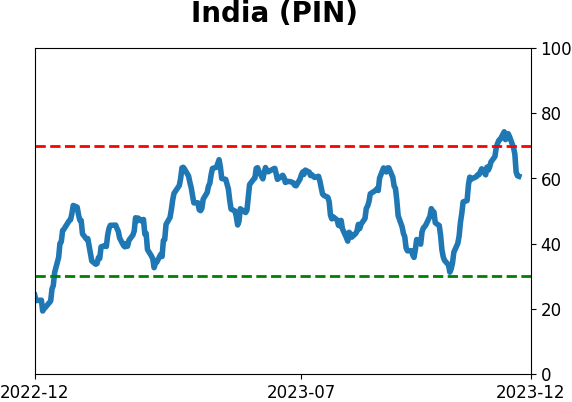
Sentiment Around The World
|
|
|
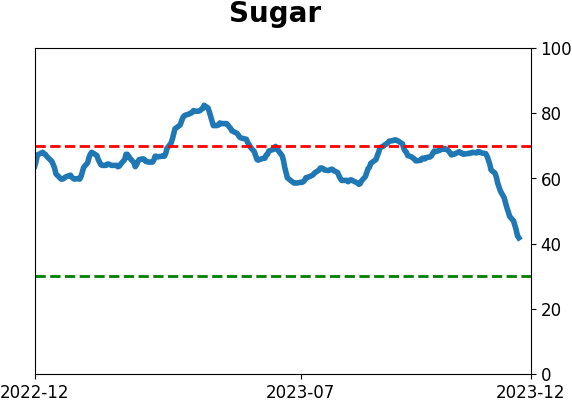
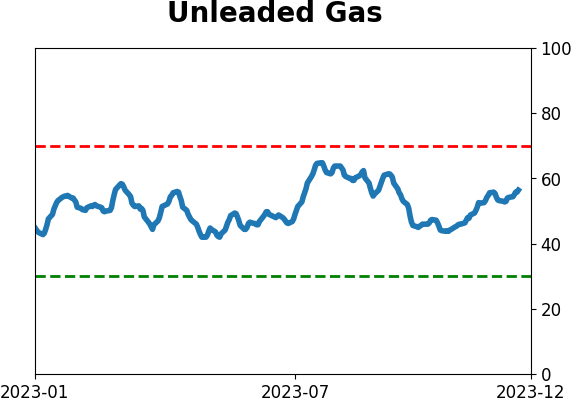
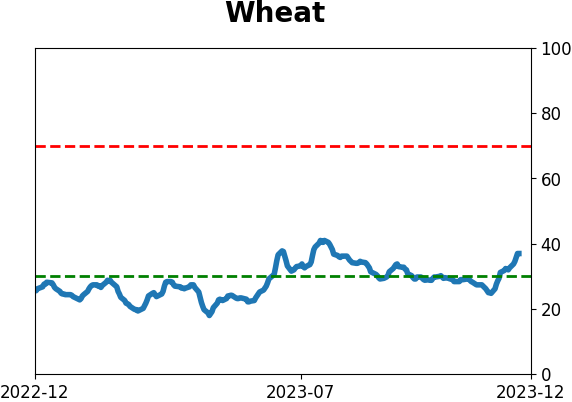
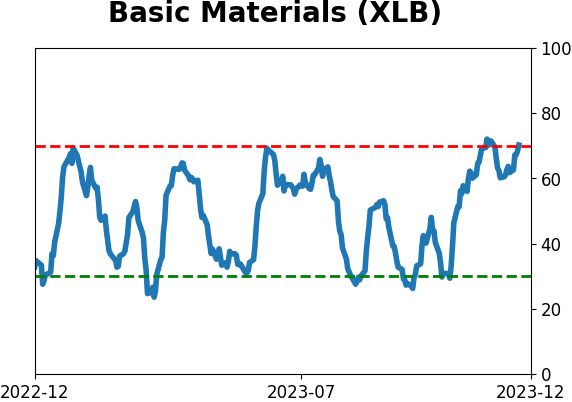
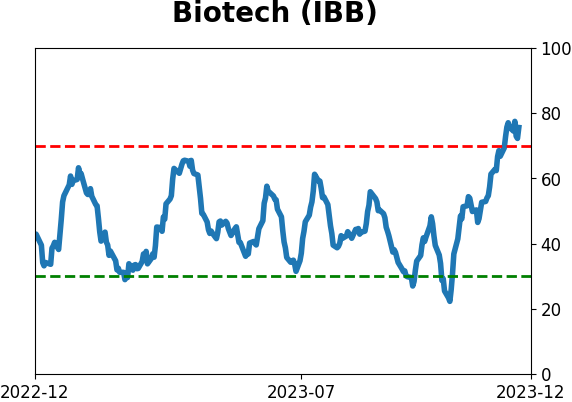
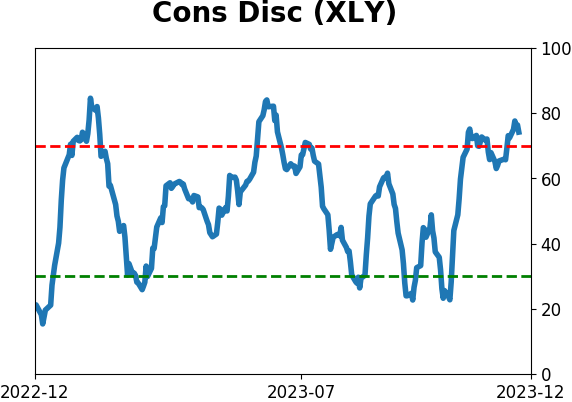
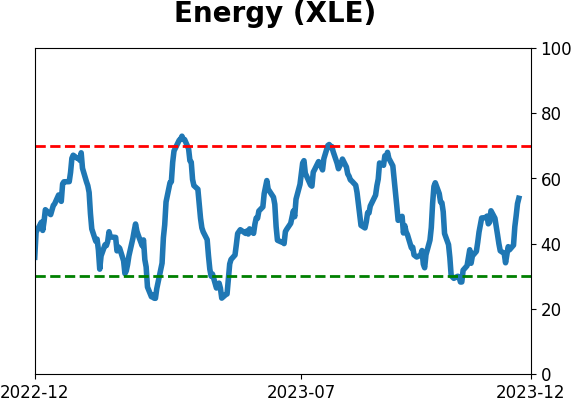
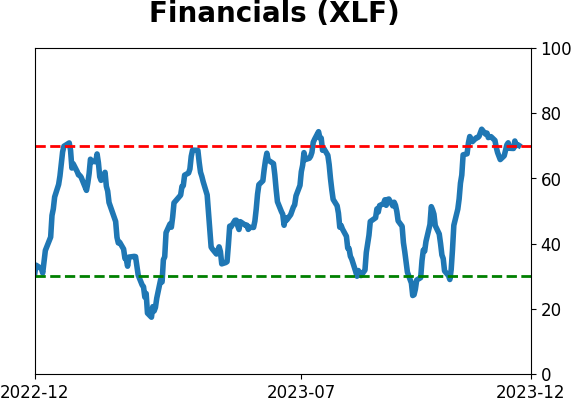
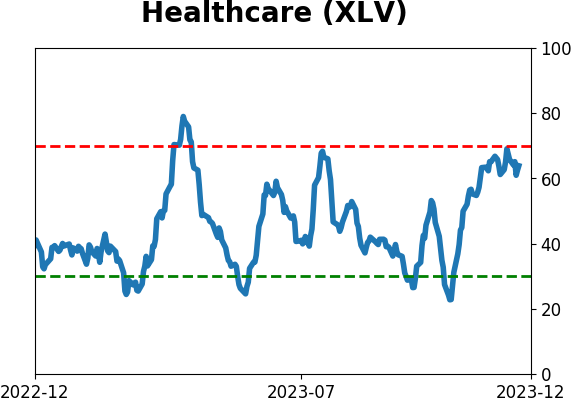
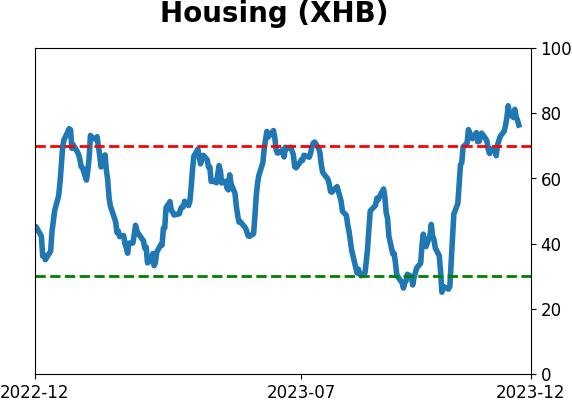
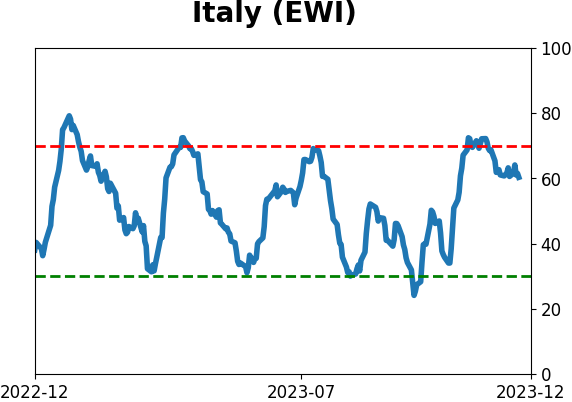
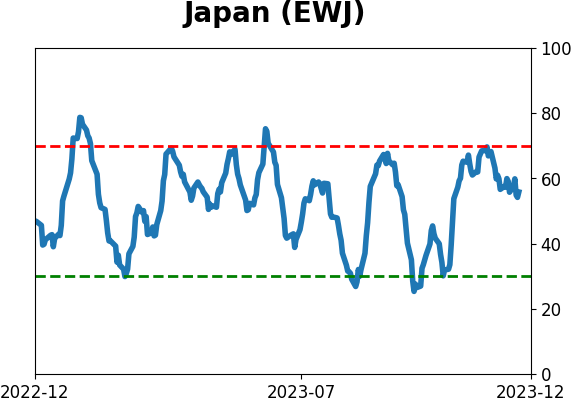
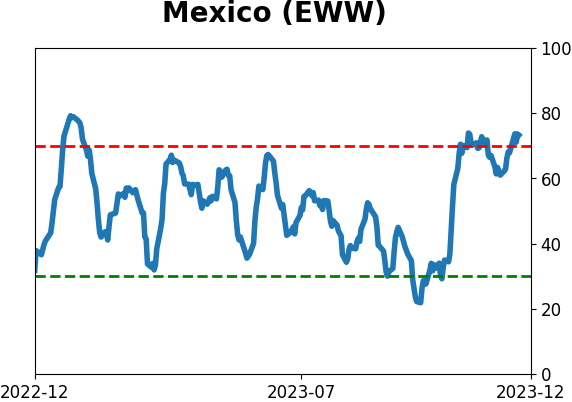
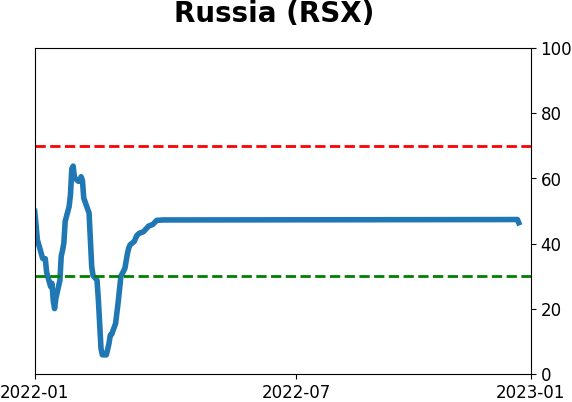
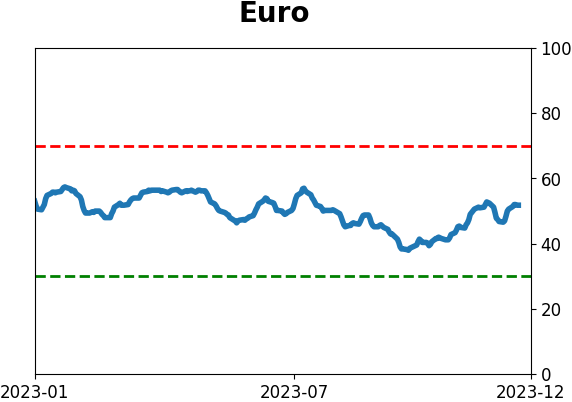
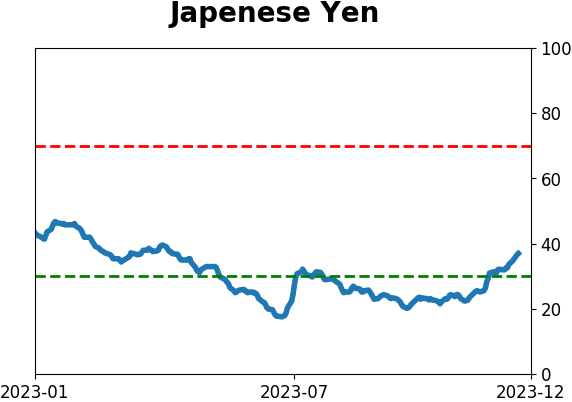
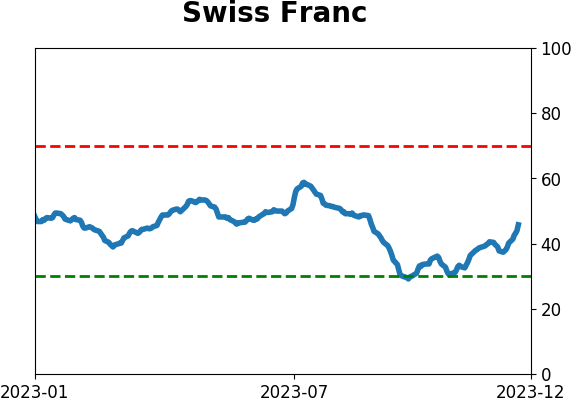
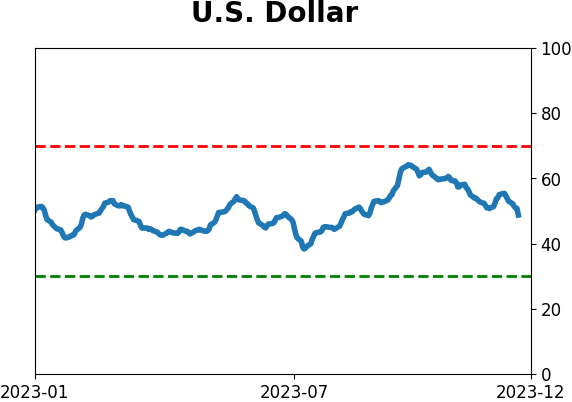
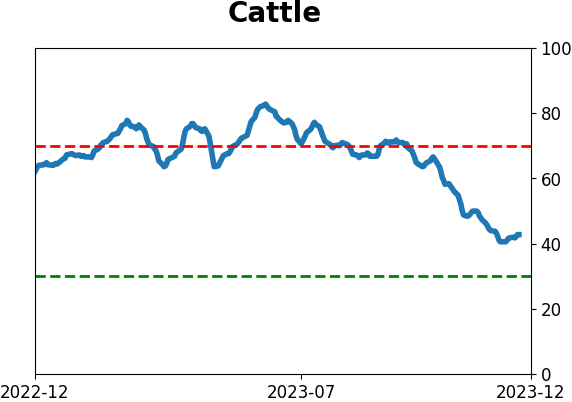
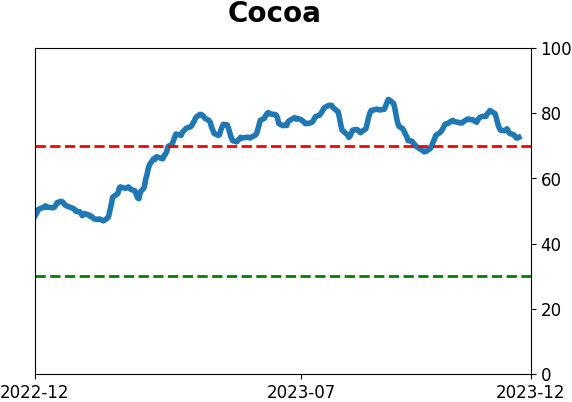
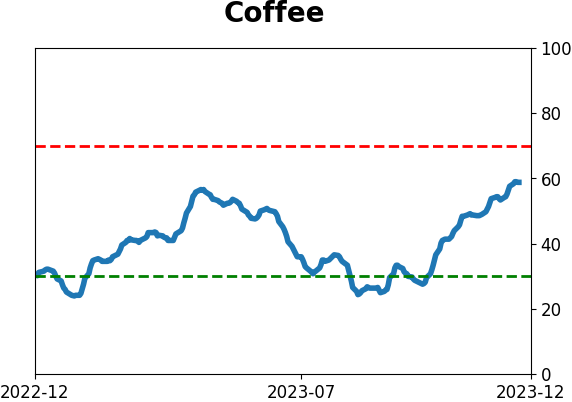
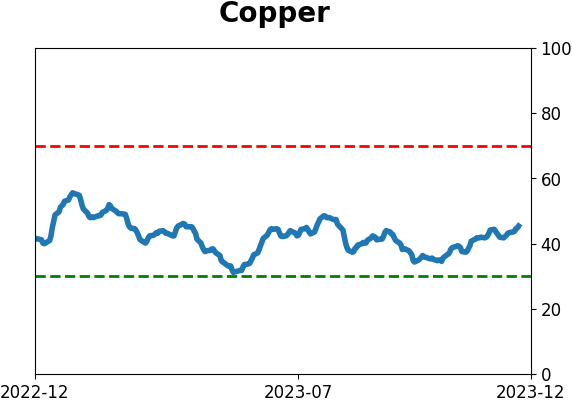
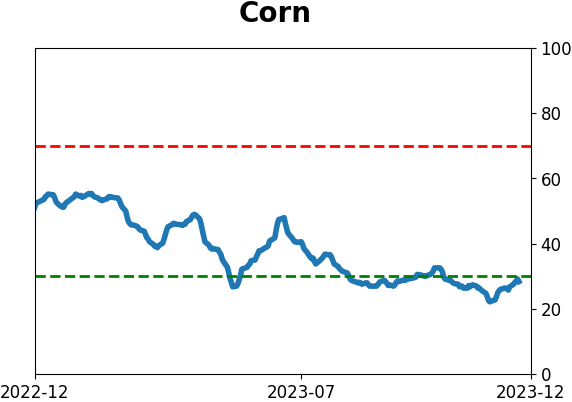
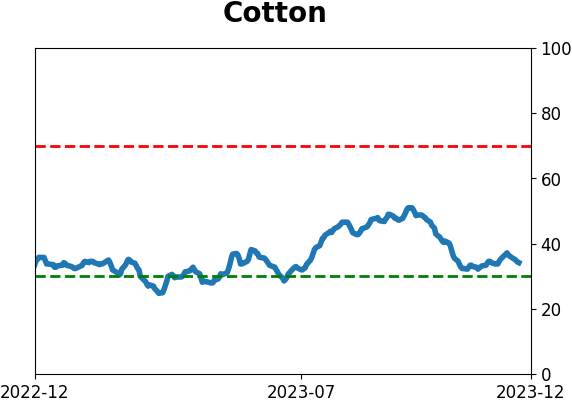
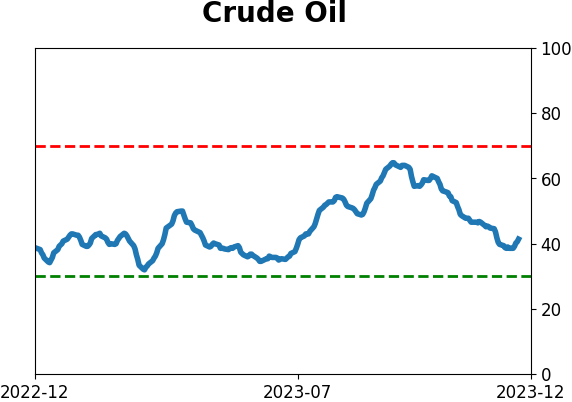
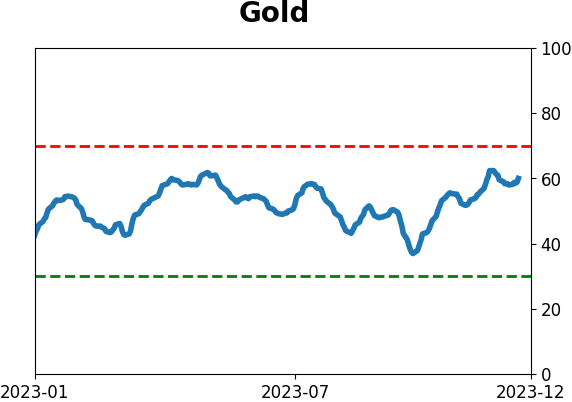
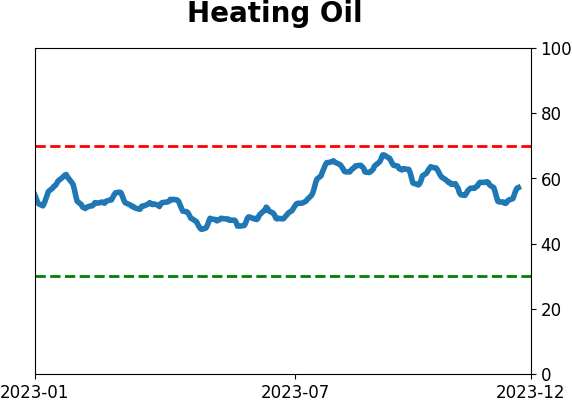
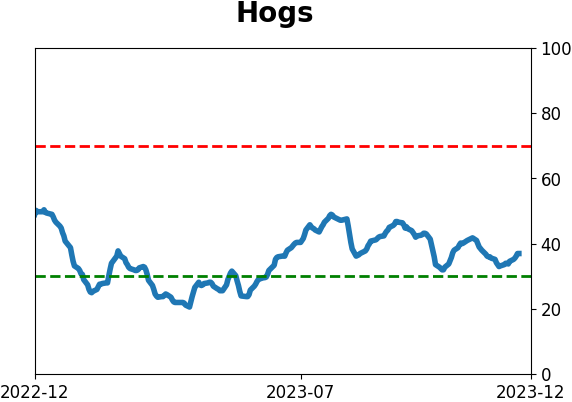
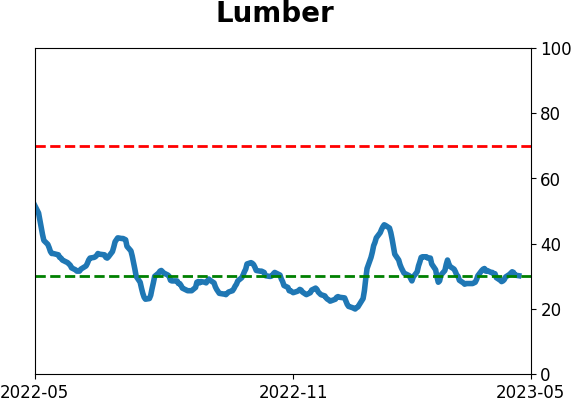
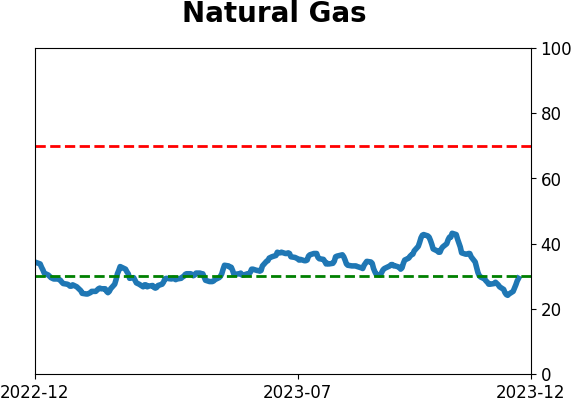
Optimism Index Thumbnails
|
|
|
|

|
|
|
|
|
|
|
|
|
|
|
|
|
|
|
|
|