Headlines
|
|
The average stock just enjoyed a near-record reversal:
While the Magnificent 7 stocks get all the attention, the average S&P 500 stock has been doing very well. The S&P 500 equal weight index just cycled from a 52-week low to a 52-week high in only 33 days, the 2nd-shortest cycle since 1957. Other times the index went from a low to a high, it continued to gain over the next 6 months every time.
|
Smart / Dumb Money Confidence
|
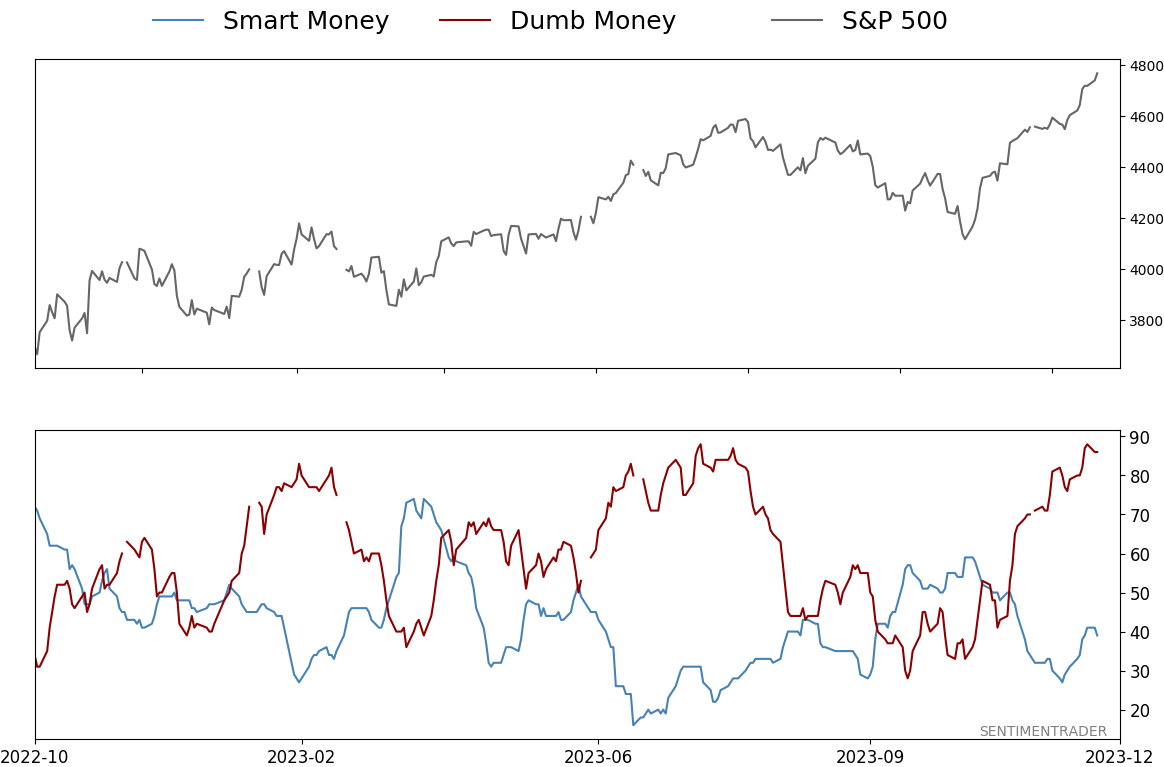
Smart Money Confidence: 39%
Dumb Money Confidence: 86%
|
|
Risk Levels
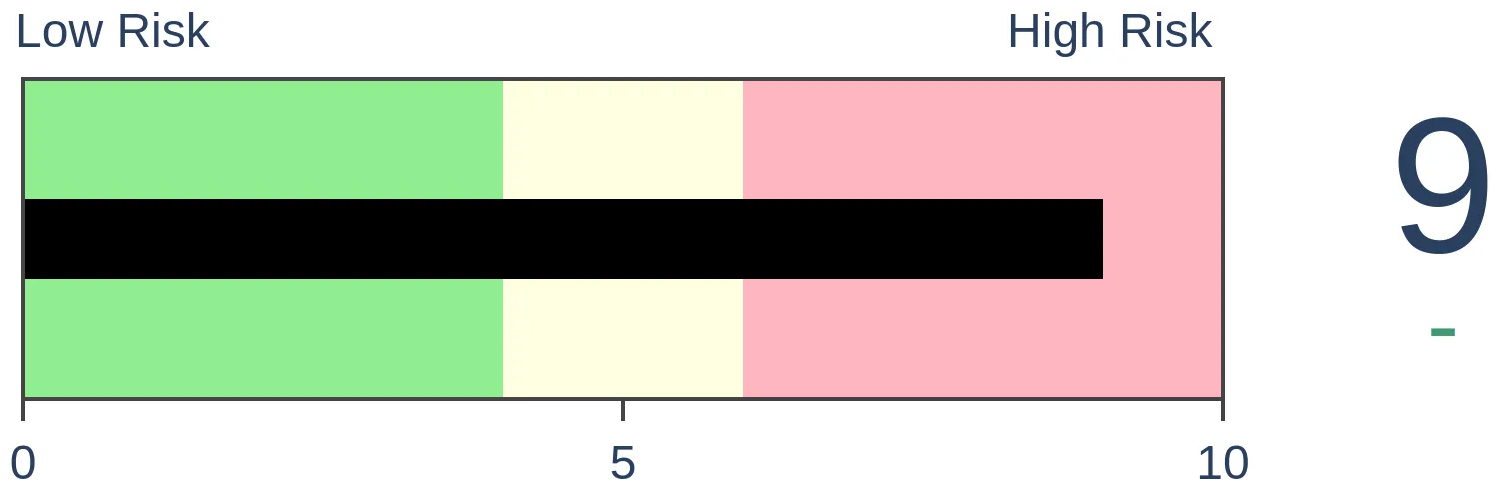
Stocks Short-Term
|
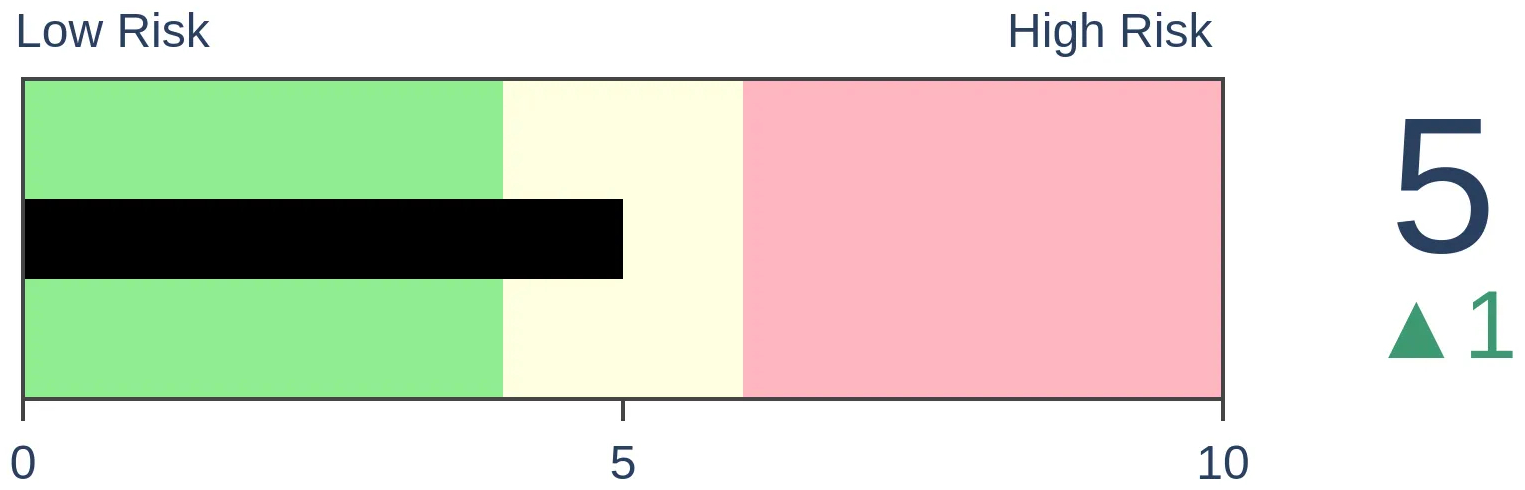
Stocks Medium-Term
|
|
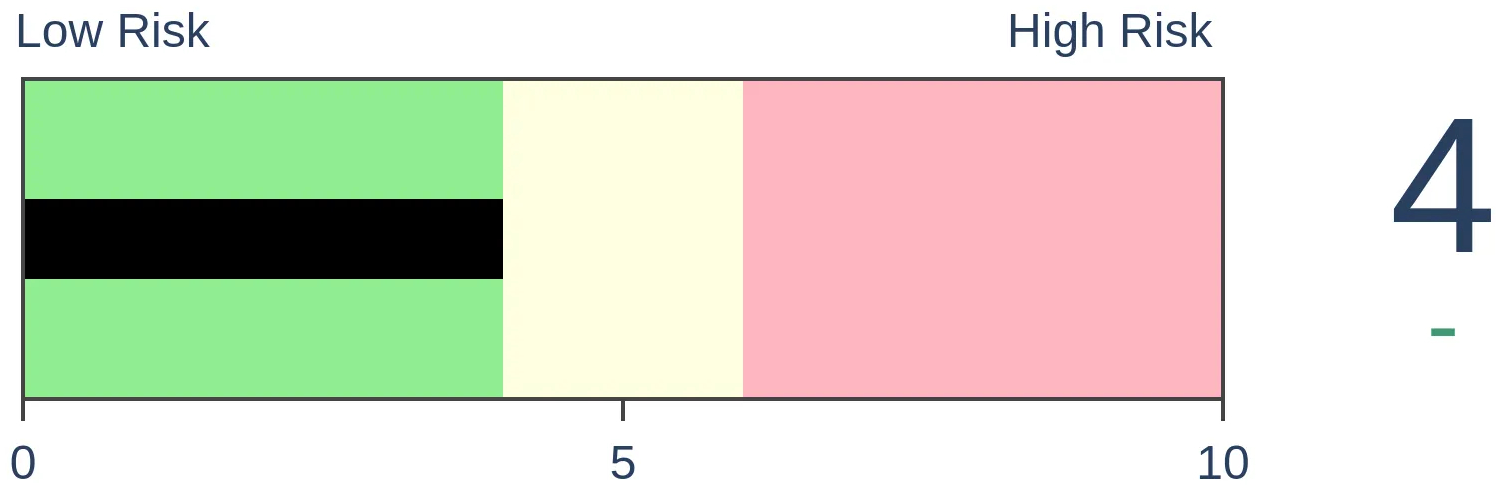
Bonds

|
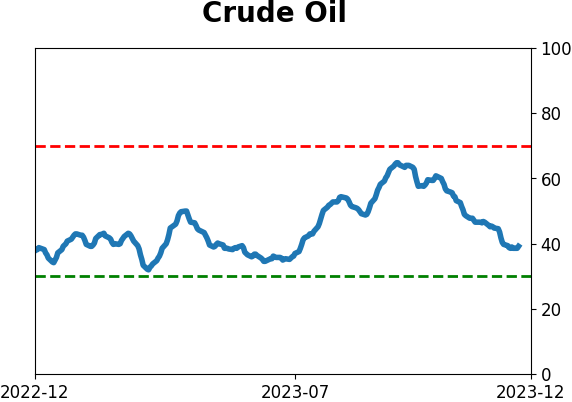
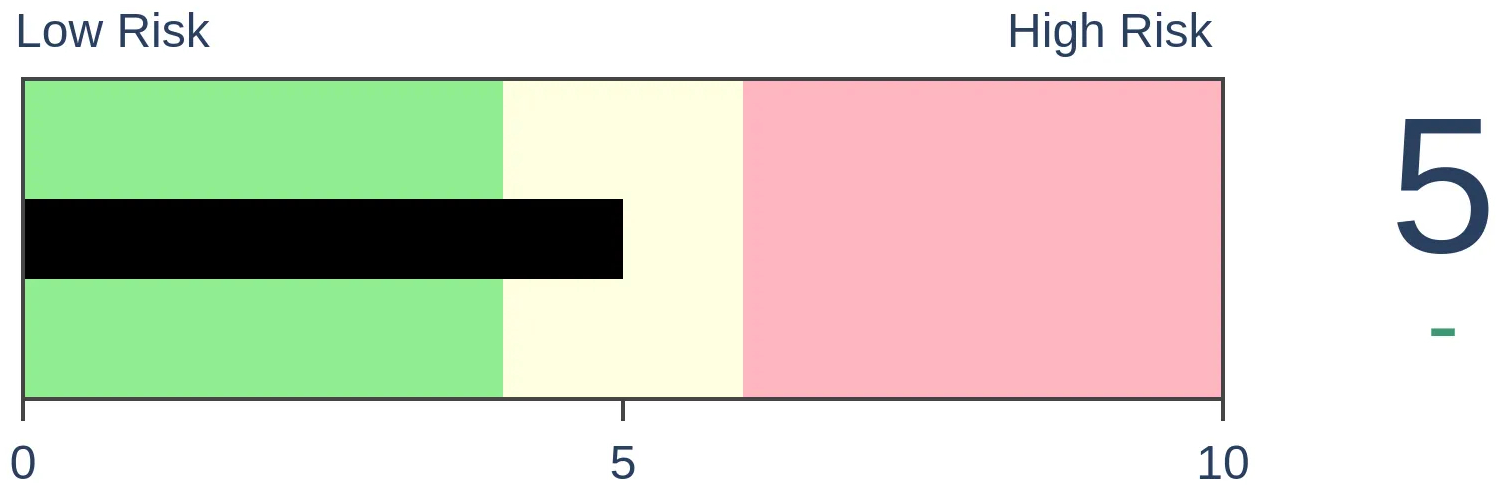
Crude Oil
|
|
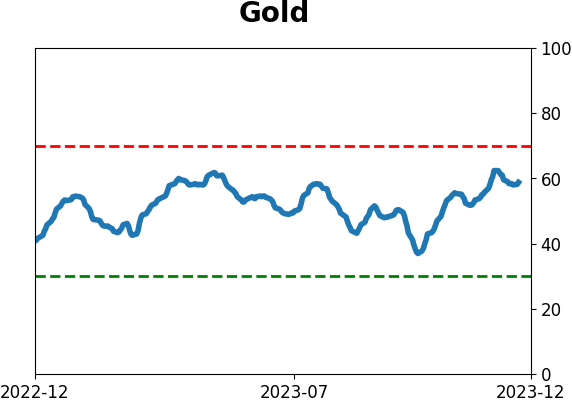
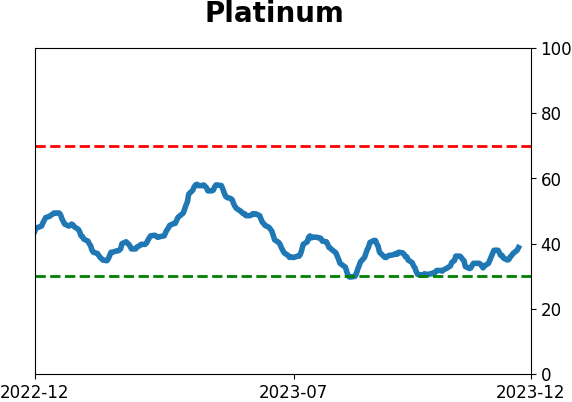
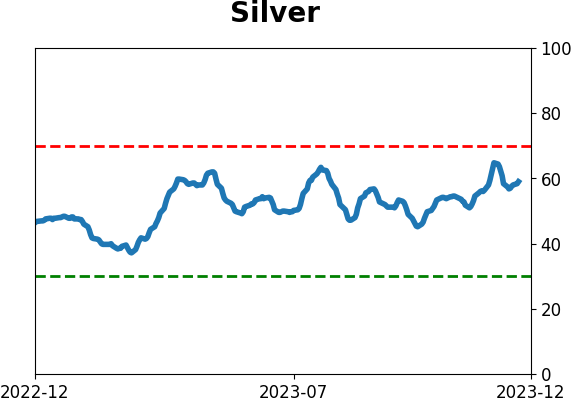
Gold
|
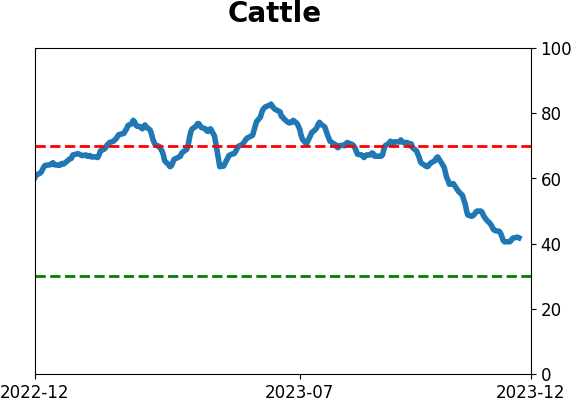
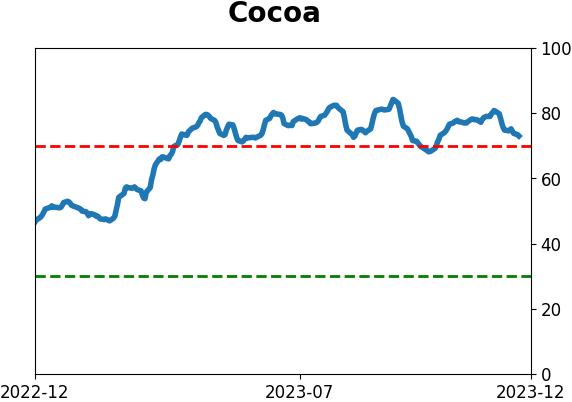
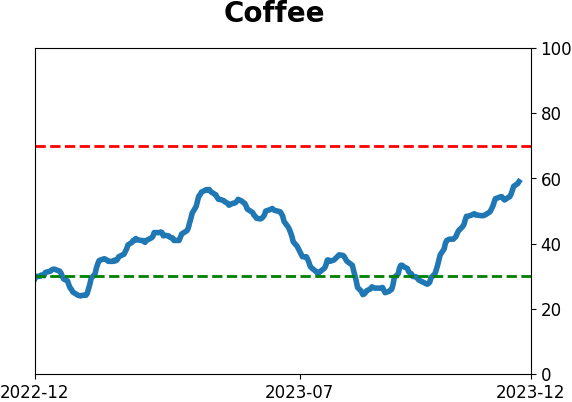
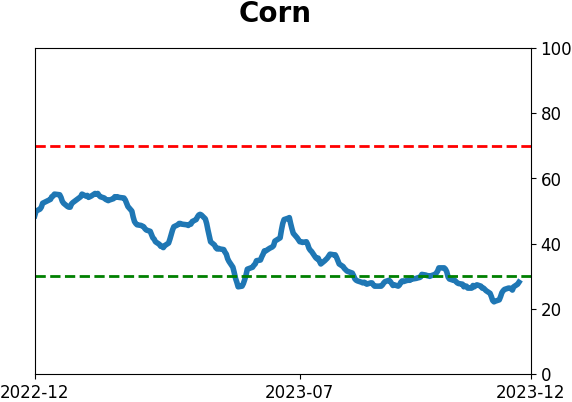
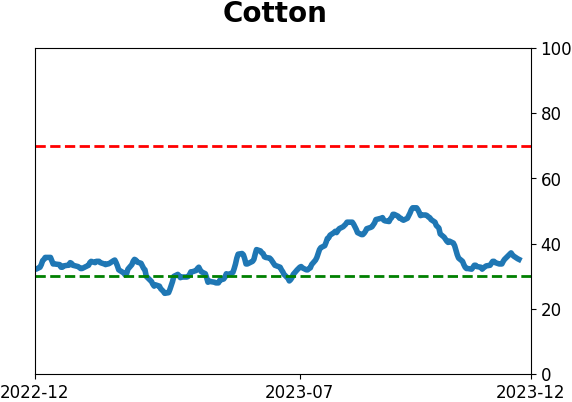
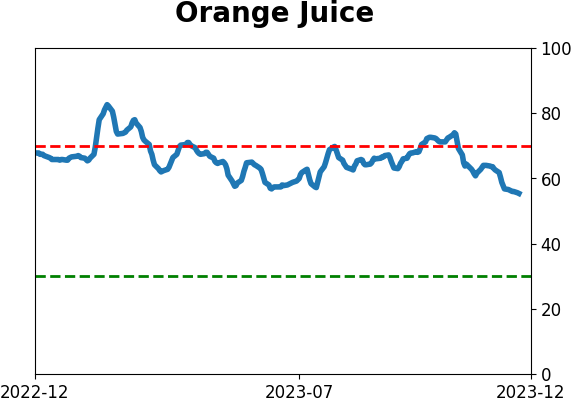
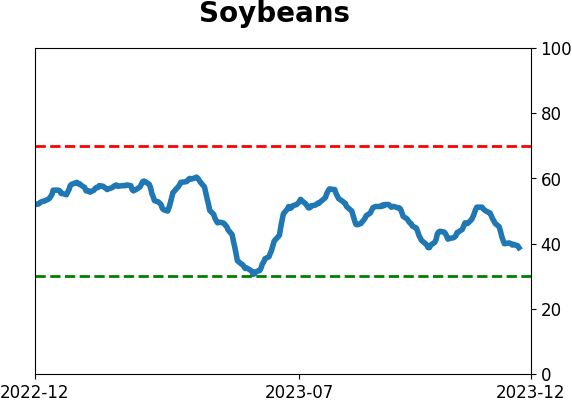
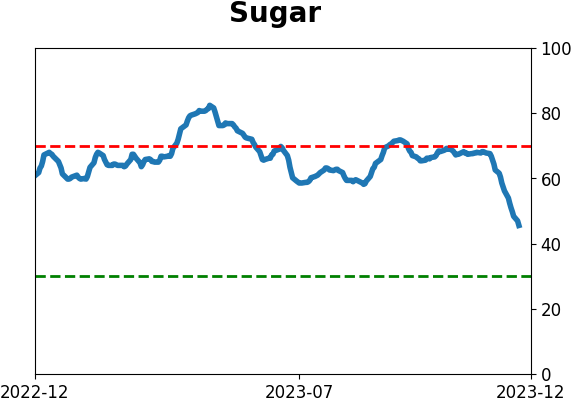
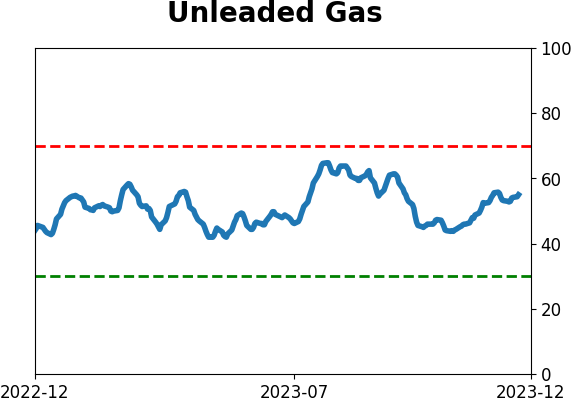
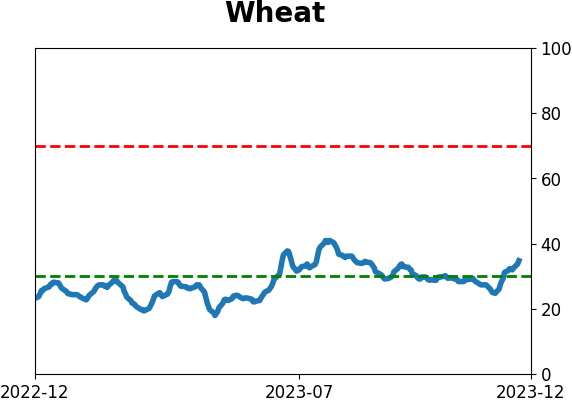
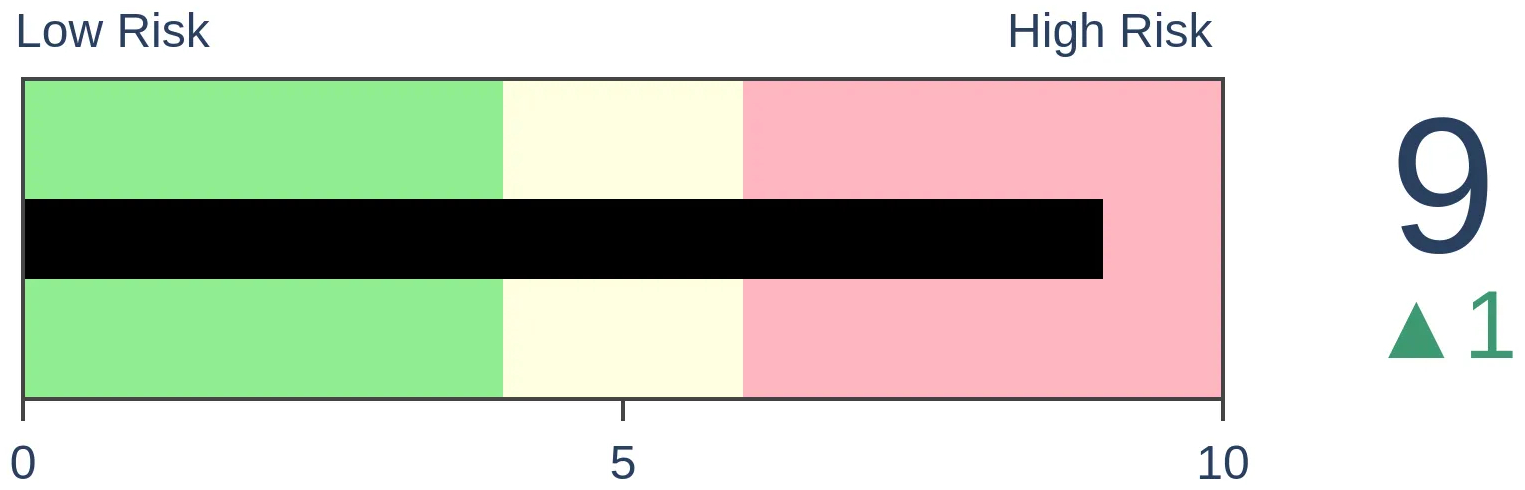
Agriculture
|
|
Research
By Jason Goepfert
BOTTOM LINE
While the Magnificent 7 stocks get all the attention, the average S&P 500 stock has been doing very well. The S&P 500 equal weight index just cycled from a 52-week low to a 52-week high in only 33 days, the 2nd-shortest cycle since 1957. Other times the index went from a low to a high, it continued to gain over the next 6 months every time.
FORECAST / TIMEFRAME
None
|
Key points:
- There is an intense focus on the Magnificent 7 stocks, but the average stock is also doing quite well
- The S&P 500 equal weight index just cycled from a 52-week low to a 52-week high in only 33 days
- Other times the index cycled from low to high, it added on more gains over the next 6 months every time
"But it's just 7 stocks!"
We're all probably tired of reading about it. Hearing about it. Seeing it. Anyone with even a casual interest in finance has been inundated with the idea that this year has been dominated by only seven stocks.
It's an interesting narrative with a catchy name, and that's all it takes for financial media anymore. The trouble for investors with real money at stake is that it is misleading; just because those seven stocks have done well, it doesn't mean that other stocks haven't done well.
The fact is that the average stock in the S&P 500 has just cycled from a 52-week low to a 52-week high in barely more than a calendar month. That's an almost unprecedented success.
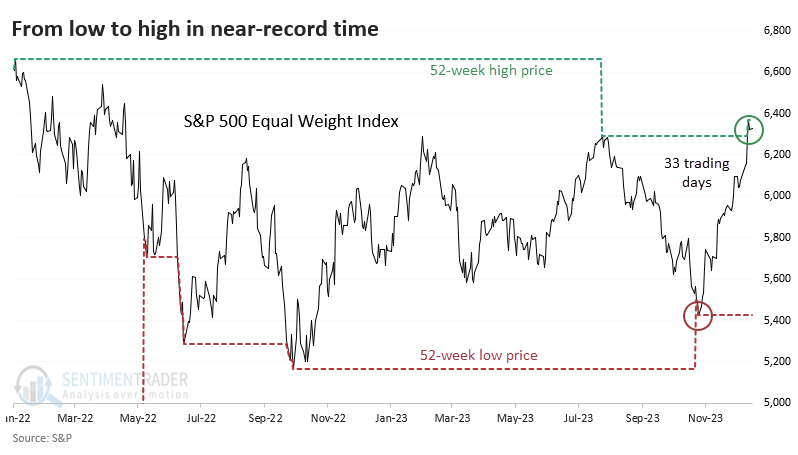
The S&P 500 equal weight index gives the same weight to all 500+ stocks, as opposed to the capitalization weight index that is cited everywhere and that weights larger stocks more heavily.
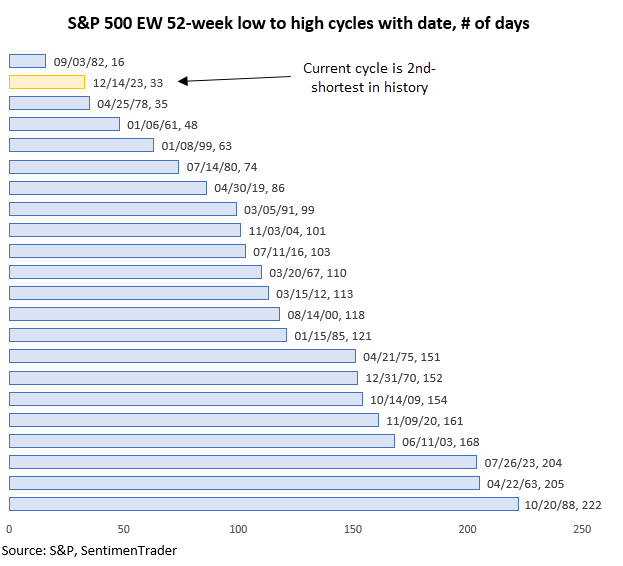
The equal weight index just went from a 52-week low to a 52-week high in 33 trading days. The only low-to-high cycle that happened faster was at the best bottom of all time, in September 1982.
Low-to-high cycles have a strong tendency to lead to more gains
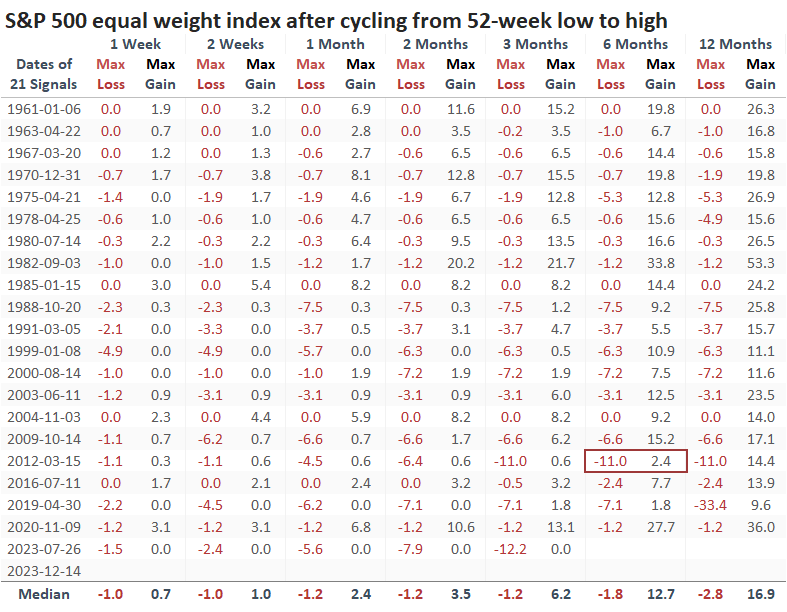
The table below shows every time the equal weight index cycled from a 52-week low to a 52-week high, regardless of how long it took. And it was a good sign for the average stock, which added to its gains over the next six months every time.
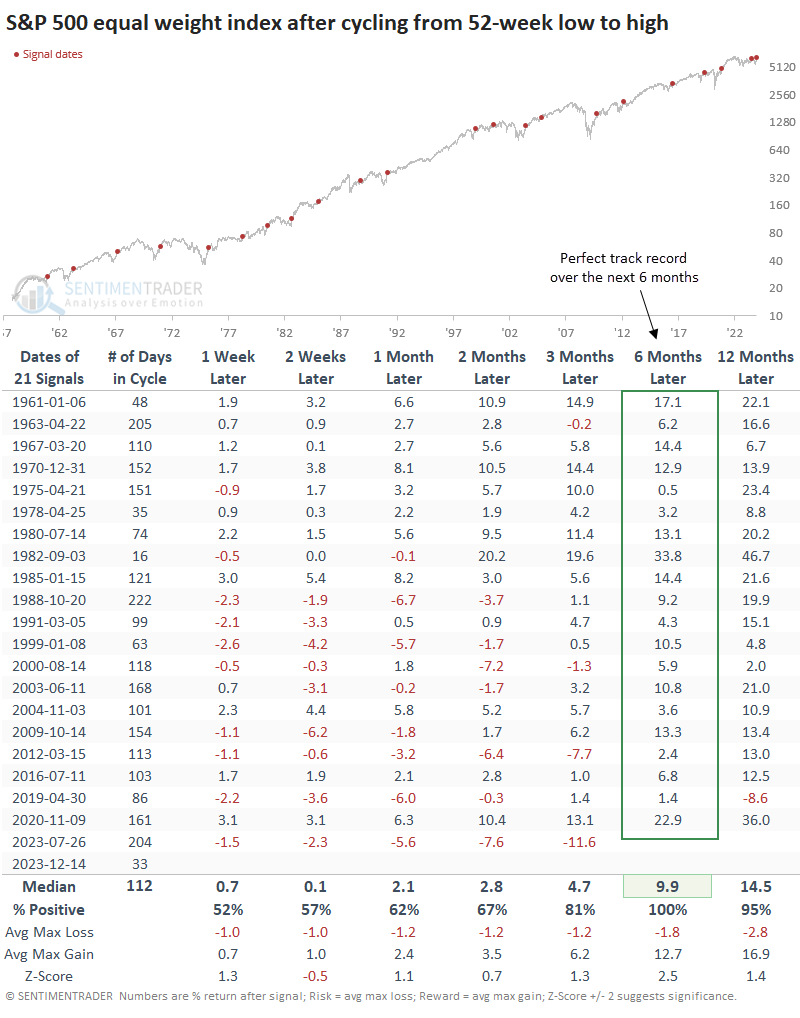
After these signals, the index suffered more than a -10% drawdown within the next six months only once, which is remarkable. The median drawdown was a minuscule -1.8%, while the median drawup (maximum gain) was nearly +13%.
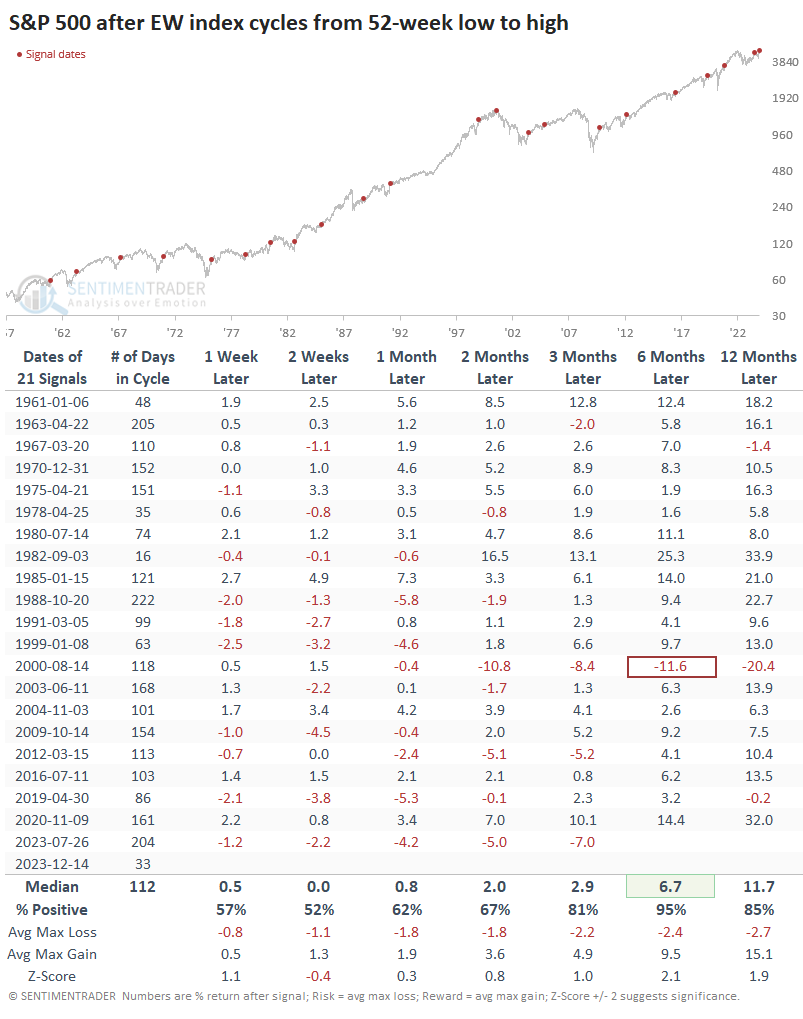
The capitalization weight version of the index also did well after the average stock cycled from a low to a high. However, it suffered one loss over the next six months as the internet bubble burst and some big tech companies dragged the index lower.
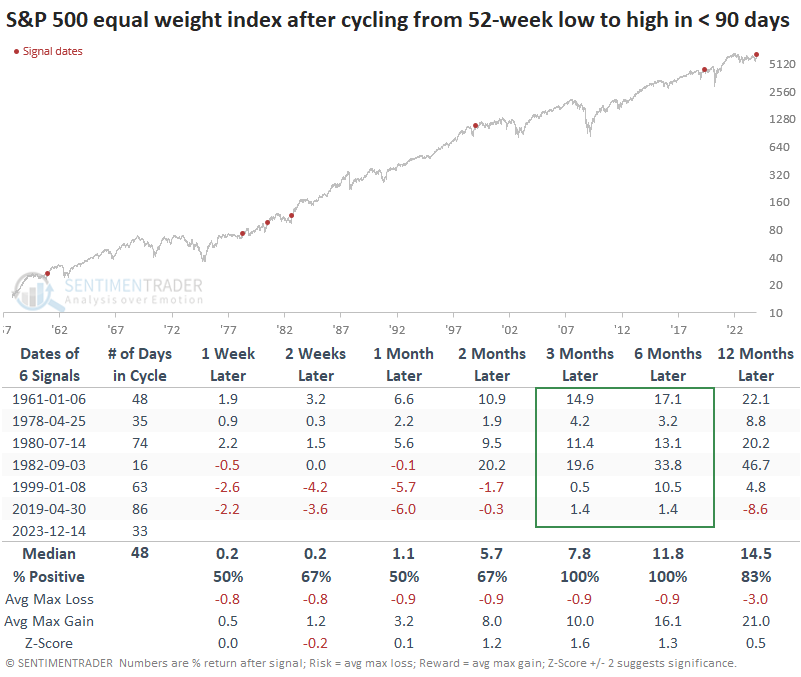
If it weren't for the pandemic in 2020, the quickest low-to-high cycles would have a perfect one-year record of gains. As it stands, the few times the equal weight index took 90 days or fewer to cycle to a new high ended up leading to 3-6 month rallies each time, with a ridiculously positive risk-to-reward ratio.
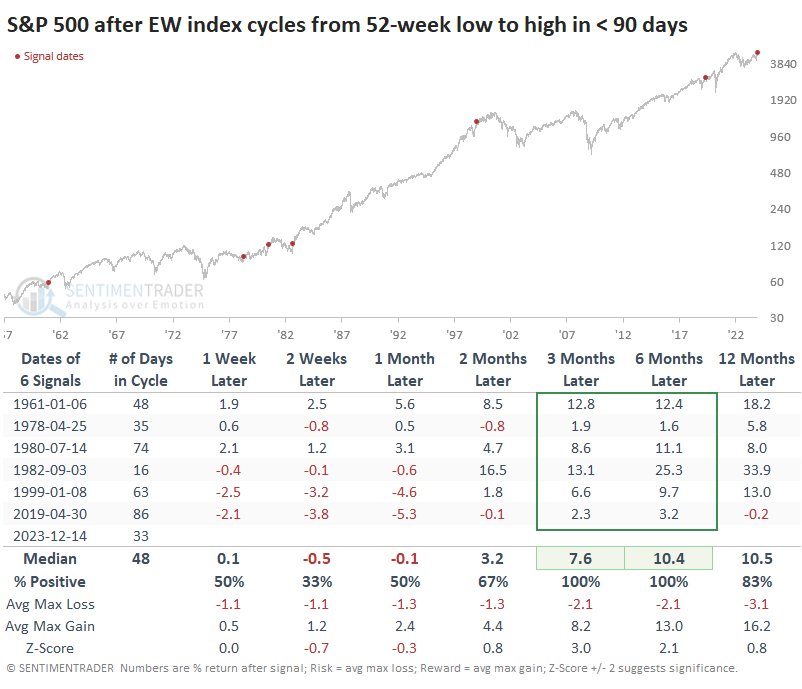
These quick cycles also proved to be good medium-term signs for the mainstream version of the index, though not without some indigestion in the shorter term.
What the research tells us...
More than ever, mainstream financial media is held hostage by editors who want web traffic for advertisers, SEO bait for search engines, and a get-it-published-first mentality for social media. That has dramatically degraded the quality of market coverage for individual investors who rely on these sources. What's published now is little more than me-too articles that provide little context and even less insight.
The fortunate by-product of this is that investors who can think for themselves and do independent research have opportunities to take advantage of the zeitgeist when it overlooks the boring stuff. And right now, the boring stuff includes the fact that the average stock has been doing quite well, has reversed quickly from a bad stretch in the fall, and similar behavior has shown a powerful tendency to lead to further gains over the next six months.
Indicators at Extremes
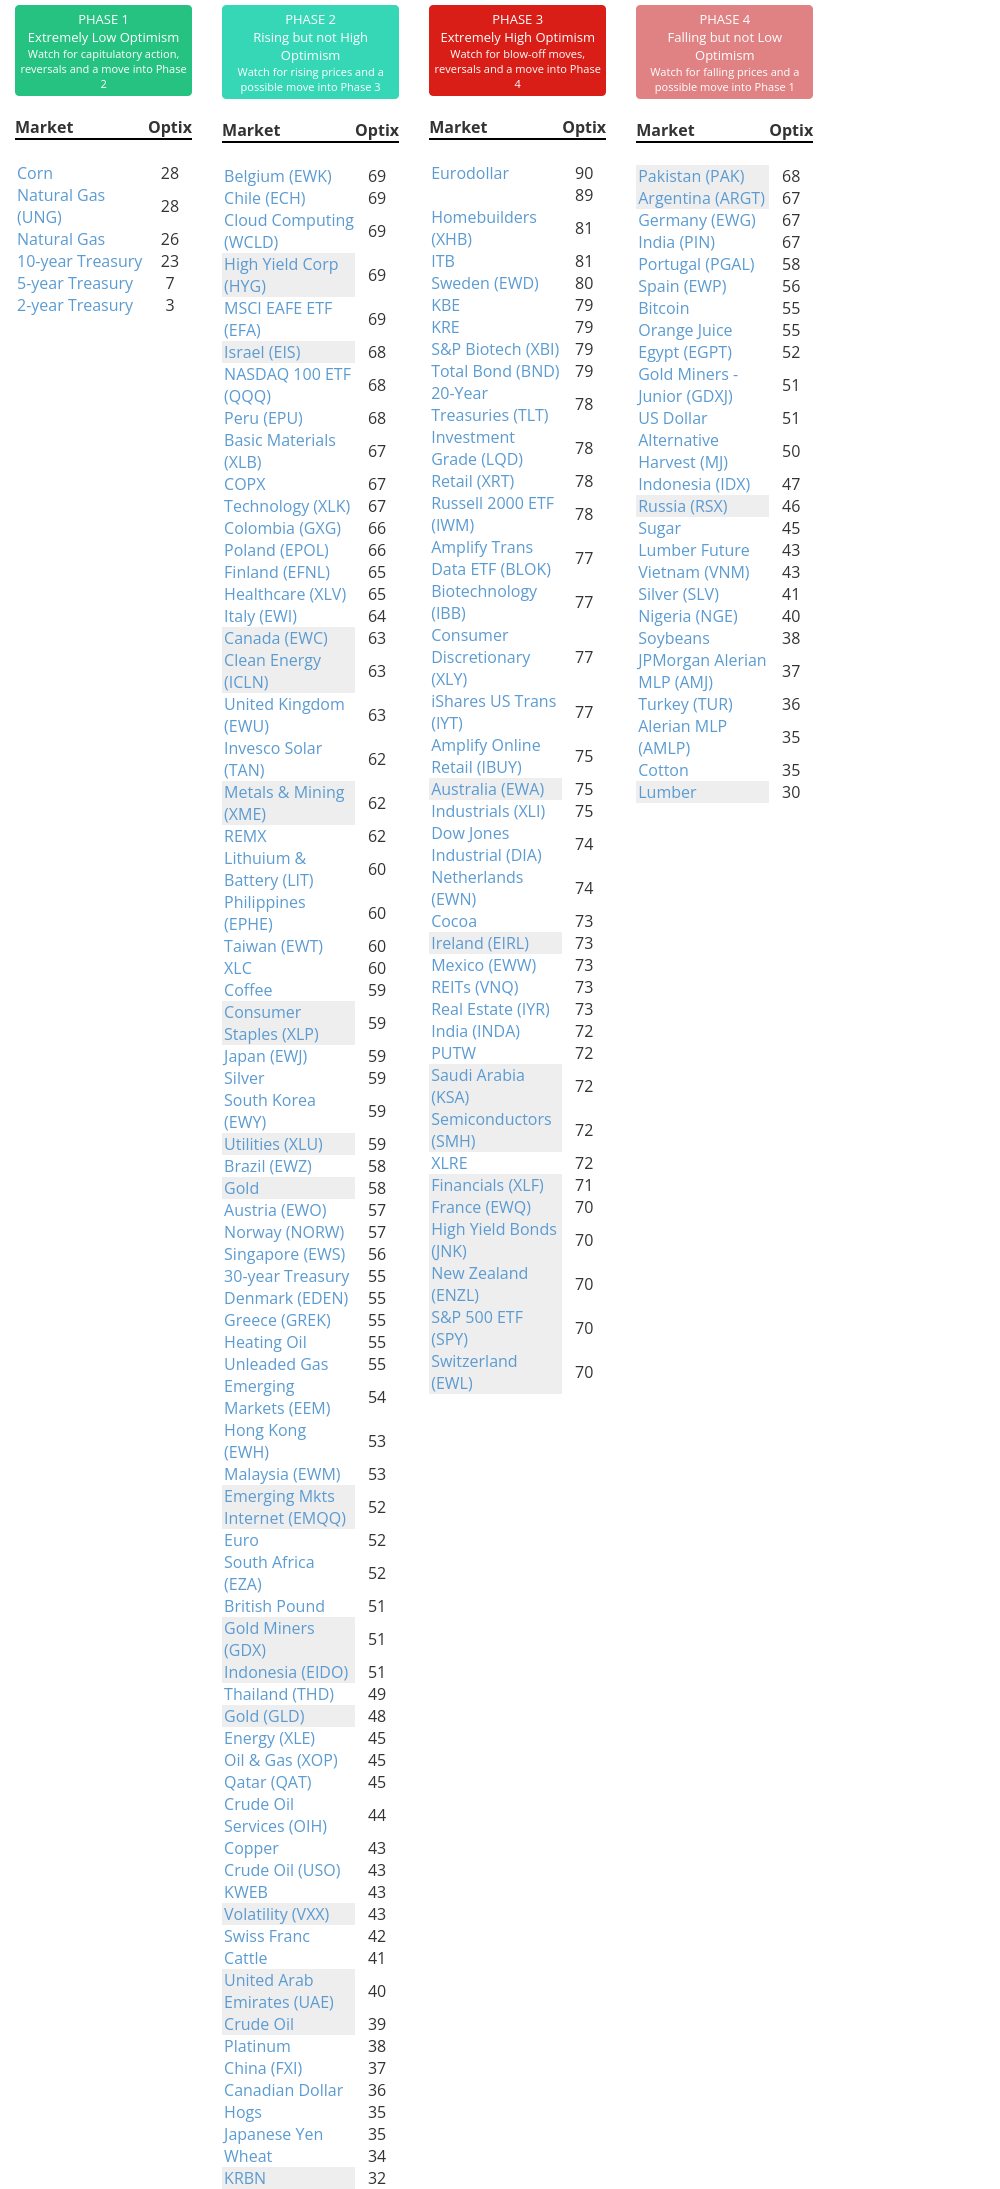
Phase Table
Ranks
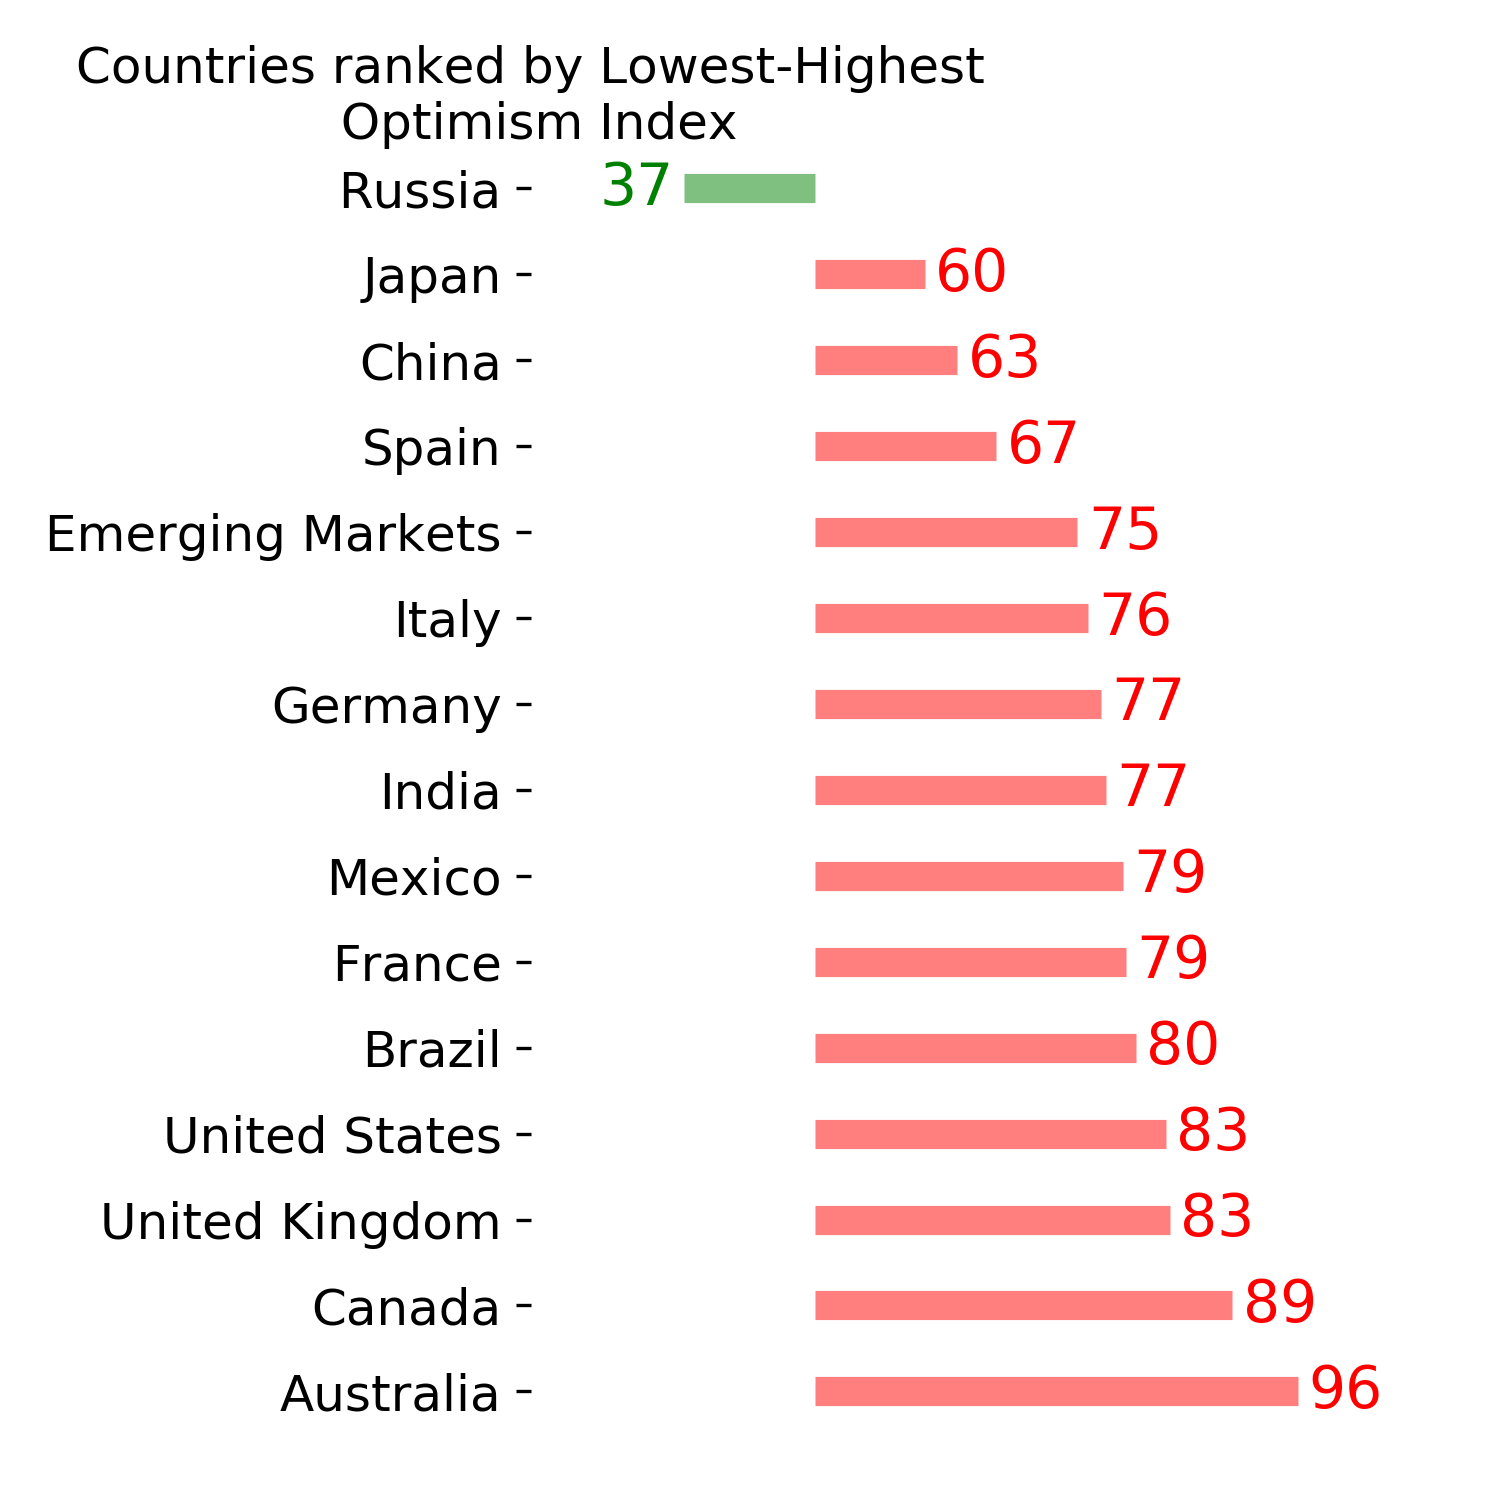
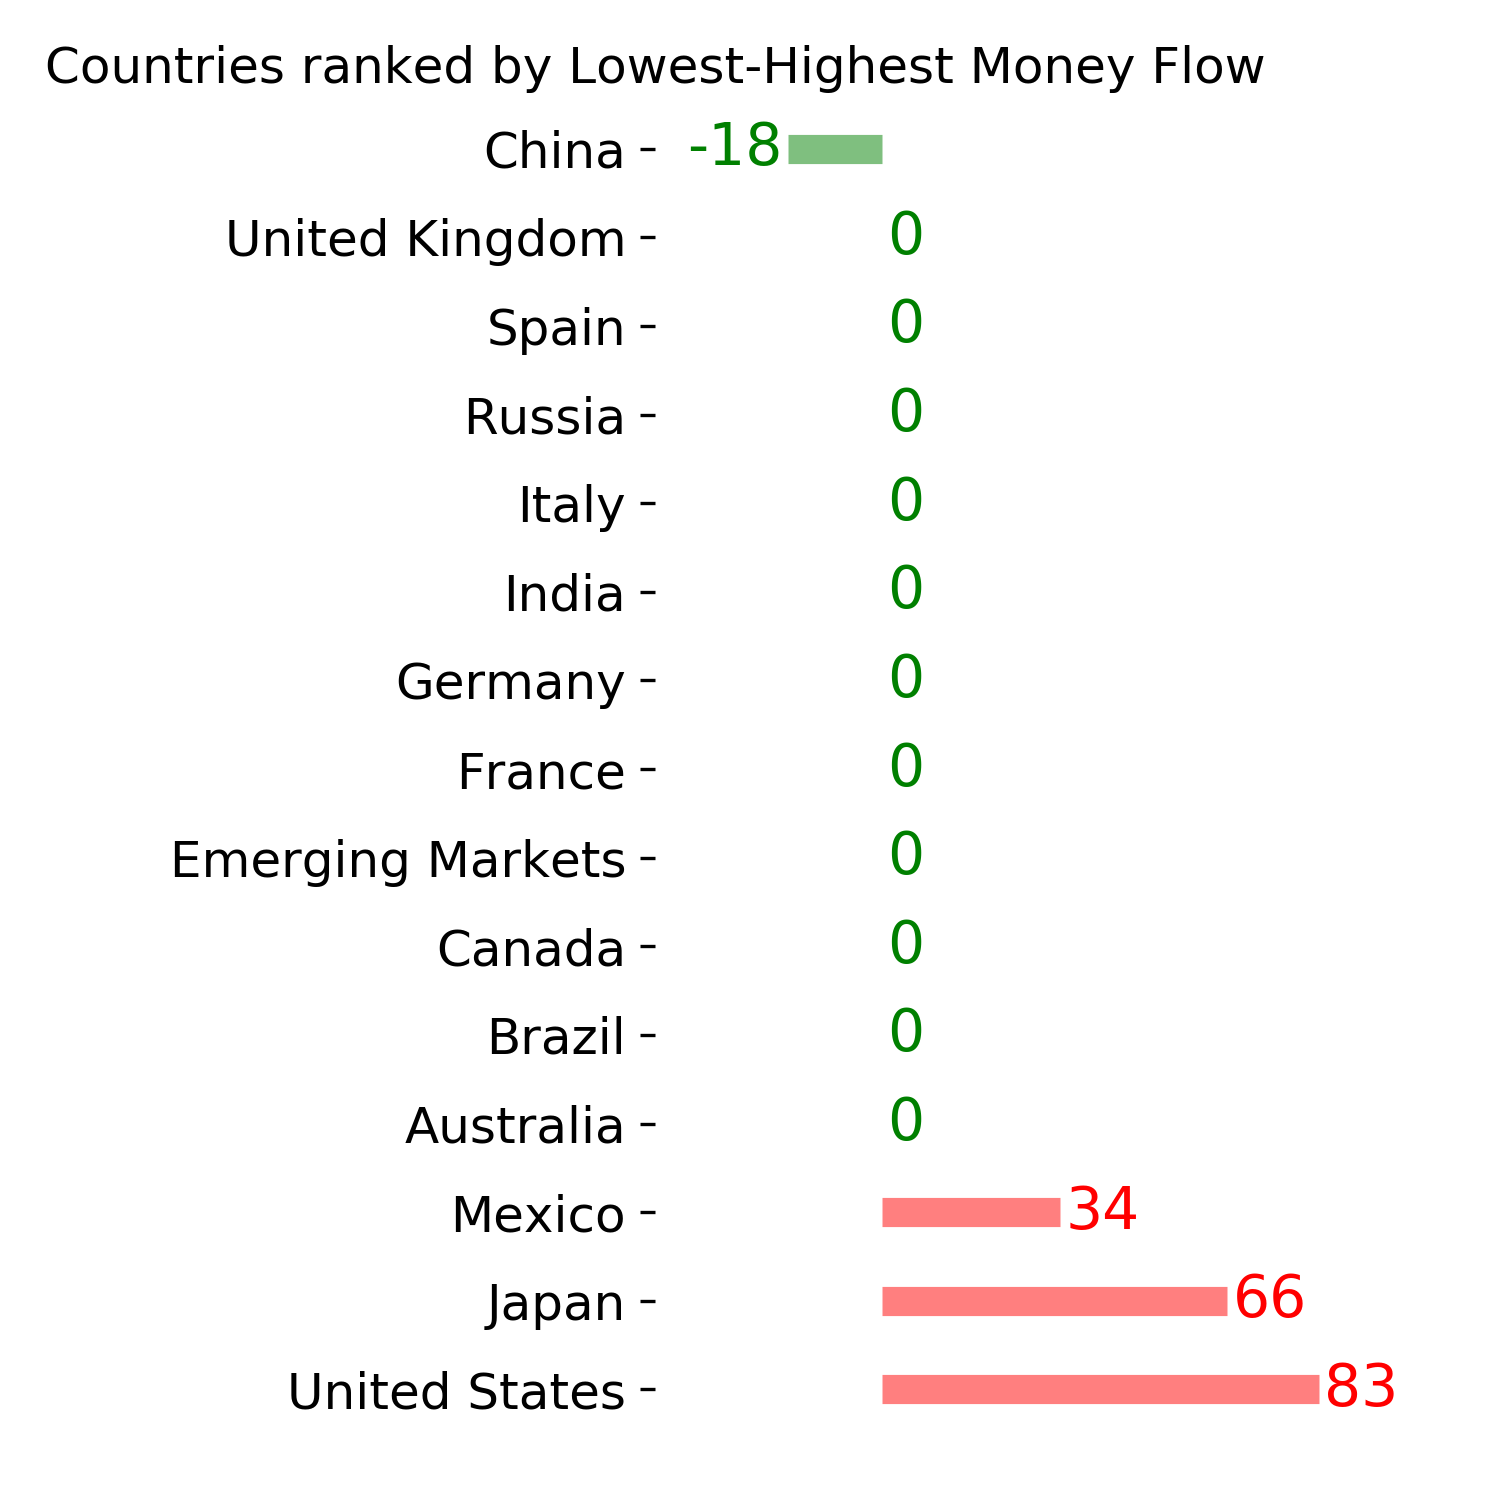
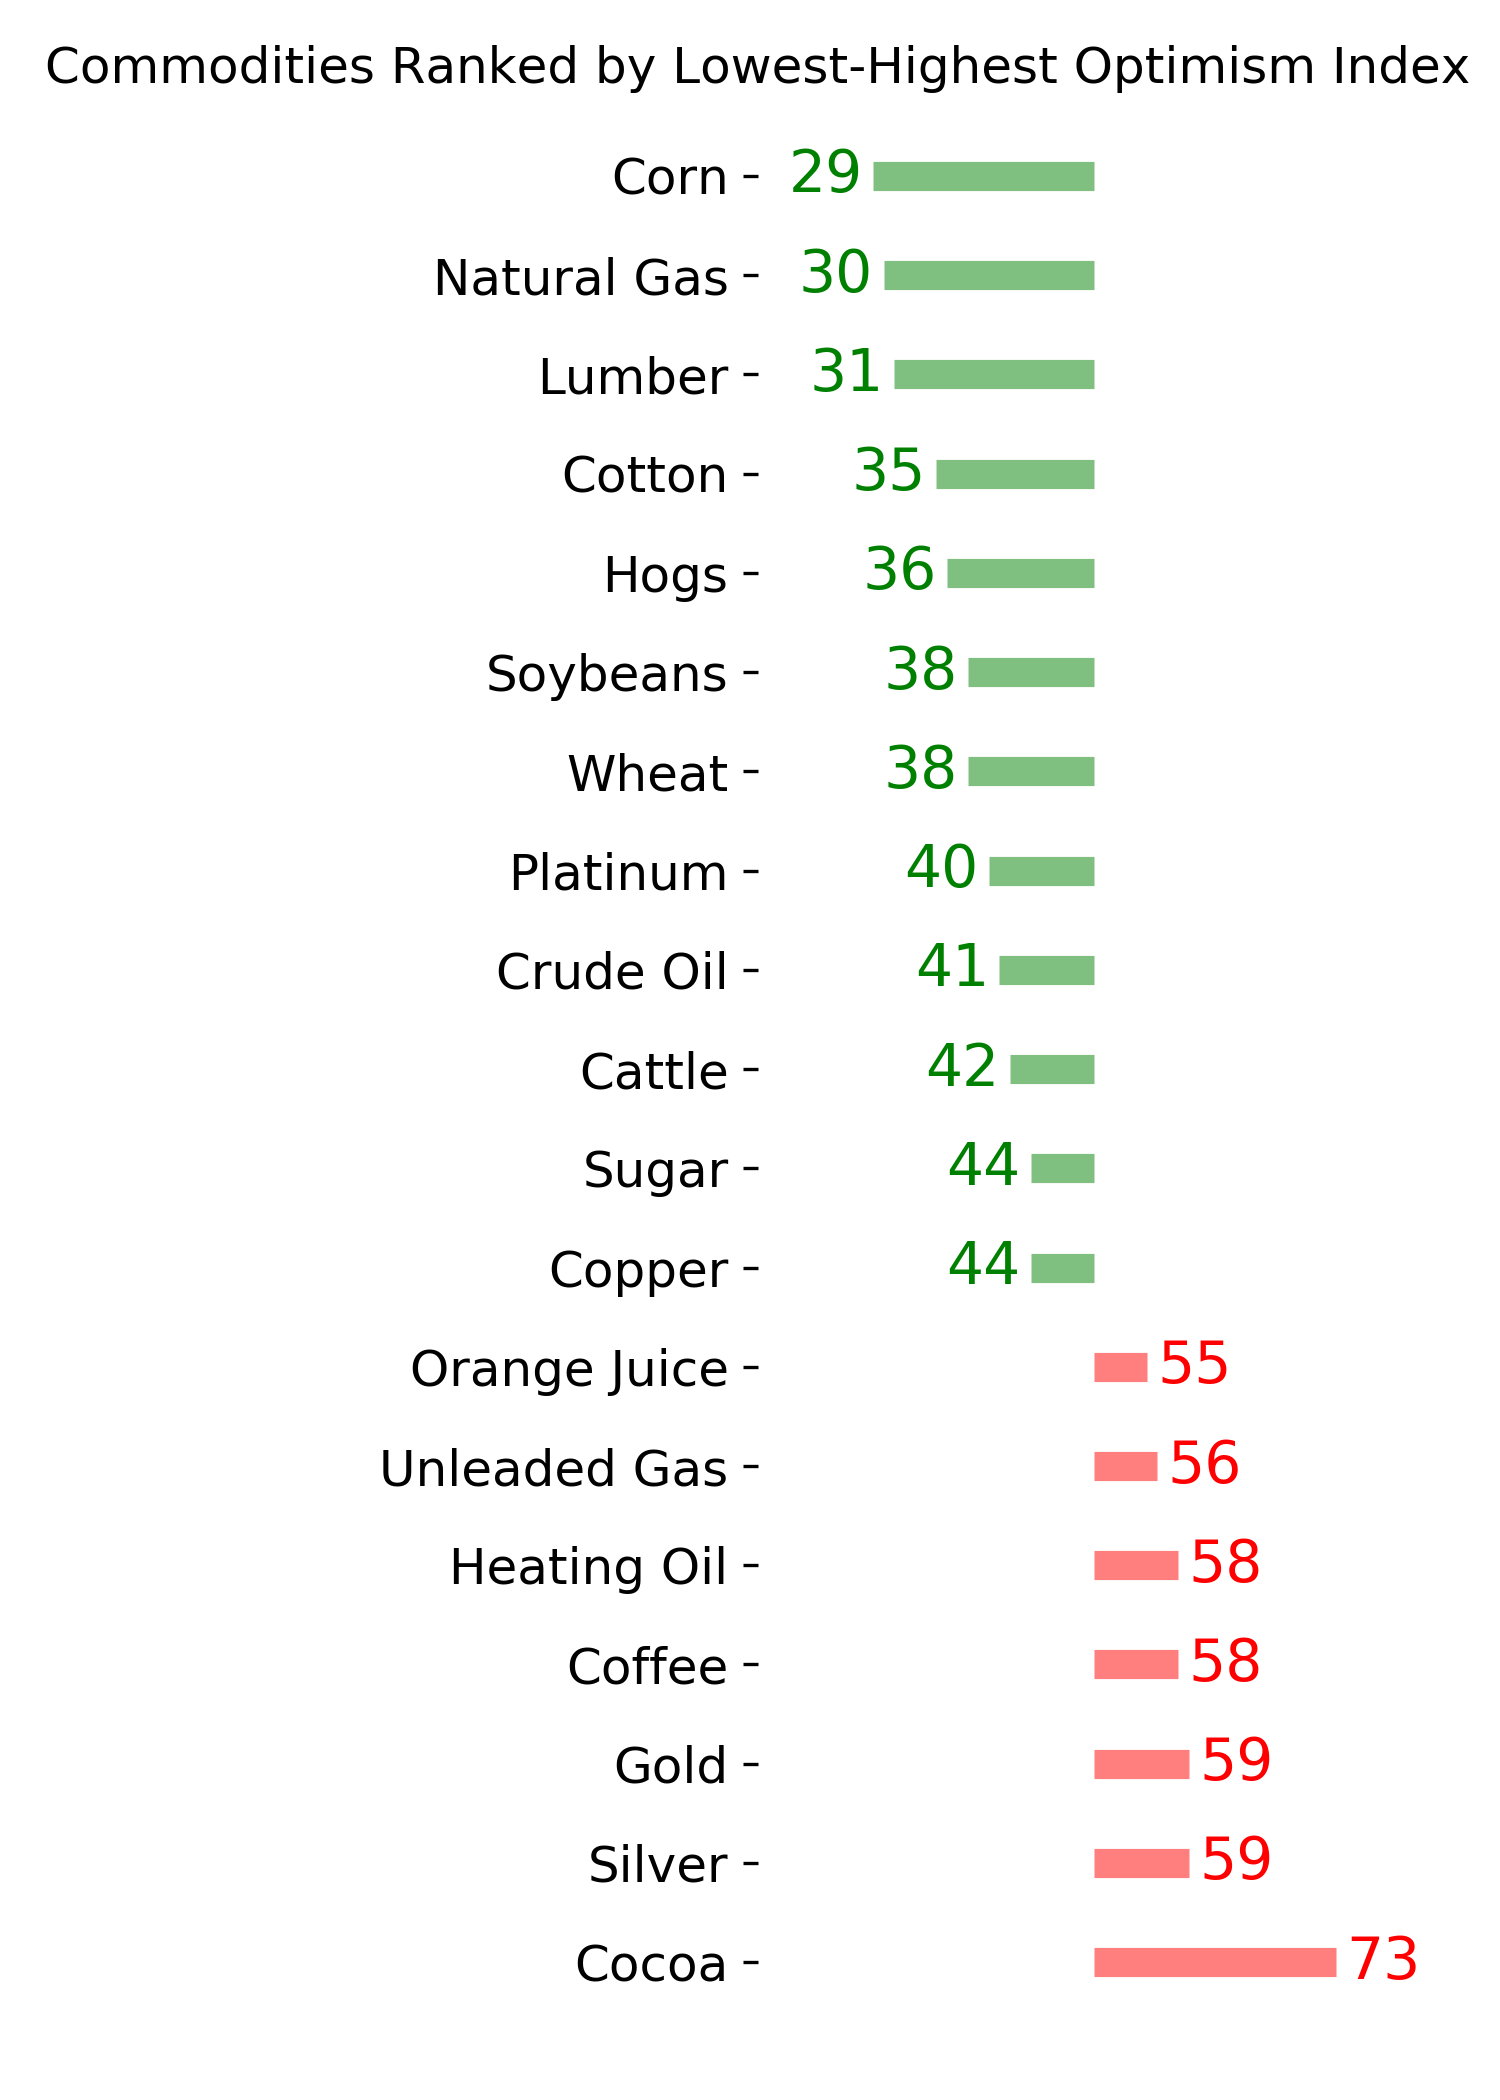
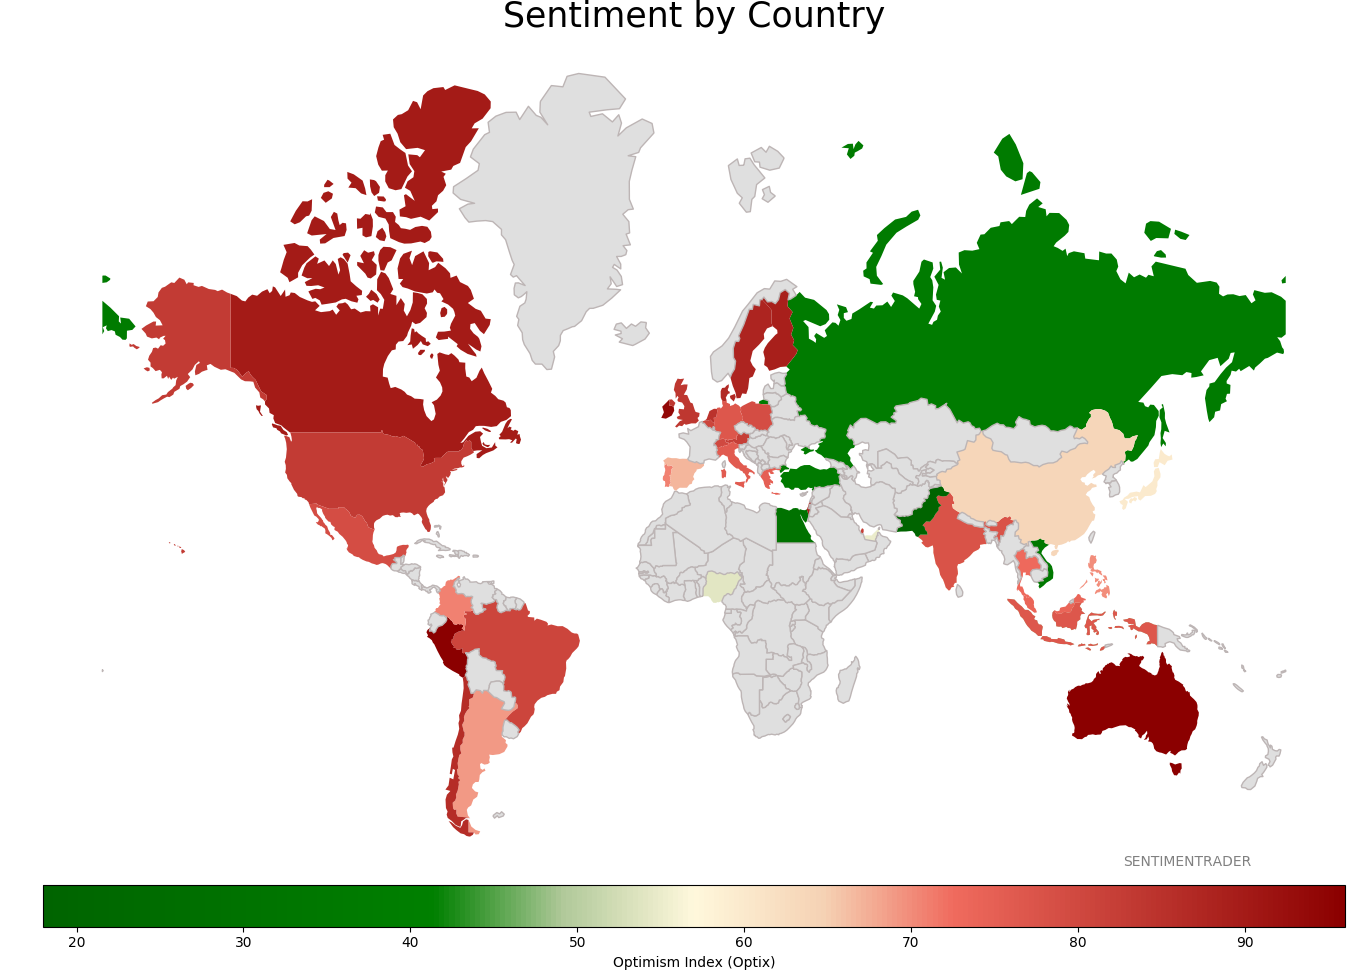
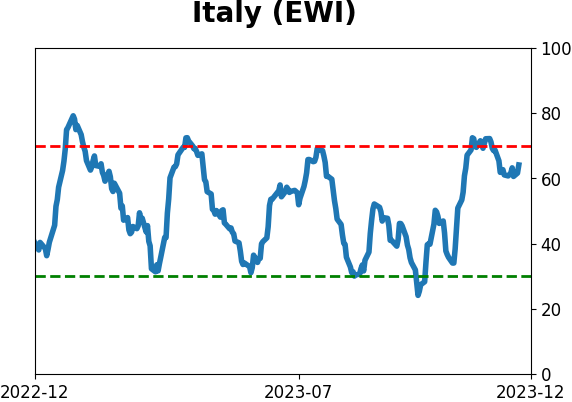
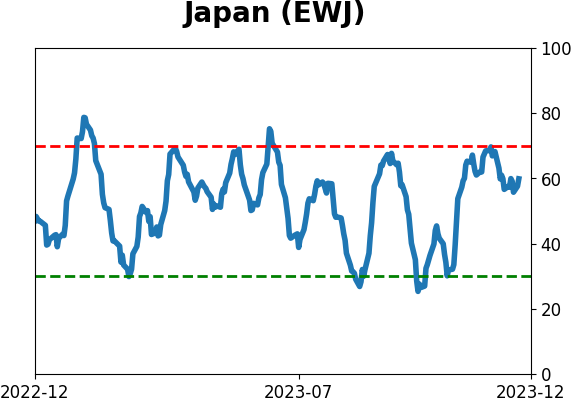
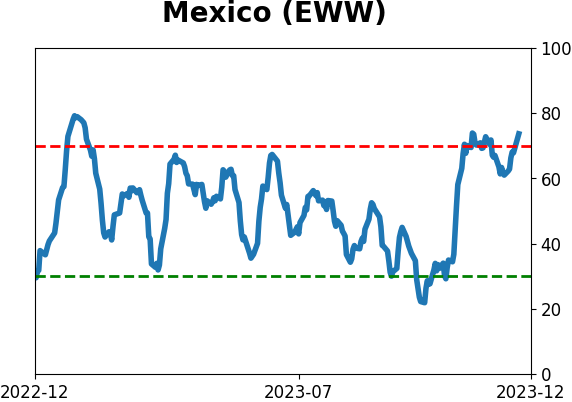
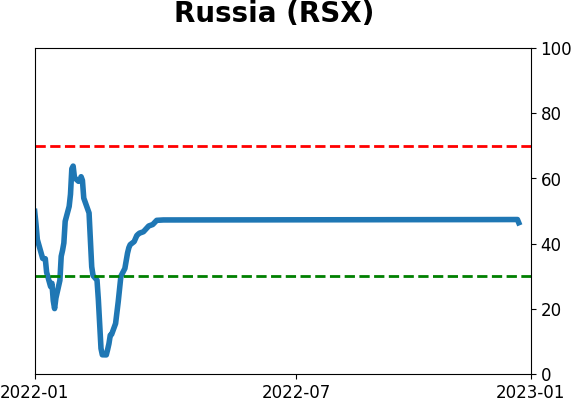
Sentiment Around The World
Optimism Index Thumbnails
|
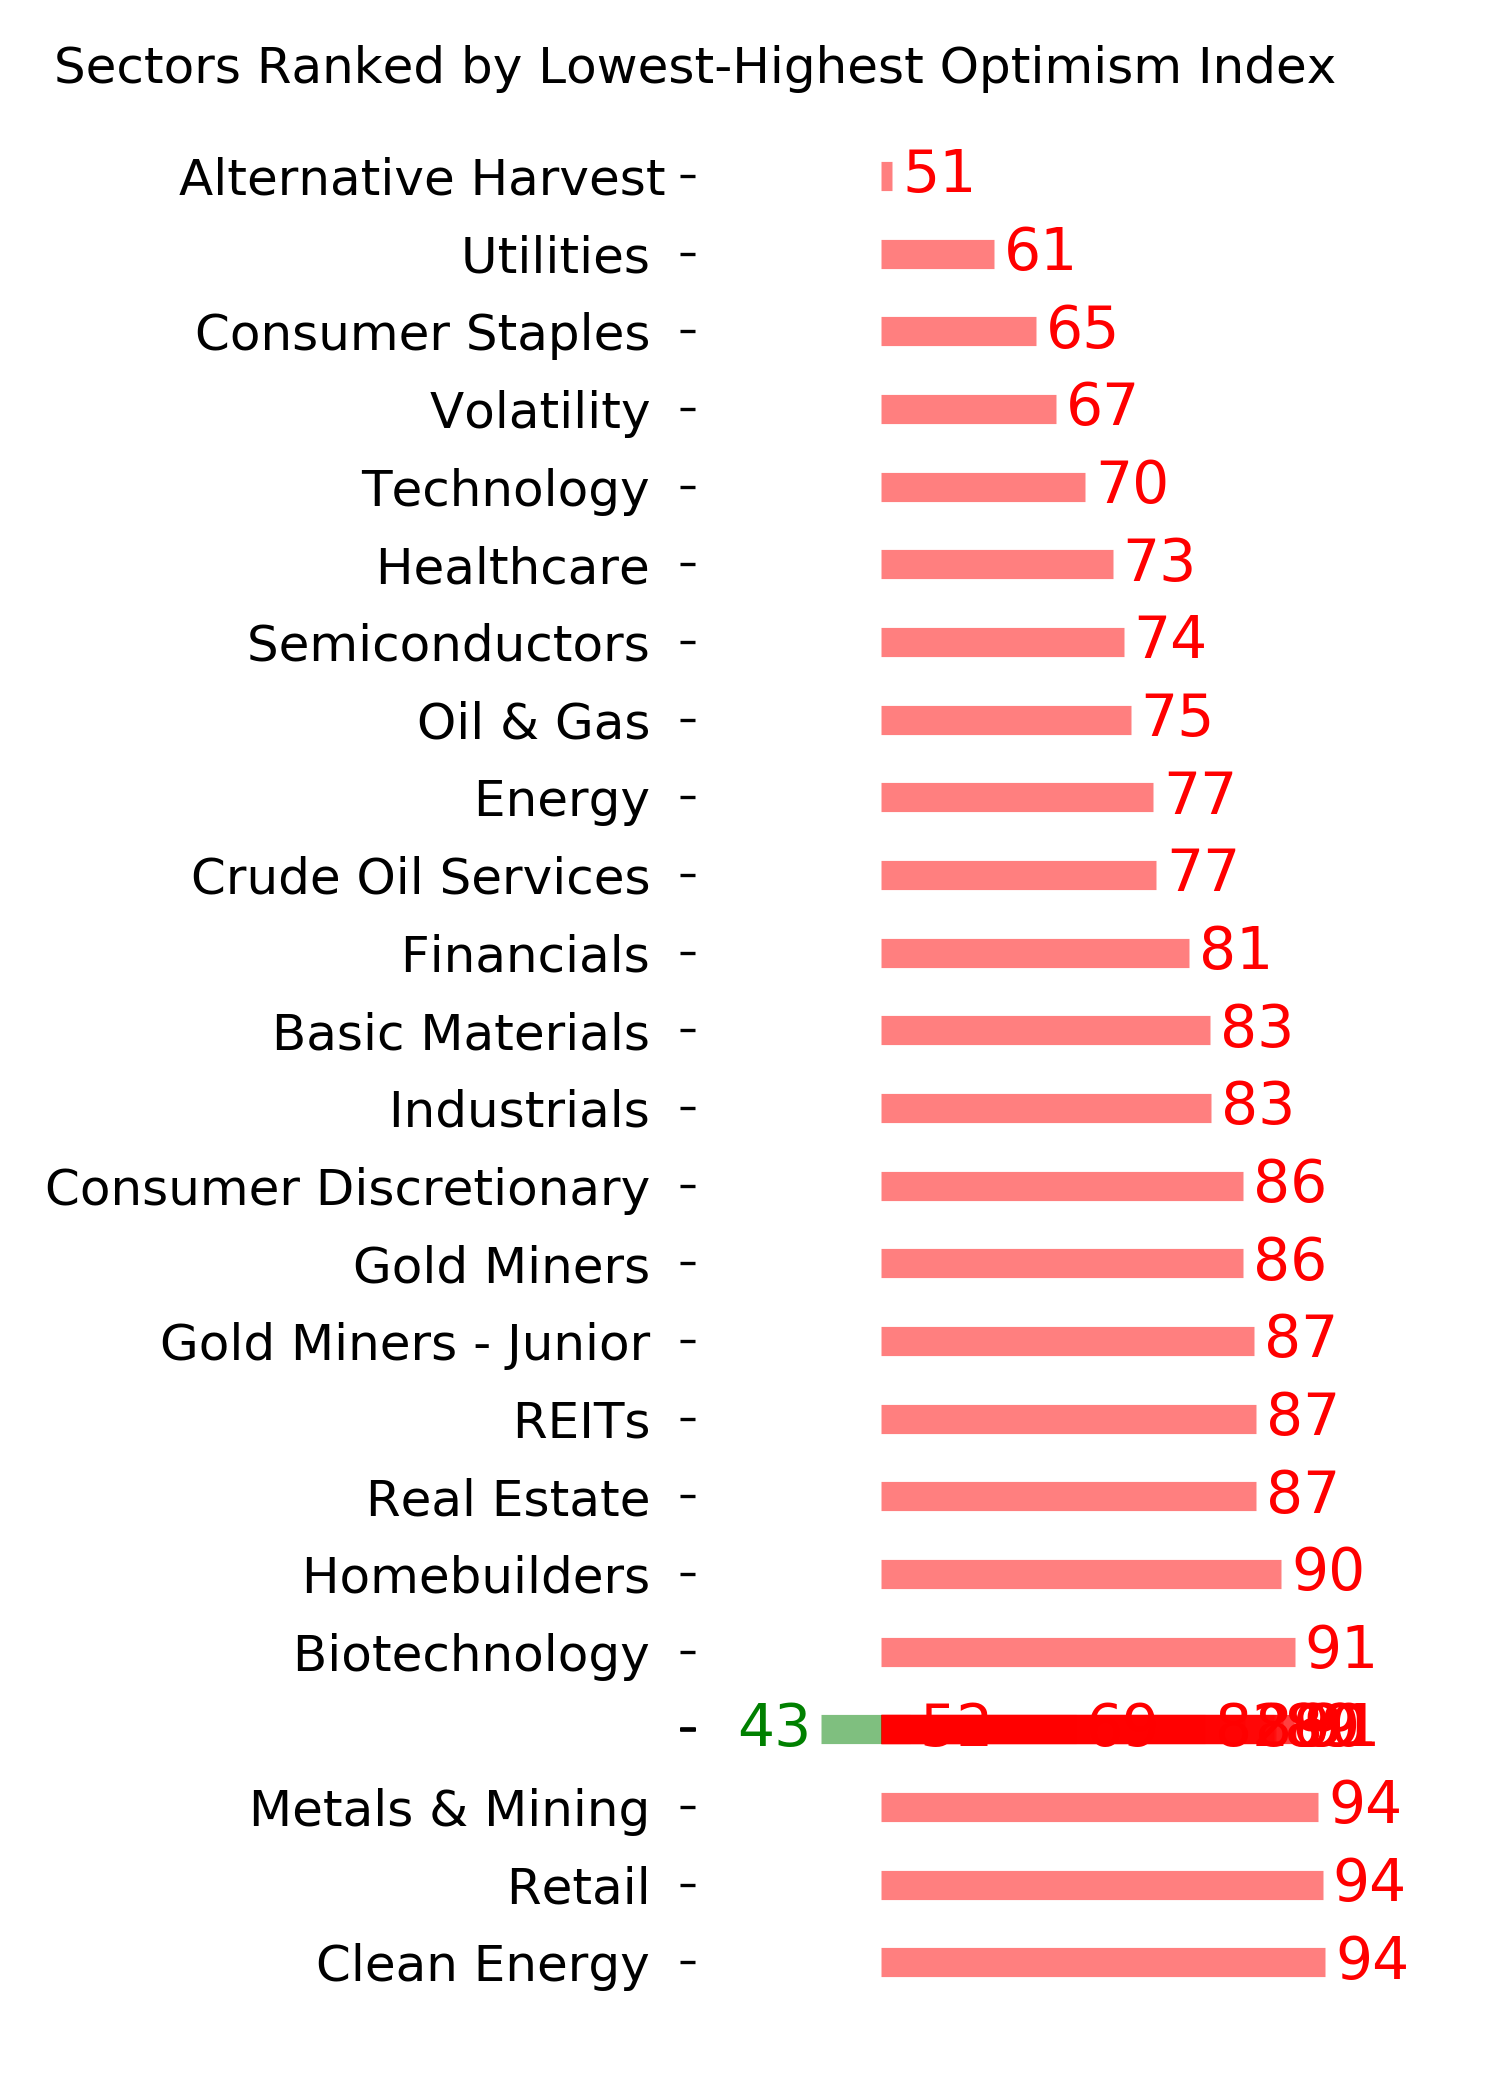
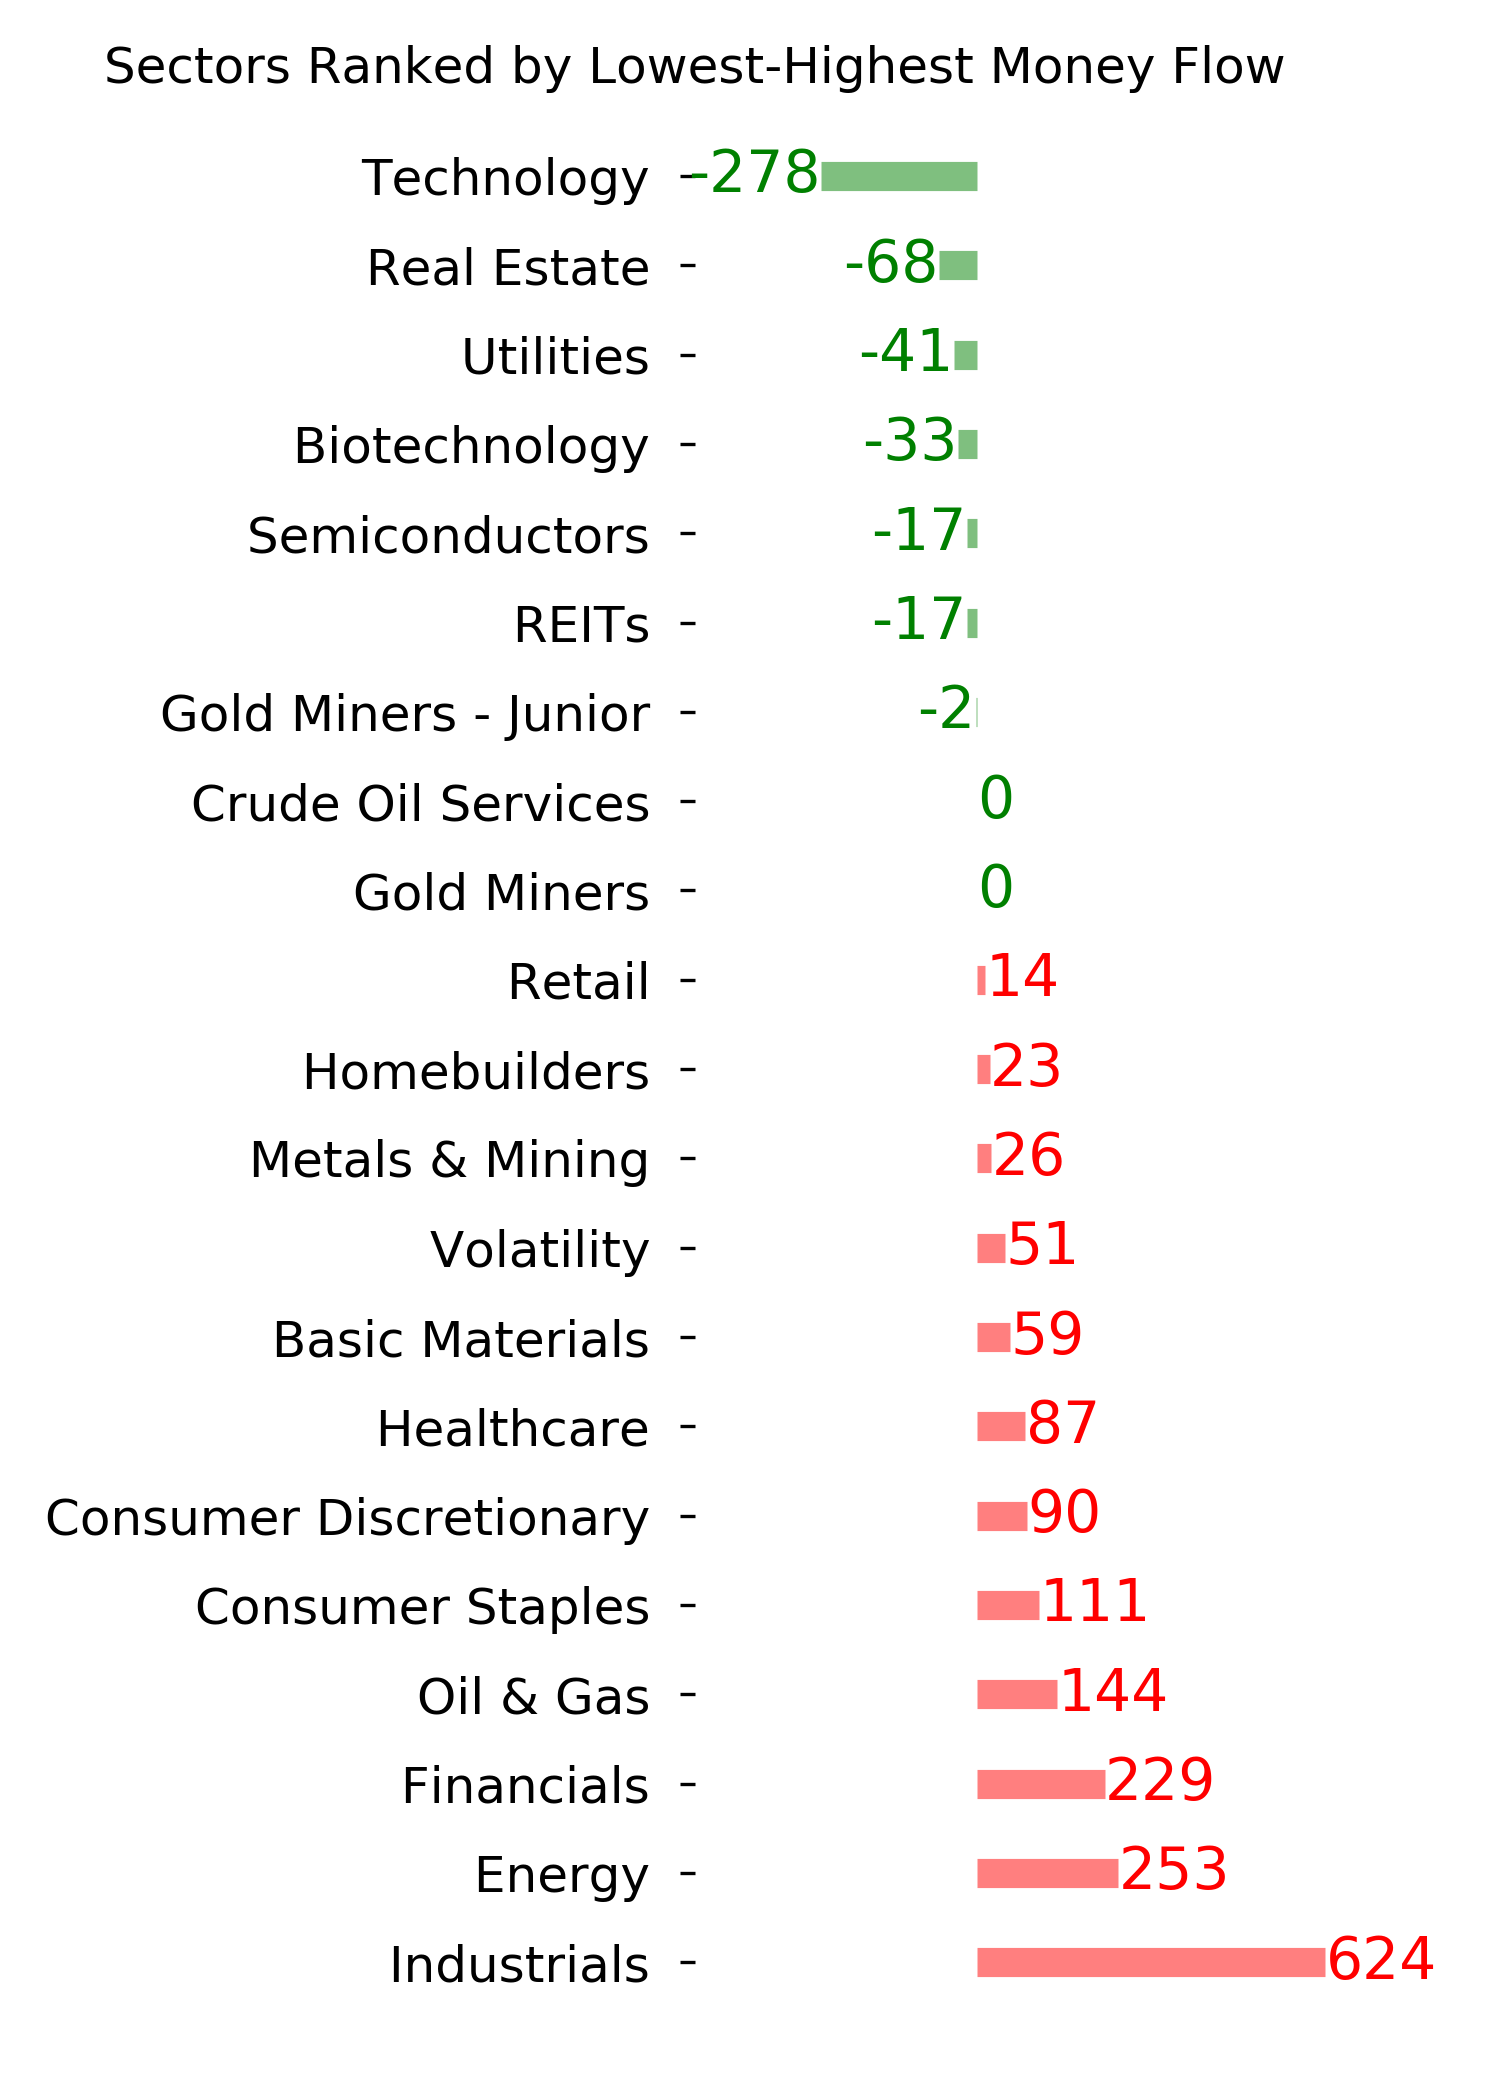
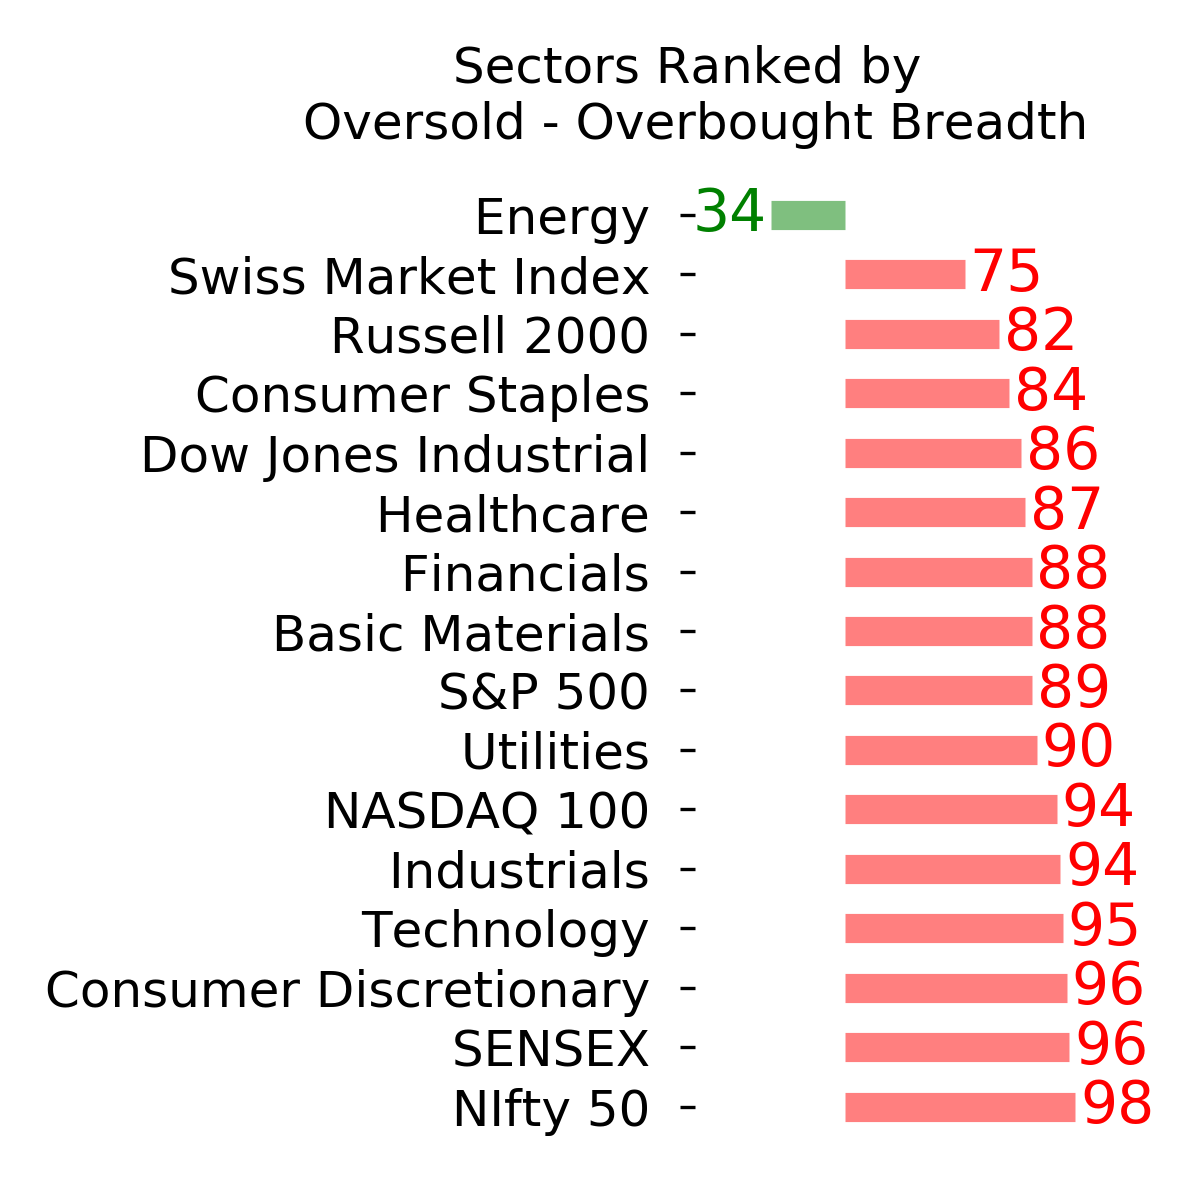
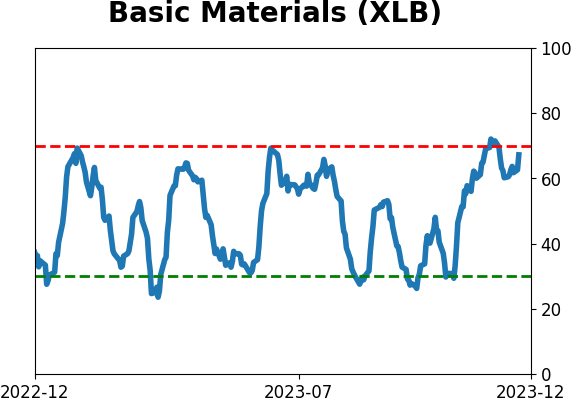
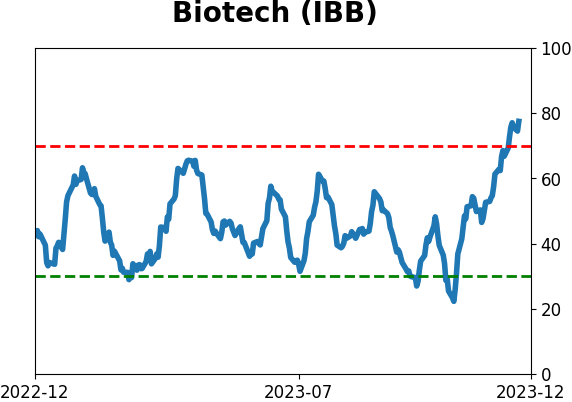
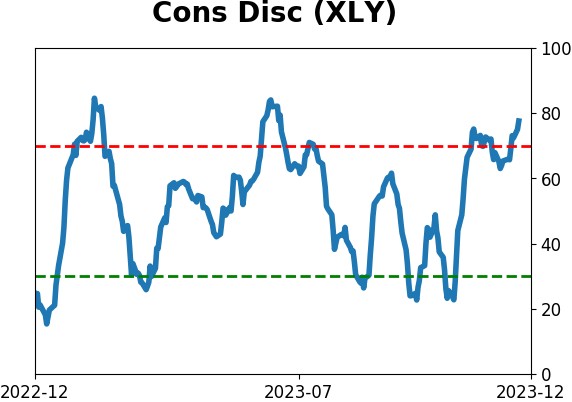
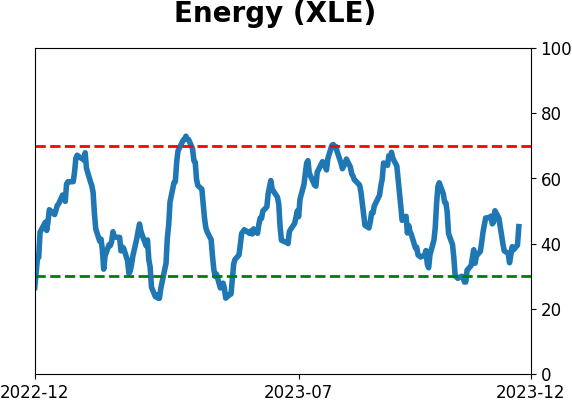
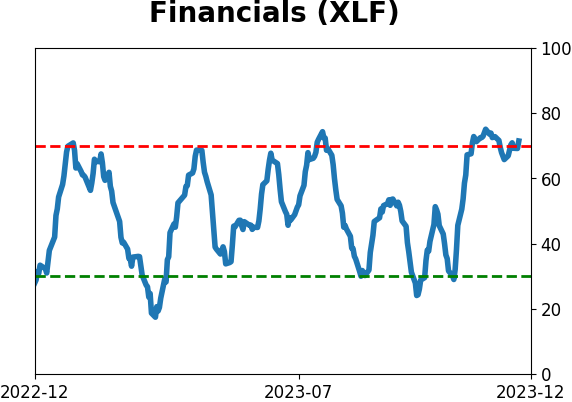
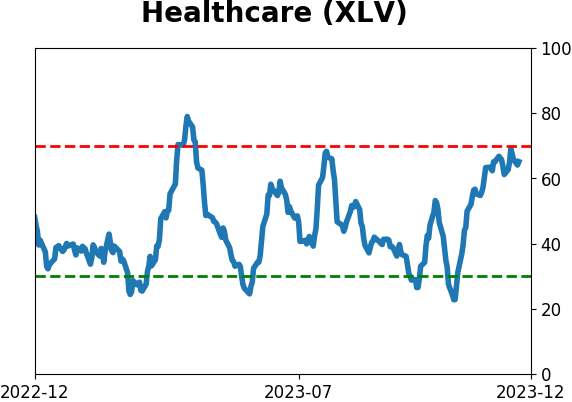
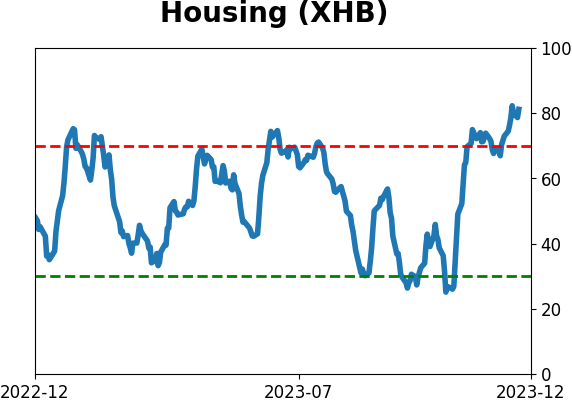
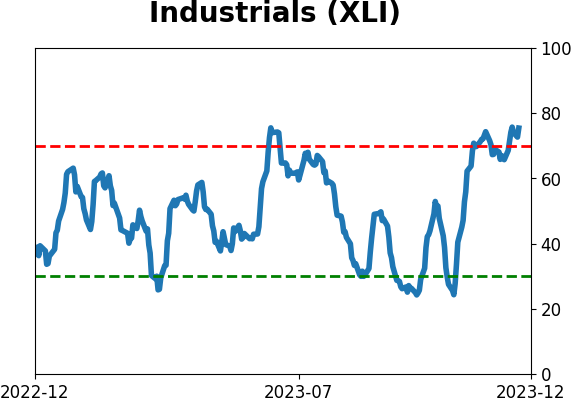
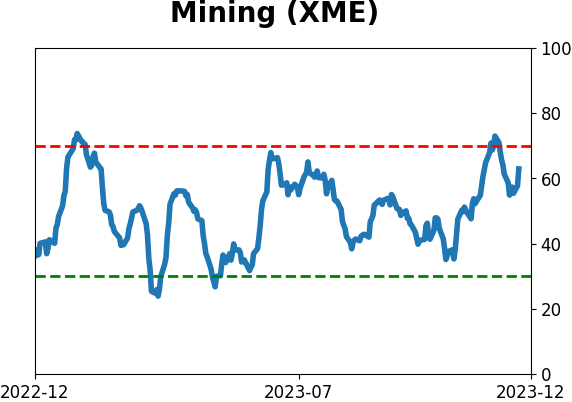
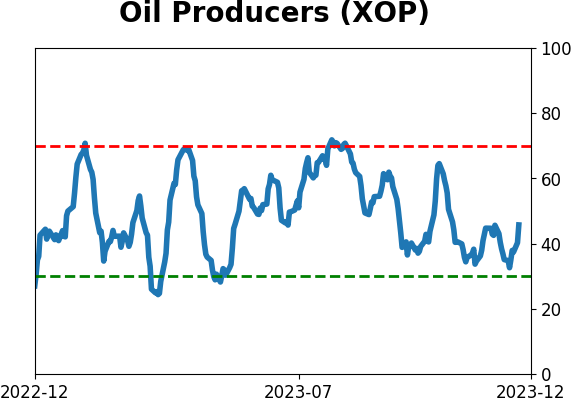
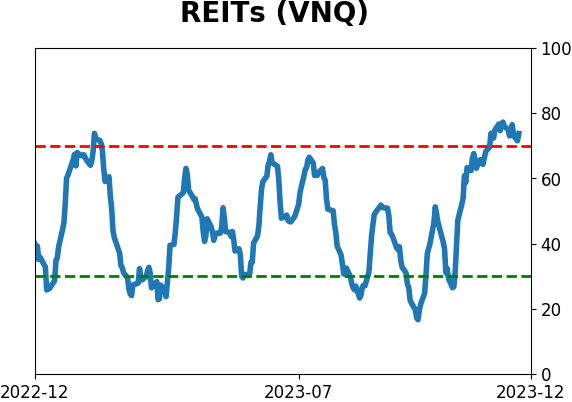
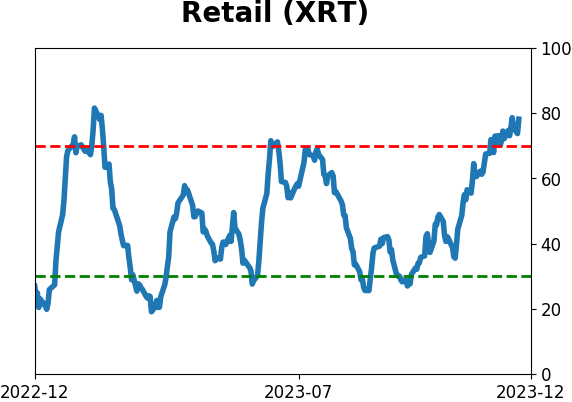
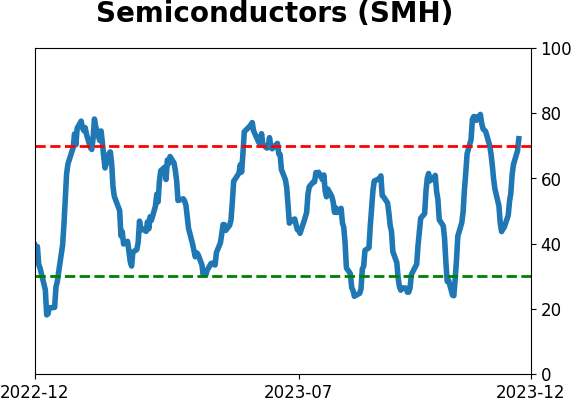
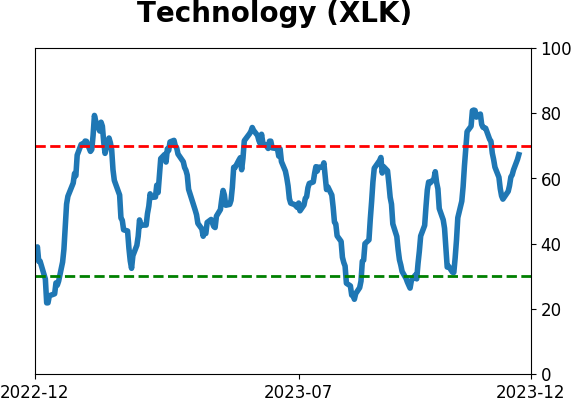
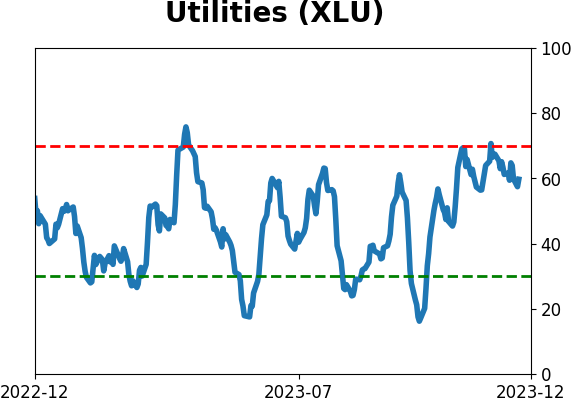
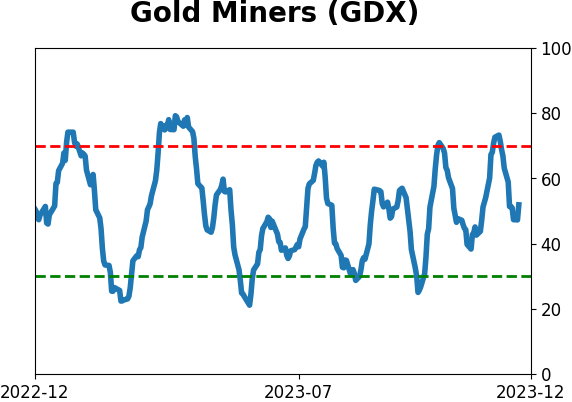
Sector ETF's - 10-Day Moving Average
|
|
|
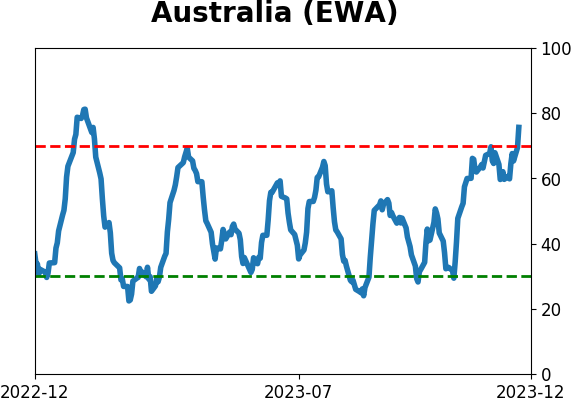
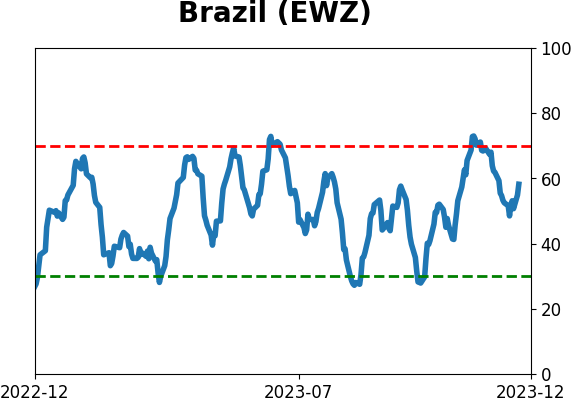
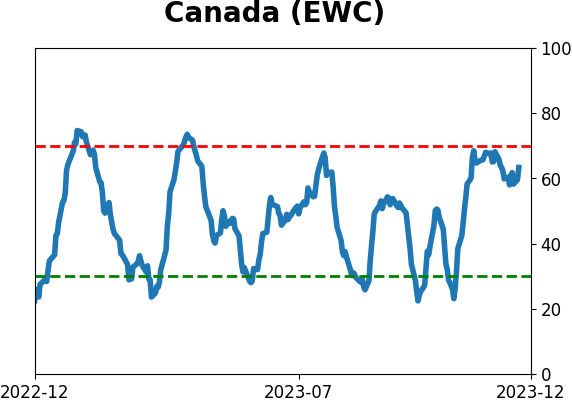
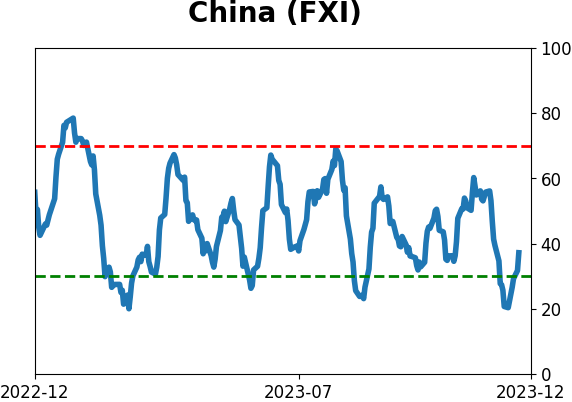
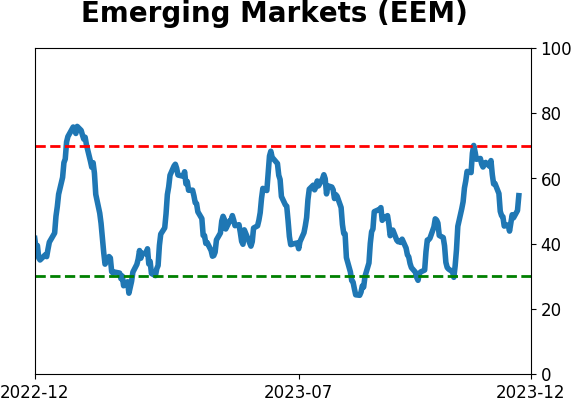
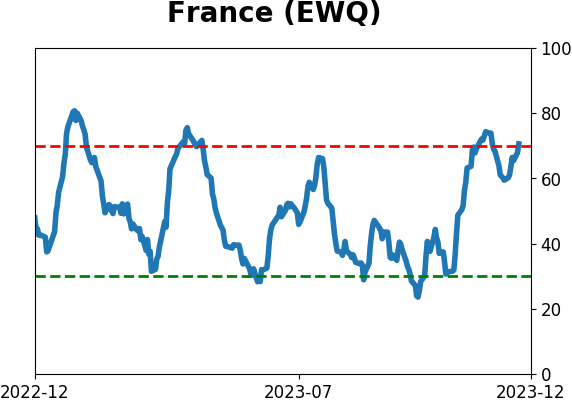
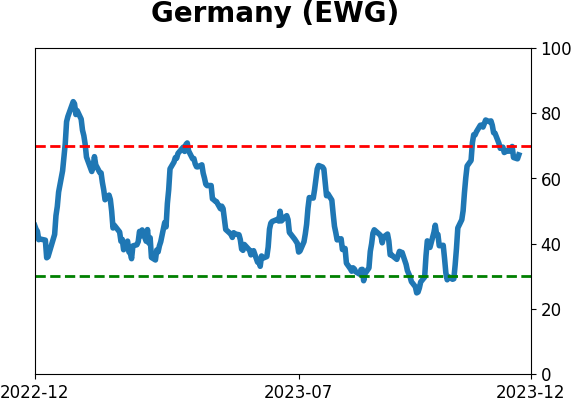
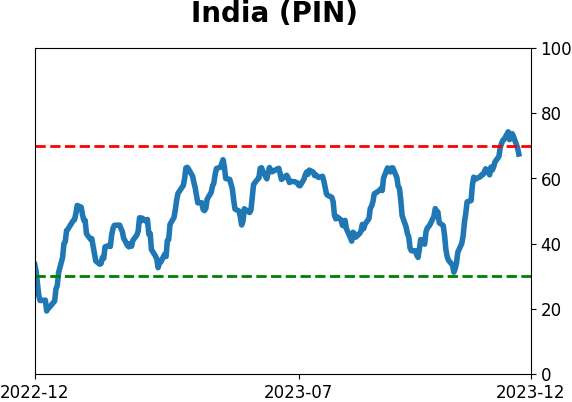
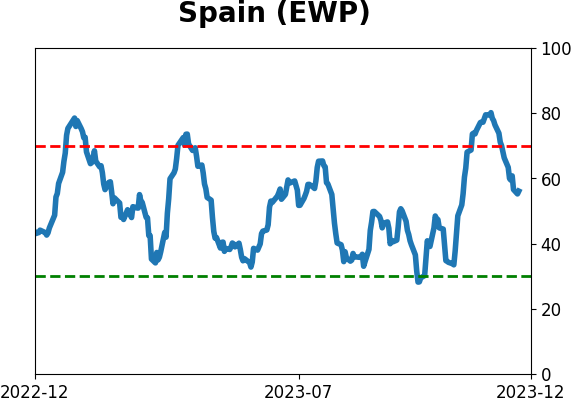
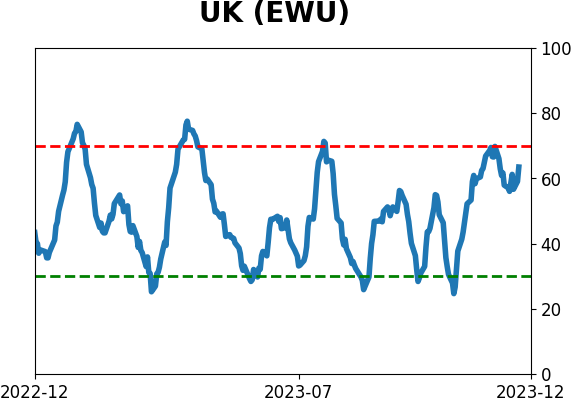
Country ETF's - 10-Day Moving Average
|
|
|
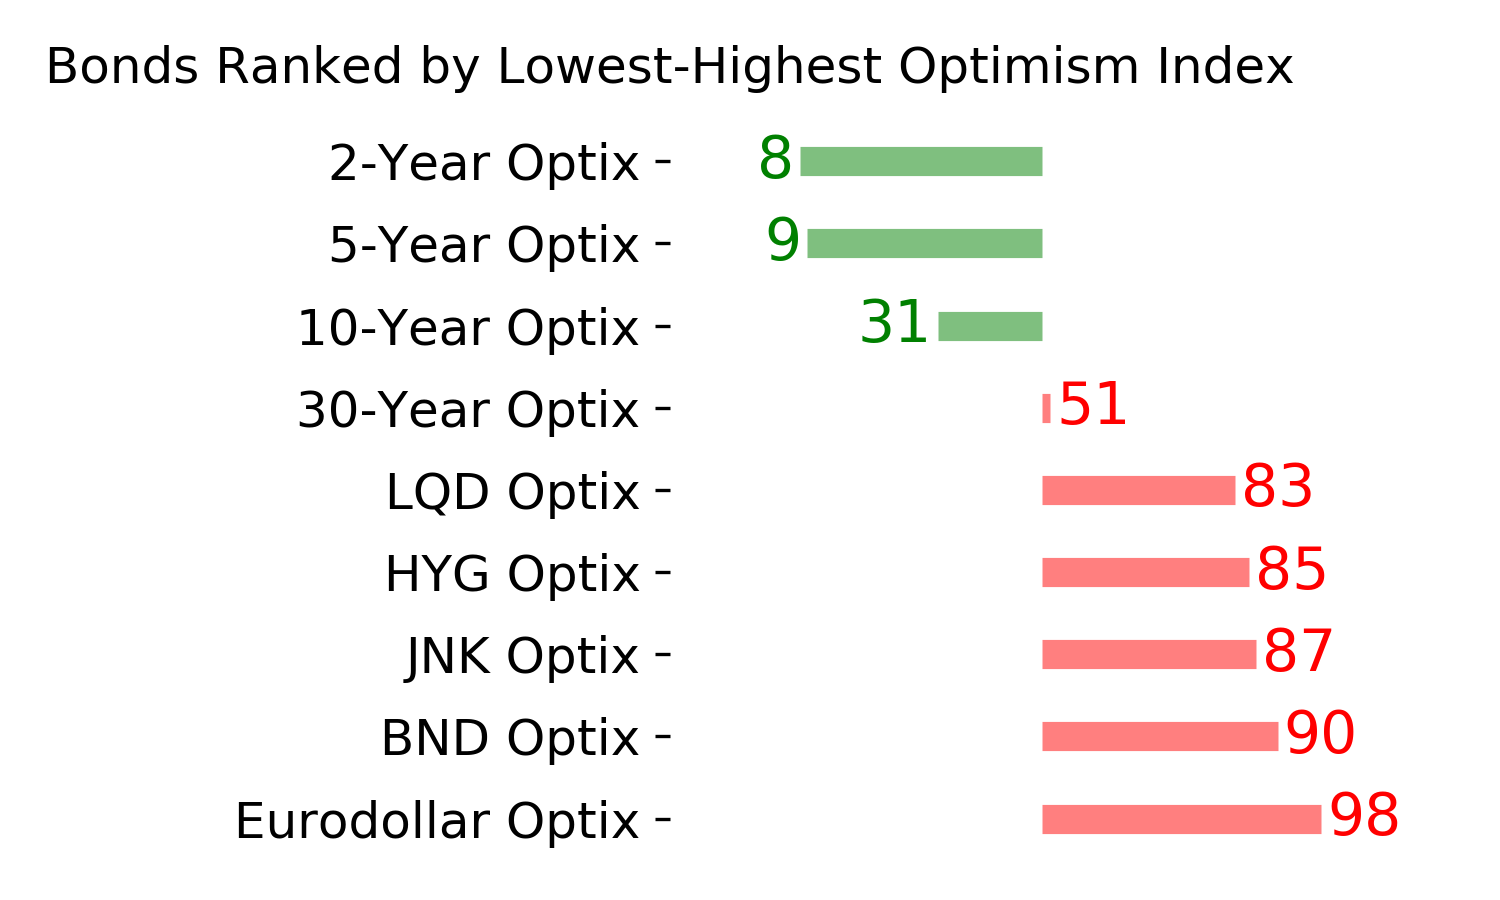
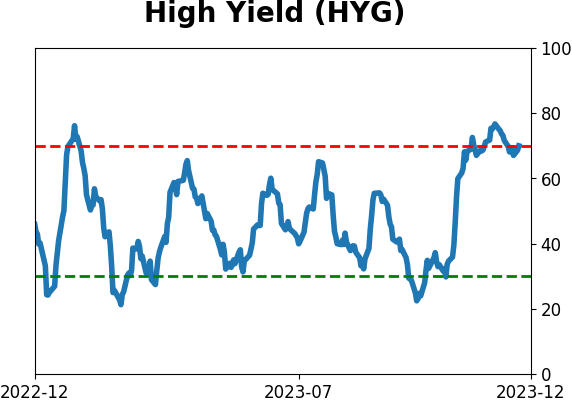
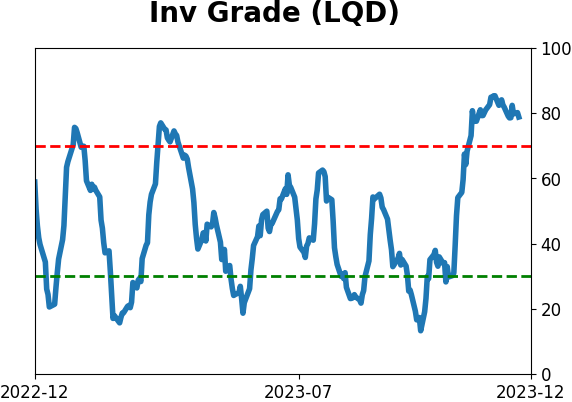
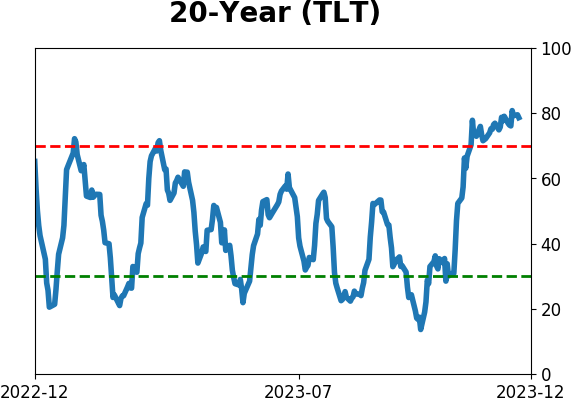
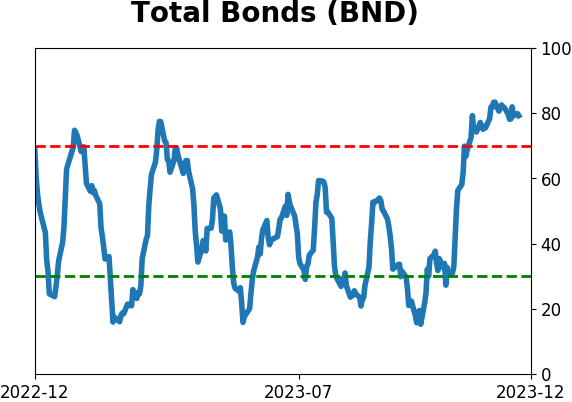
Bond ETF's - 10-Day Moving Average
|
|
|
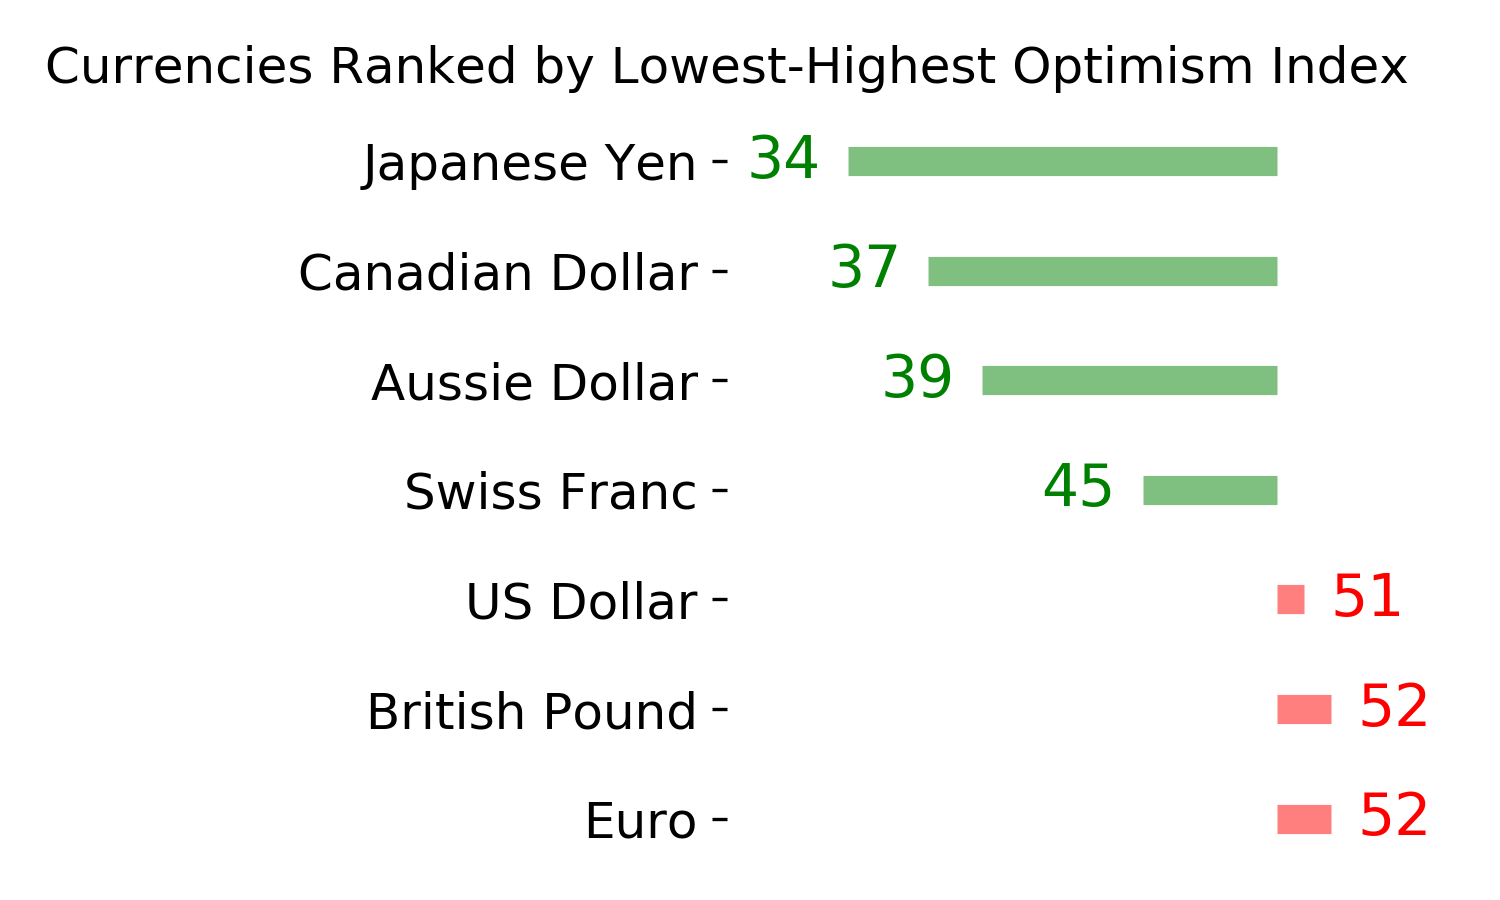
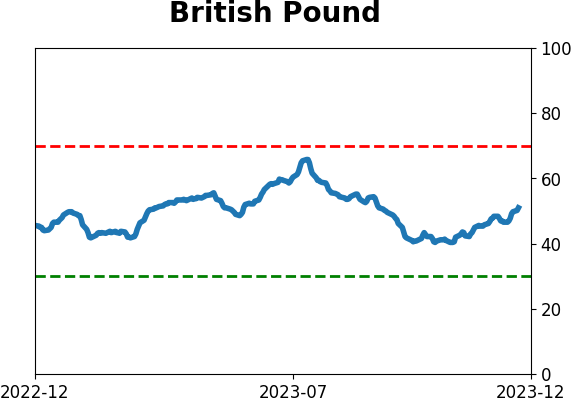
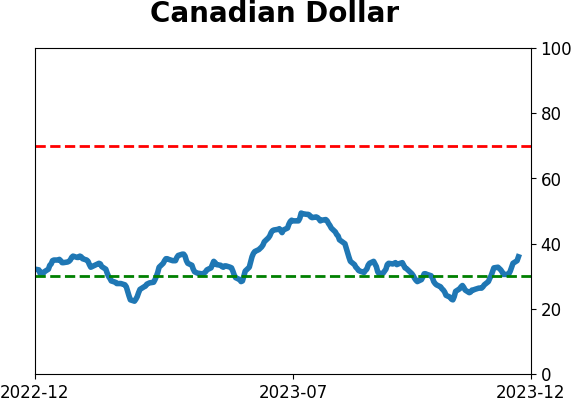
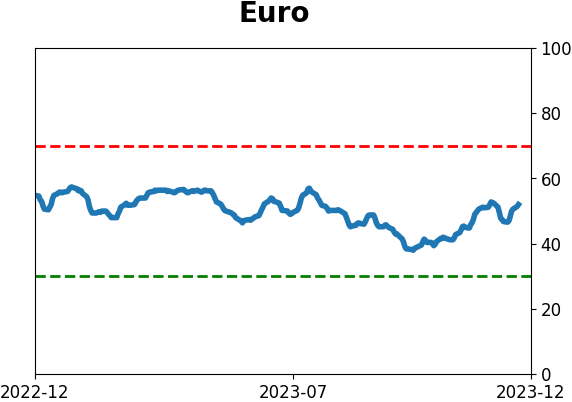
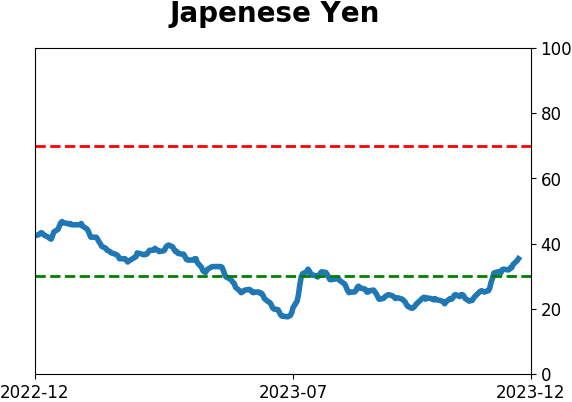
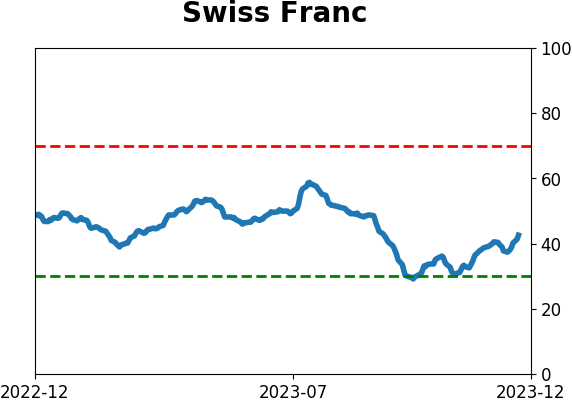
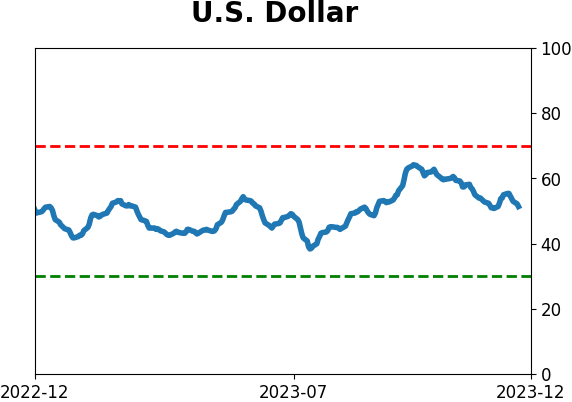
Currency ETF's - 5-Day Moving Average
|
|
|
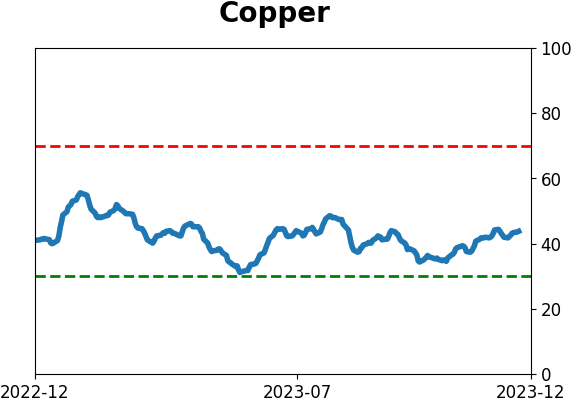
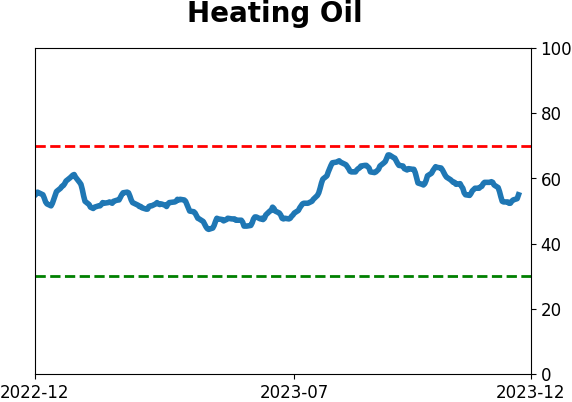
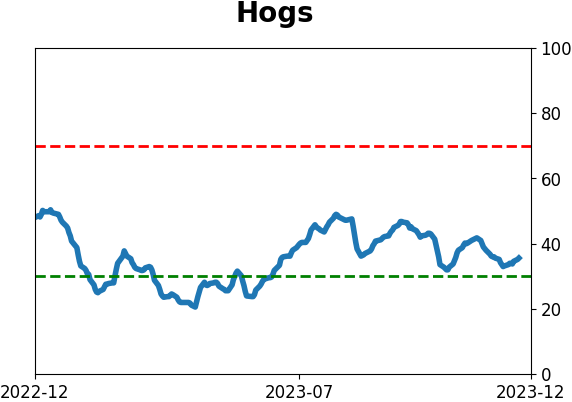
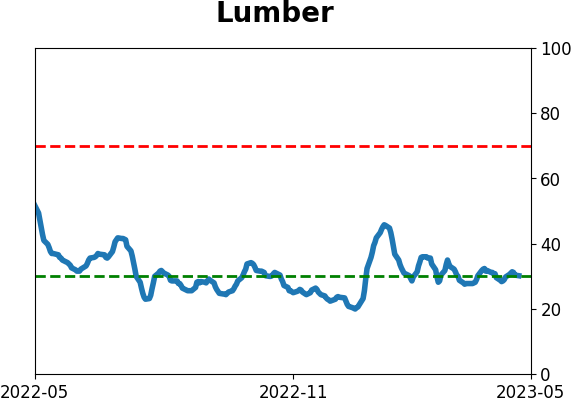
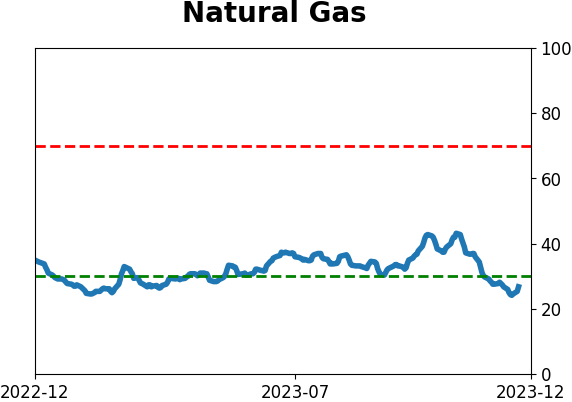
Commodity ETF's - 5-Day Moving Average
|
|