Headlines
|
|
The Dow becomes first to score a record high, with excellent participation:
The Dow Industrials finally reached a record high last week, ending a long streak without one. Internal participation has been good, as the Dow's McClellan Summation Index also reached a multi-year high. The Dow is the first of the "big four" indexes to hit a record, which has not been a bad sign for other indexes.
|
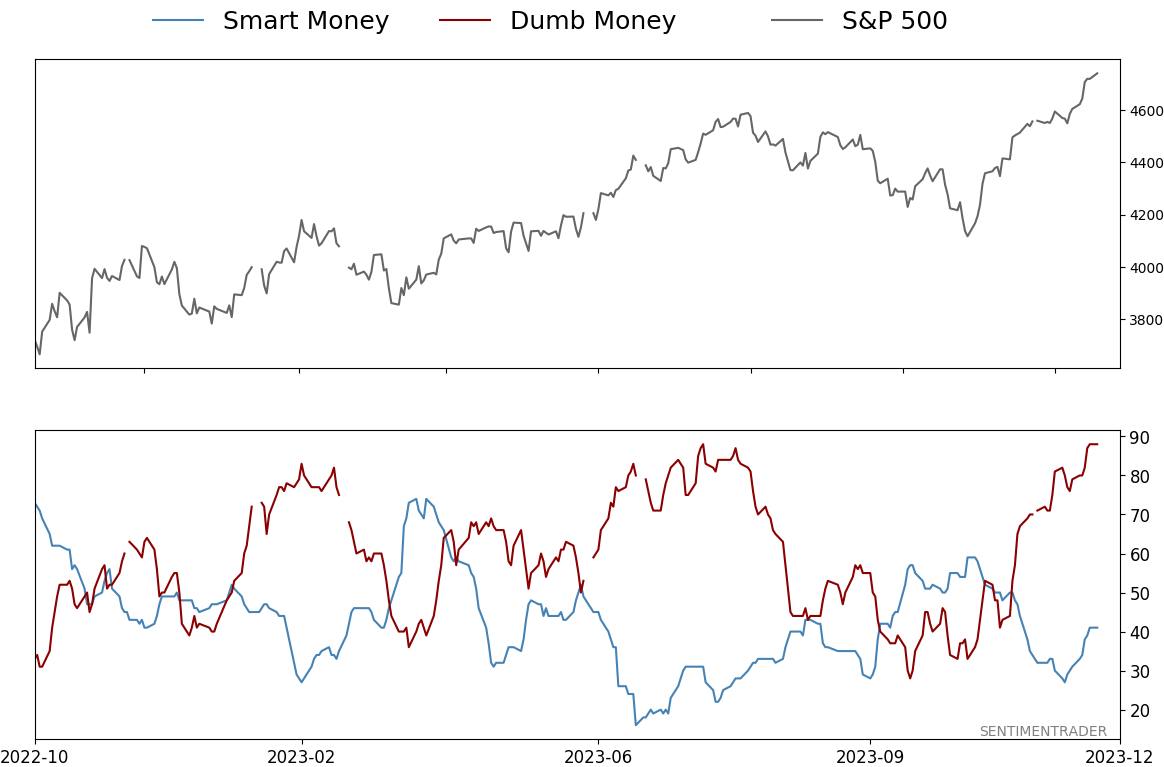
Smart / Dumb Money Confidence
|
Smart Money Confidence: 41%
Dumb Money Confidence: 88%
|
|
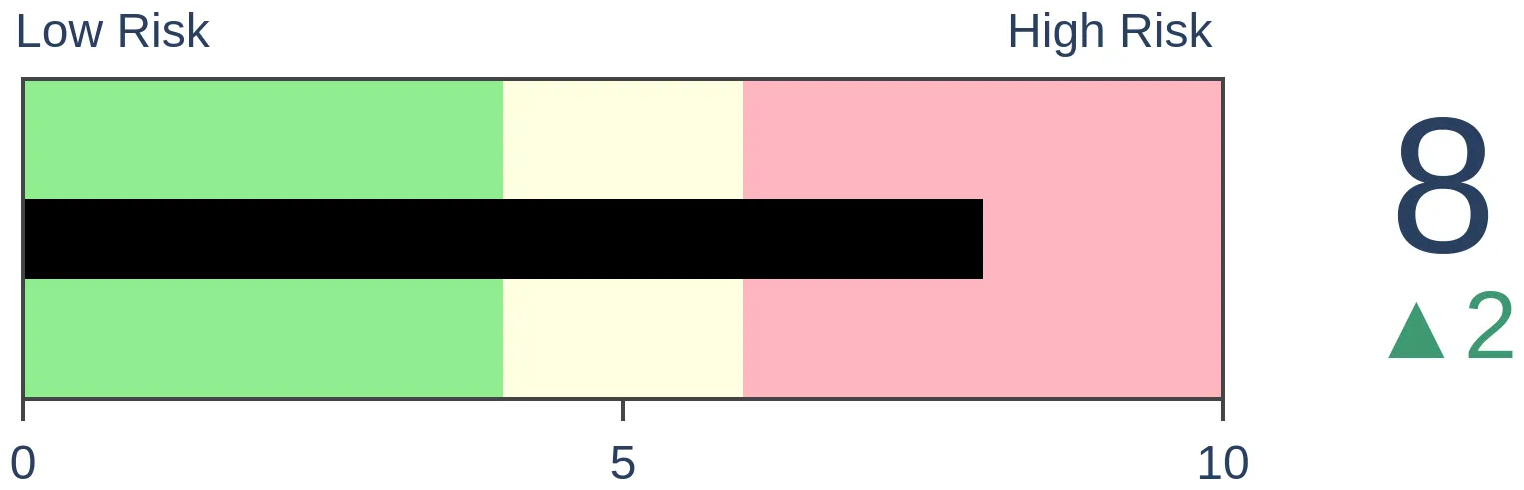
Risk Levels
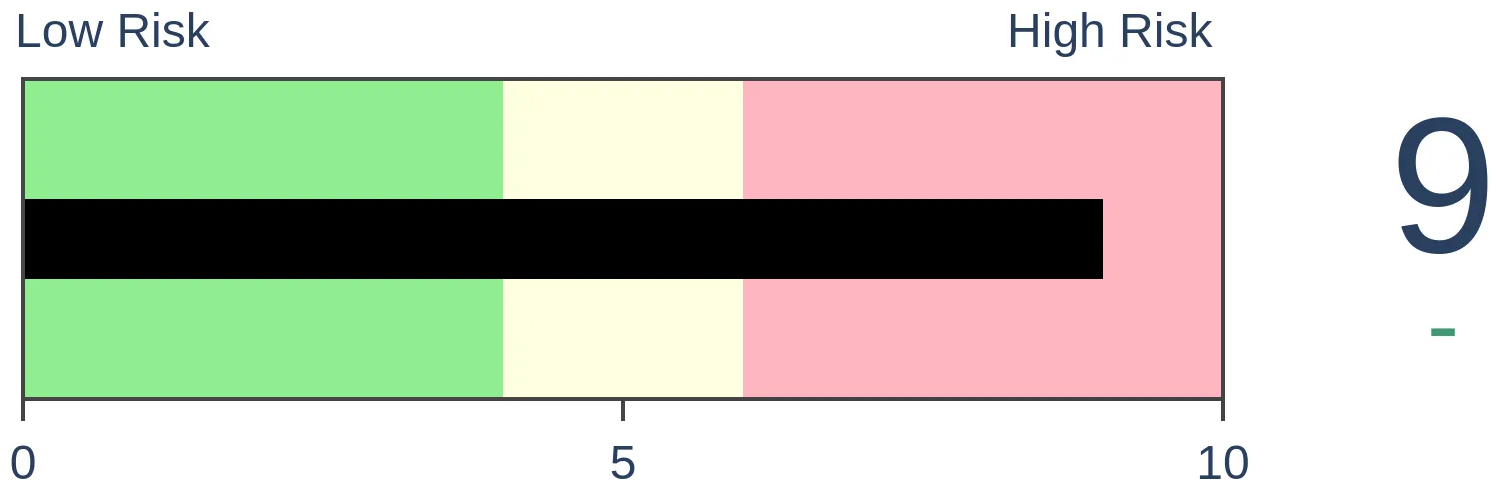
Stocks Short-Term
|
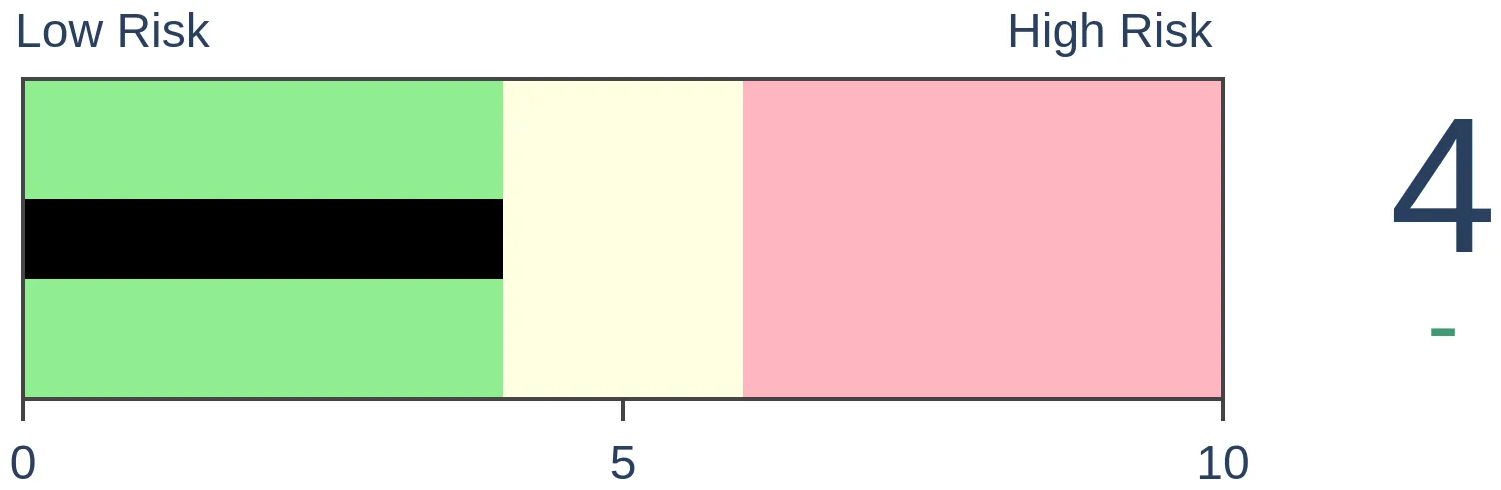
Stocks Medium-Term
|
|
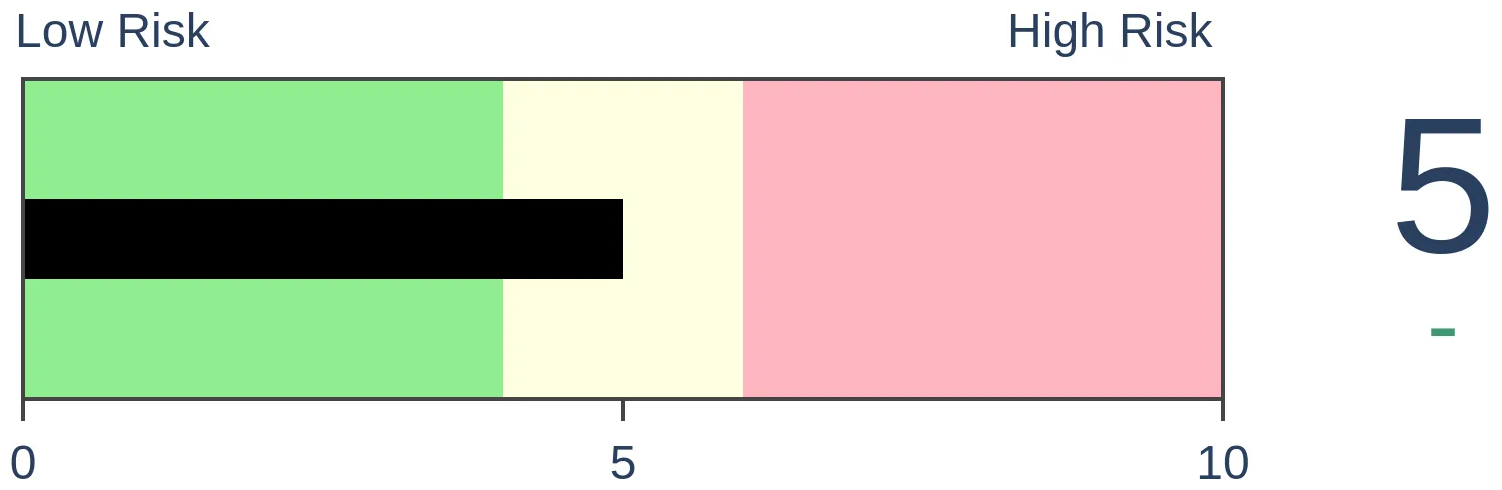
Bonds

|
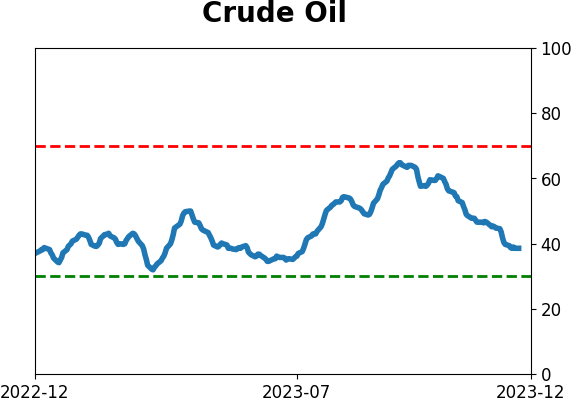
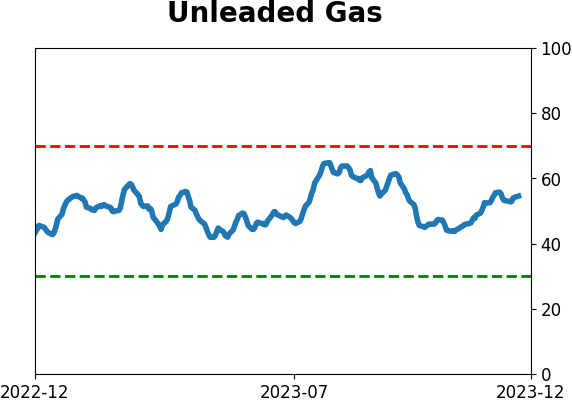
Crude Oil
|
|
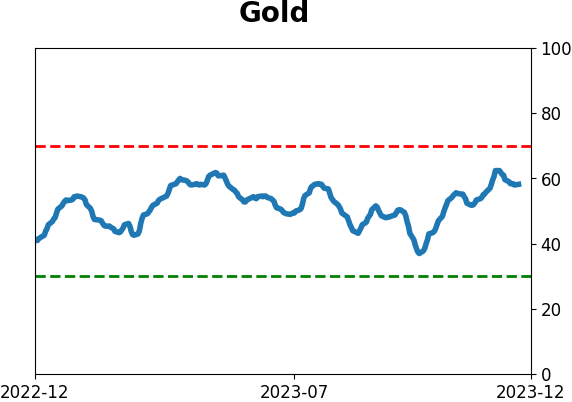
Gold

|
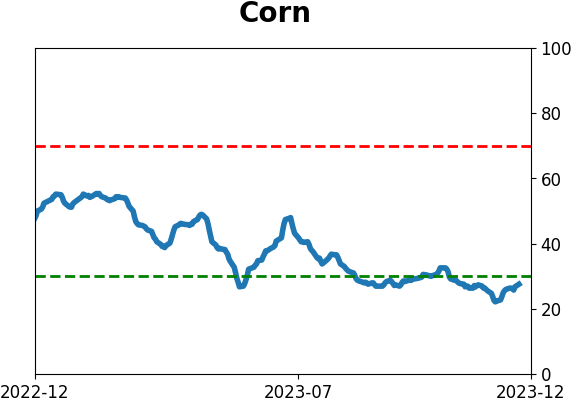
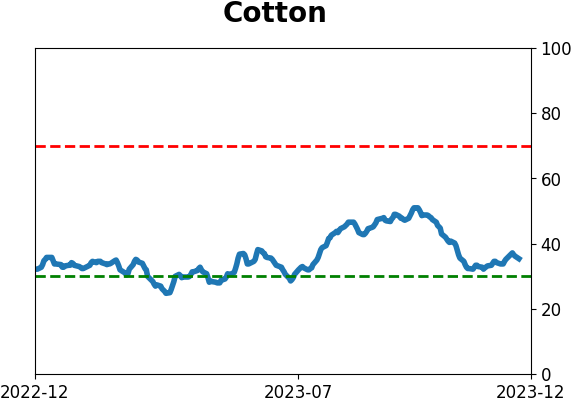
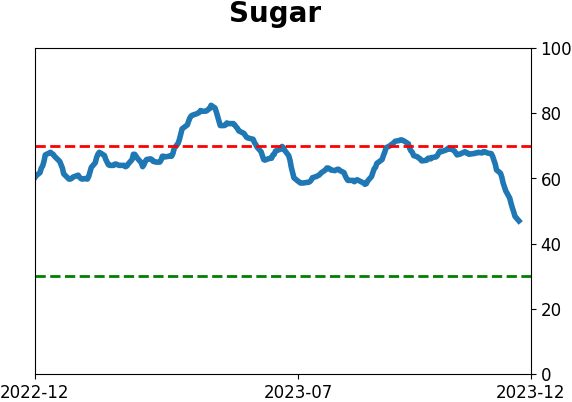
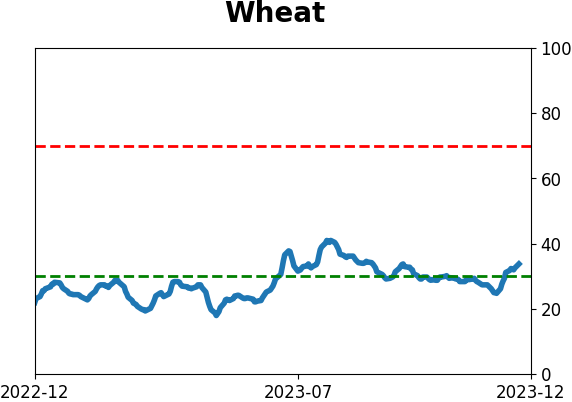
Agriculture
|
|
Research
By Jason Goepfert
BOTTOM LINE
The Dow Industrials finally reached a record high last week, ending a long streak without one. Internal participation has been good, as the Dow's McClellan Summation Index also reached a multi-year high. The Dow is the first of the "big four" indexes to hit a record, which has not been a bad sign for other indexes.
FORECAST / TIMEFRAME
None
|
Key points:
- The Dow Industrials reached a new high for the first time in nearly two years
- Internal participation has been good among Dow stocks, with the McClellan Summation Index also hitting a new high
- The Dow is the first of the "big four" indexes to reach a new high, which has not been a barrier to further gains
The first record in a while
The old general finally did it.
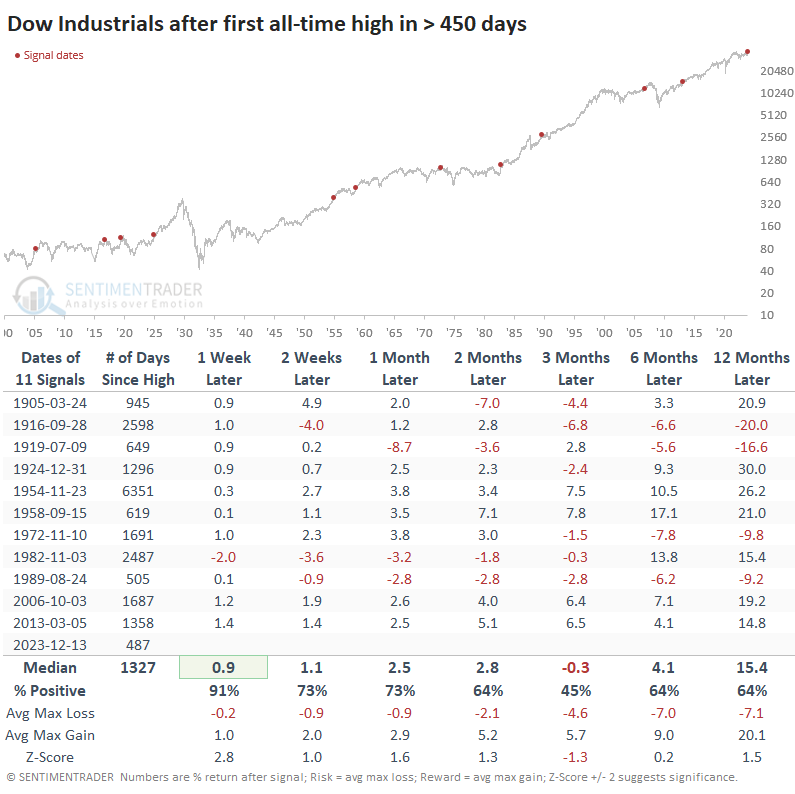
As we all know by now, the Dow Jones Industrial Average reached a new all-time high last week. It was the first record close in nearly two years, which ended one of the longer streaks since 1900.
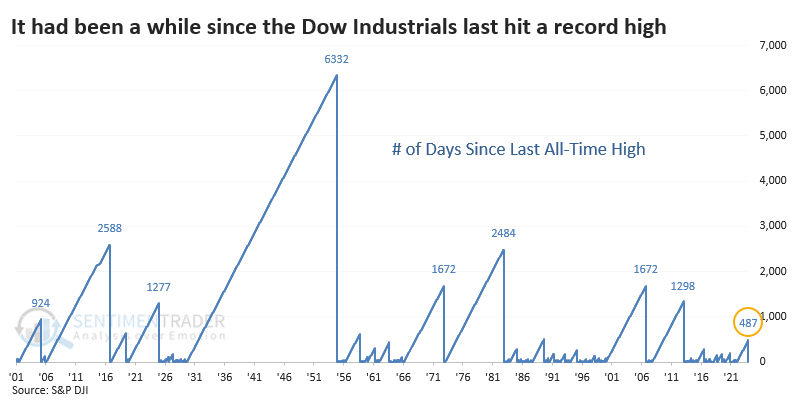
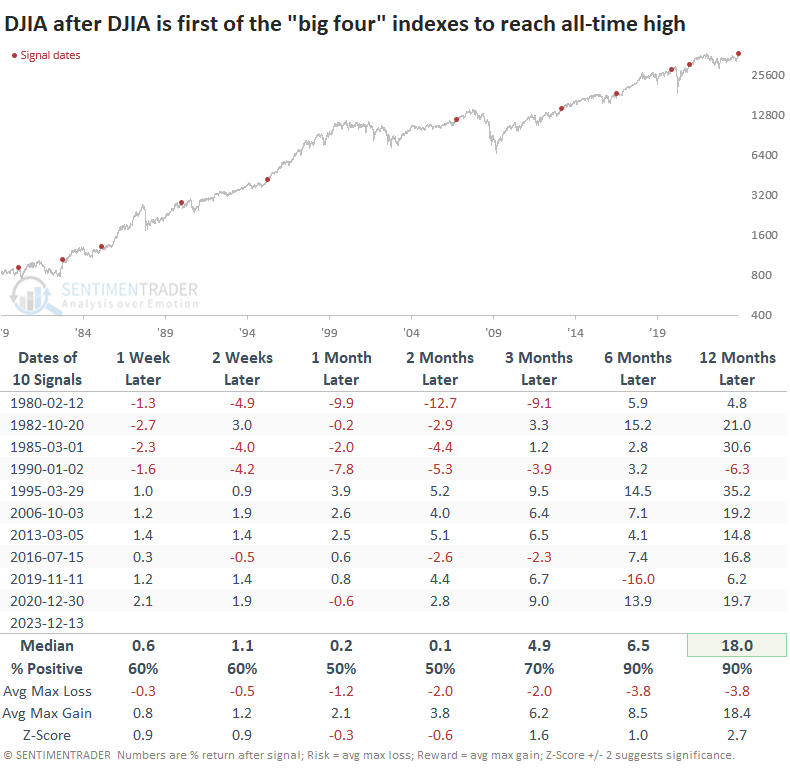
After the first new high in at least 450 trading sessions, the Dow continued to gain for the next week with only one exception but then often faltered. Three months later, it had added to its gains less than half the time, with a poor median return. Over the next year, however, it enjoyed double-digit gains after 7 of the 11 instances.
Participation has been good
One of the points that bears have loved to mock this year has been that all the gains have been due to a handful of stocks. That is demonstrably untrue, as we've discussed multiple times.
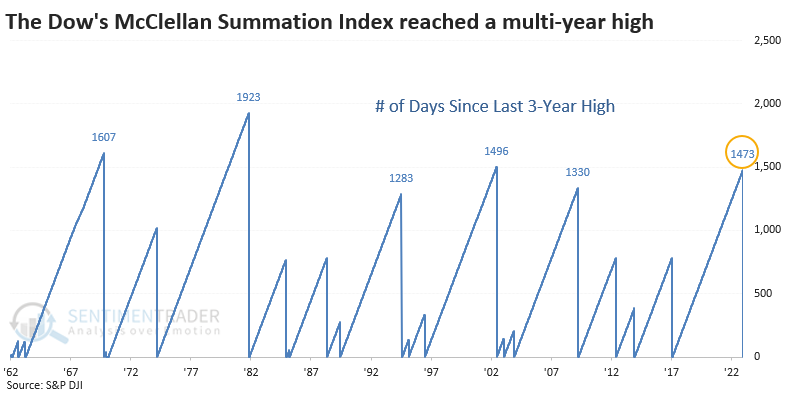
One more example of how fruitless that line of anxiety has been is that one of the best measures of the momentum of underlying participation, the McClellan Summation Index, has soared to a multi-year high for the Dow Industrials.
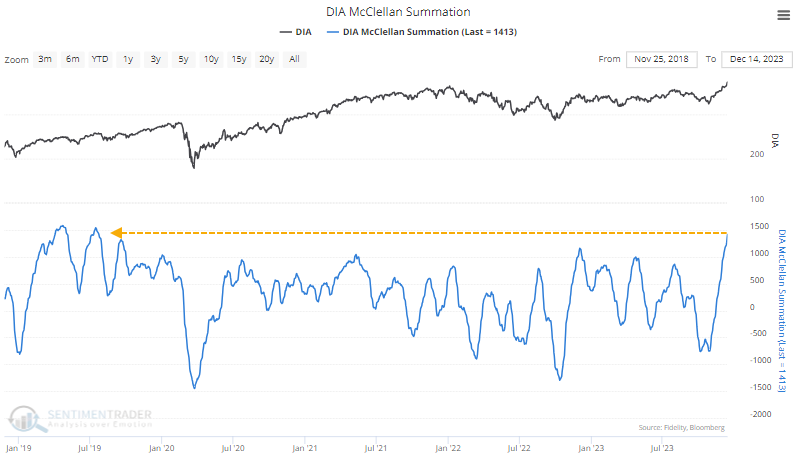
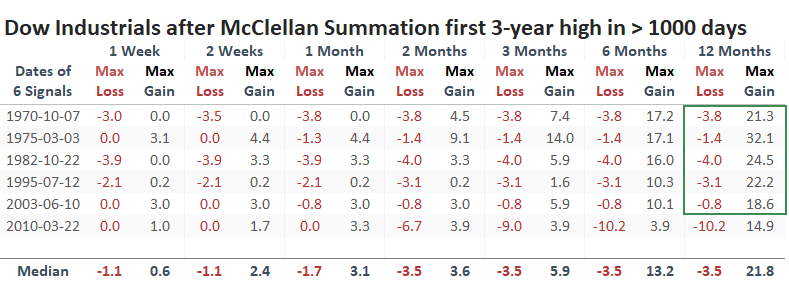
It had been more than 1,000 sessions since the Dow's Summation Index last reached a multi-year high. That's one of the longest streaks in 60 years.
After the Summation Index carved out a new multi-year high, the Dow tended to give back some gains over the next month. Only one of the signals didn't pull back at some point over the medium-term. But all of them showed double-digit gains over the next year.
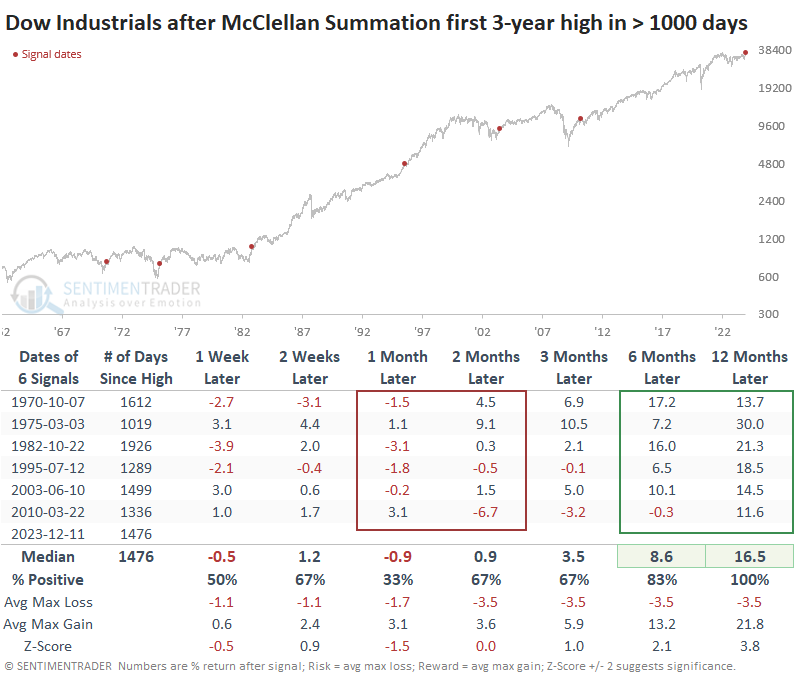
The table of maximum gains and losses across time frames shows that risk was modest up to a year later. Only one signal, in 2010, pulled back more than -10% at any point. The others all had drawdowns smaller than -4%, which is quite remarkable.
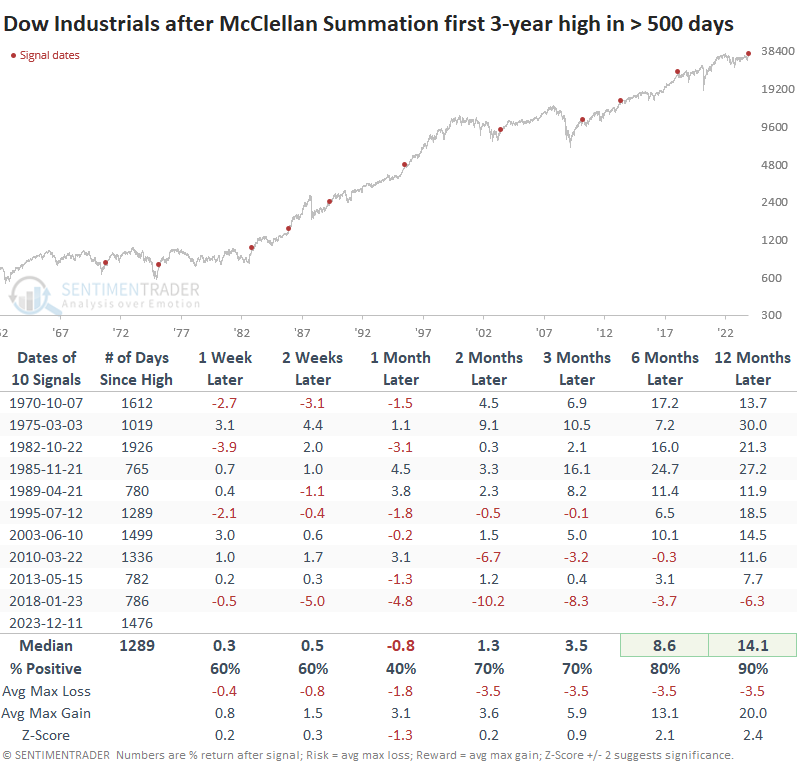
It's tough to rely too heavily on such small sample sizes, but the table below expands the sample a bit by looking at shorter times between new highs in the Summation Index. The conclusions are pretty much the same.
The first index to hit a new high
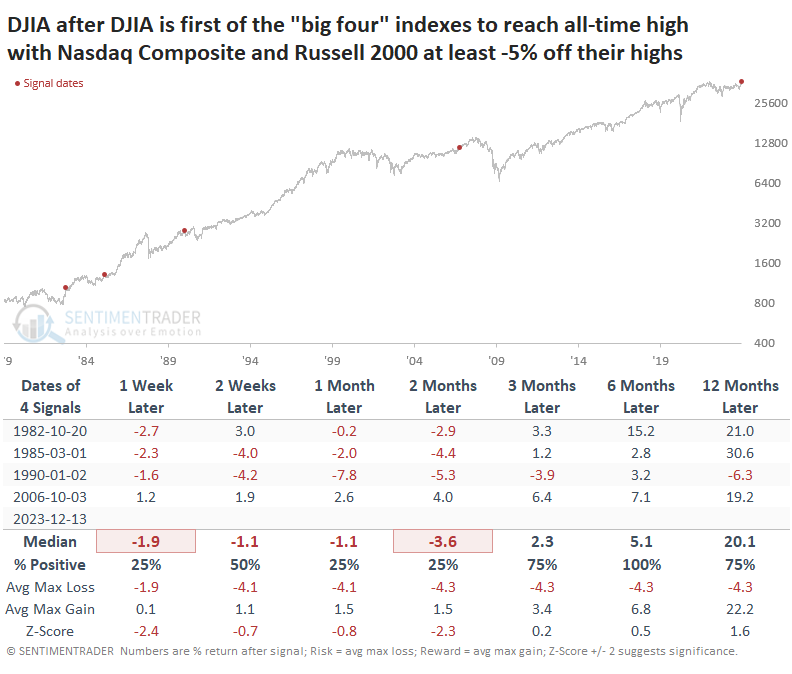
There is some worry that the Dow Industrials is the only index out of the "big four" (DJIA, S&P 500, Nasdaq Composite, and Russell 2000) to reach a new all-time high.
The table below shows other instances when this has been the case. Short- to medium-term returns were nothing special, but the Dow rose all but once over the next 6-12 months.
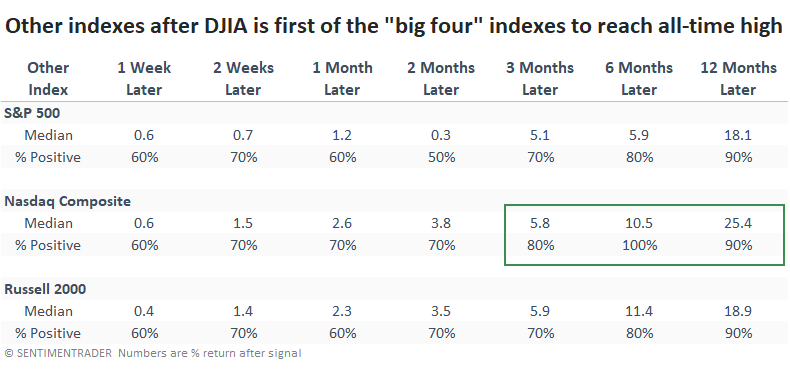
It was even less of a worry for the Nasdaq. Over the next six months, it sported a gain every time, averaging more than +10%.
There is even more anxiety that the Nasdaq and Russell are lagging quite significantly, with both indexes at least 5% off their own all-time highs. There were only four precedents, and the Dow did show a moderate struggle to hold onto gains, with three losses up to two months later. The precursor to the 1990 recession was the only one showing a moderate long-term loss.
What the research tells us...
A record high in the world's most venerable stock market index is always a cause for celebration in the financial media. For investors, however, it has not been a consistently actionable signal. Sometimes, it preceded gains, other times, losses; essentially a toss-up.
What's more impressive is the internal momentum in the stock underlying the index. Gains have been broad-based and persistent, driving the Dow's Summation Index to multi-year highs. This has been a more consistent signal, with modest losses shorter-term and nearly universal gains over the next 6-12 months. The fact that the stodgy Dow was the first primary index to reach a new high does not sully that conclusion - if anything, it strengthens it.
Indicators at Extremes
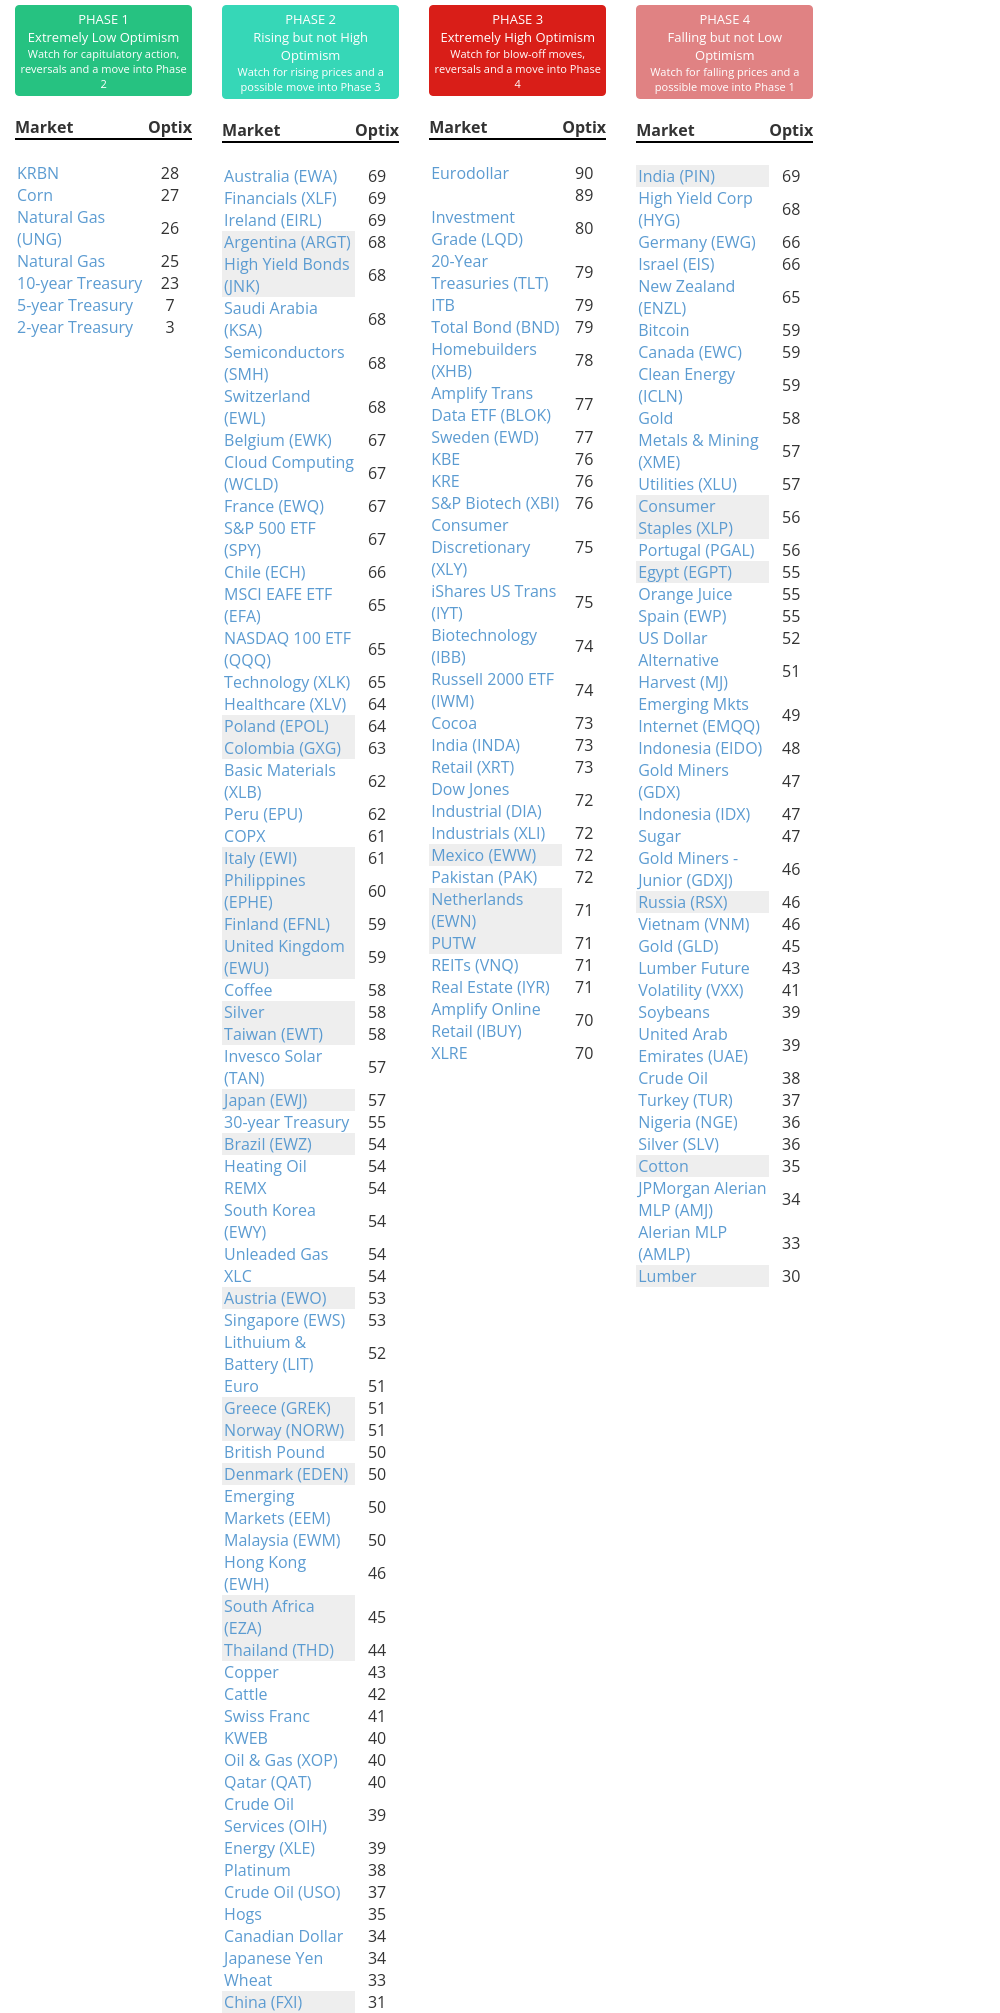
Phase Table
Ranks
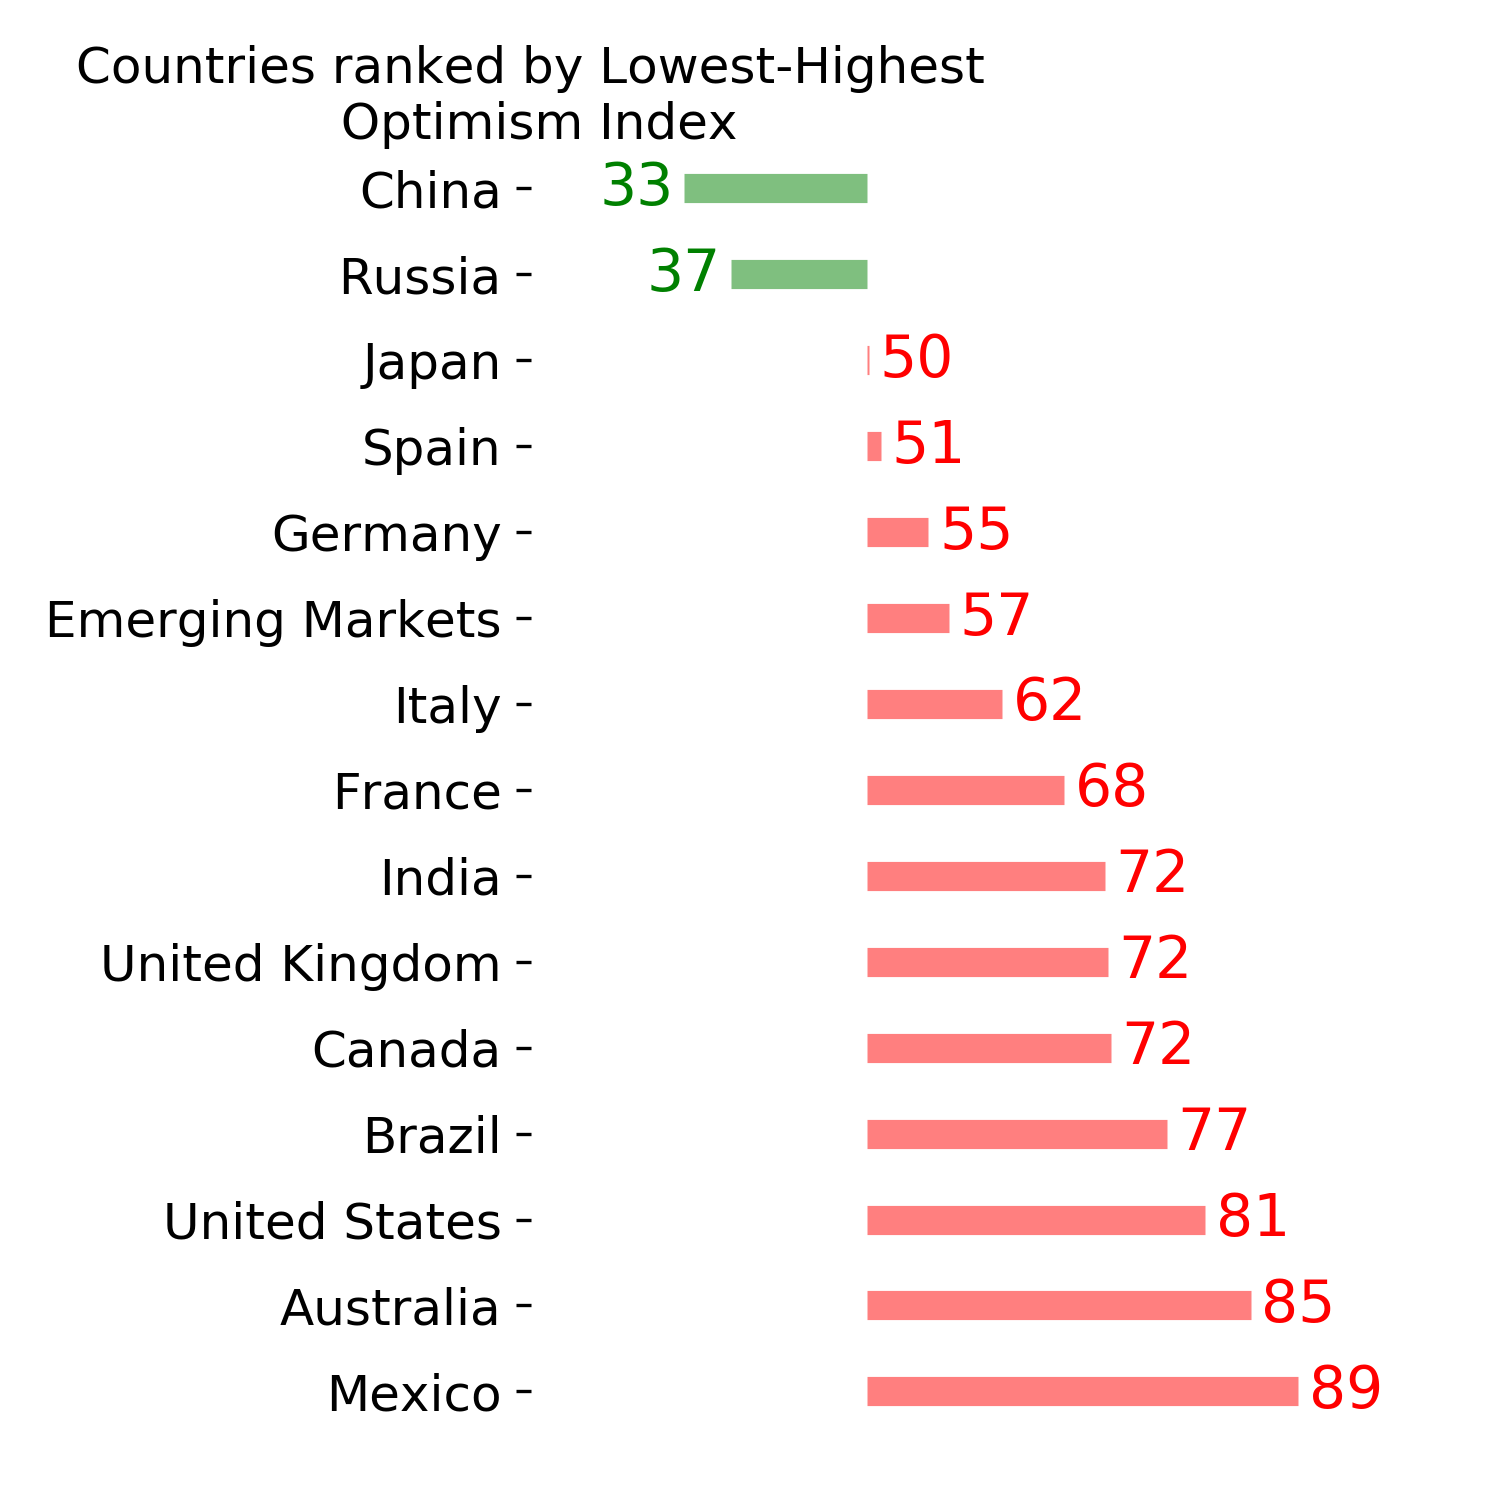
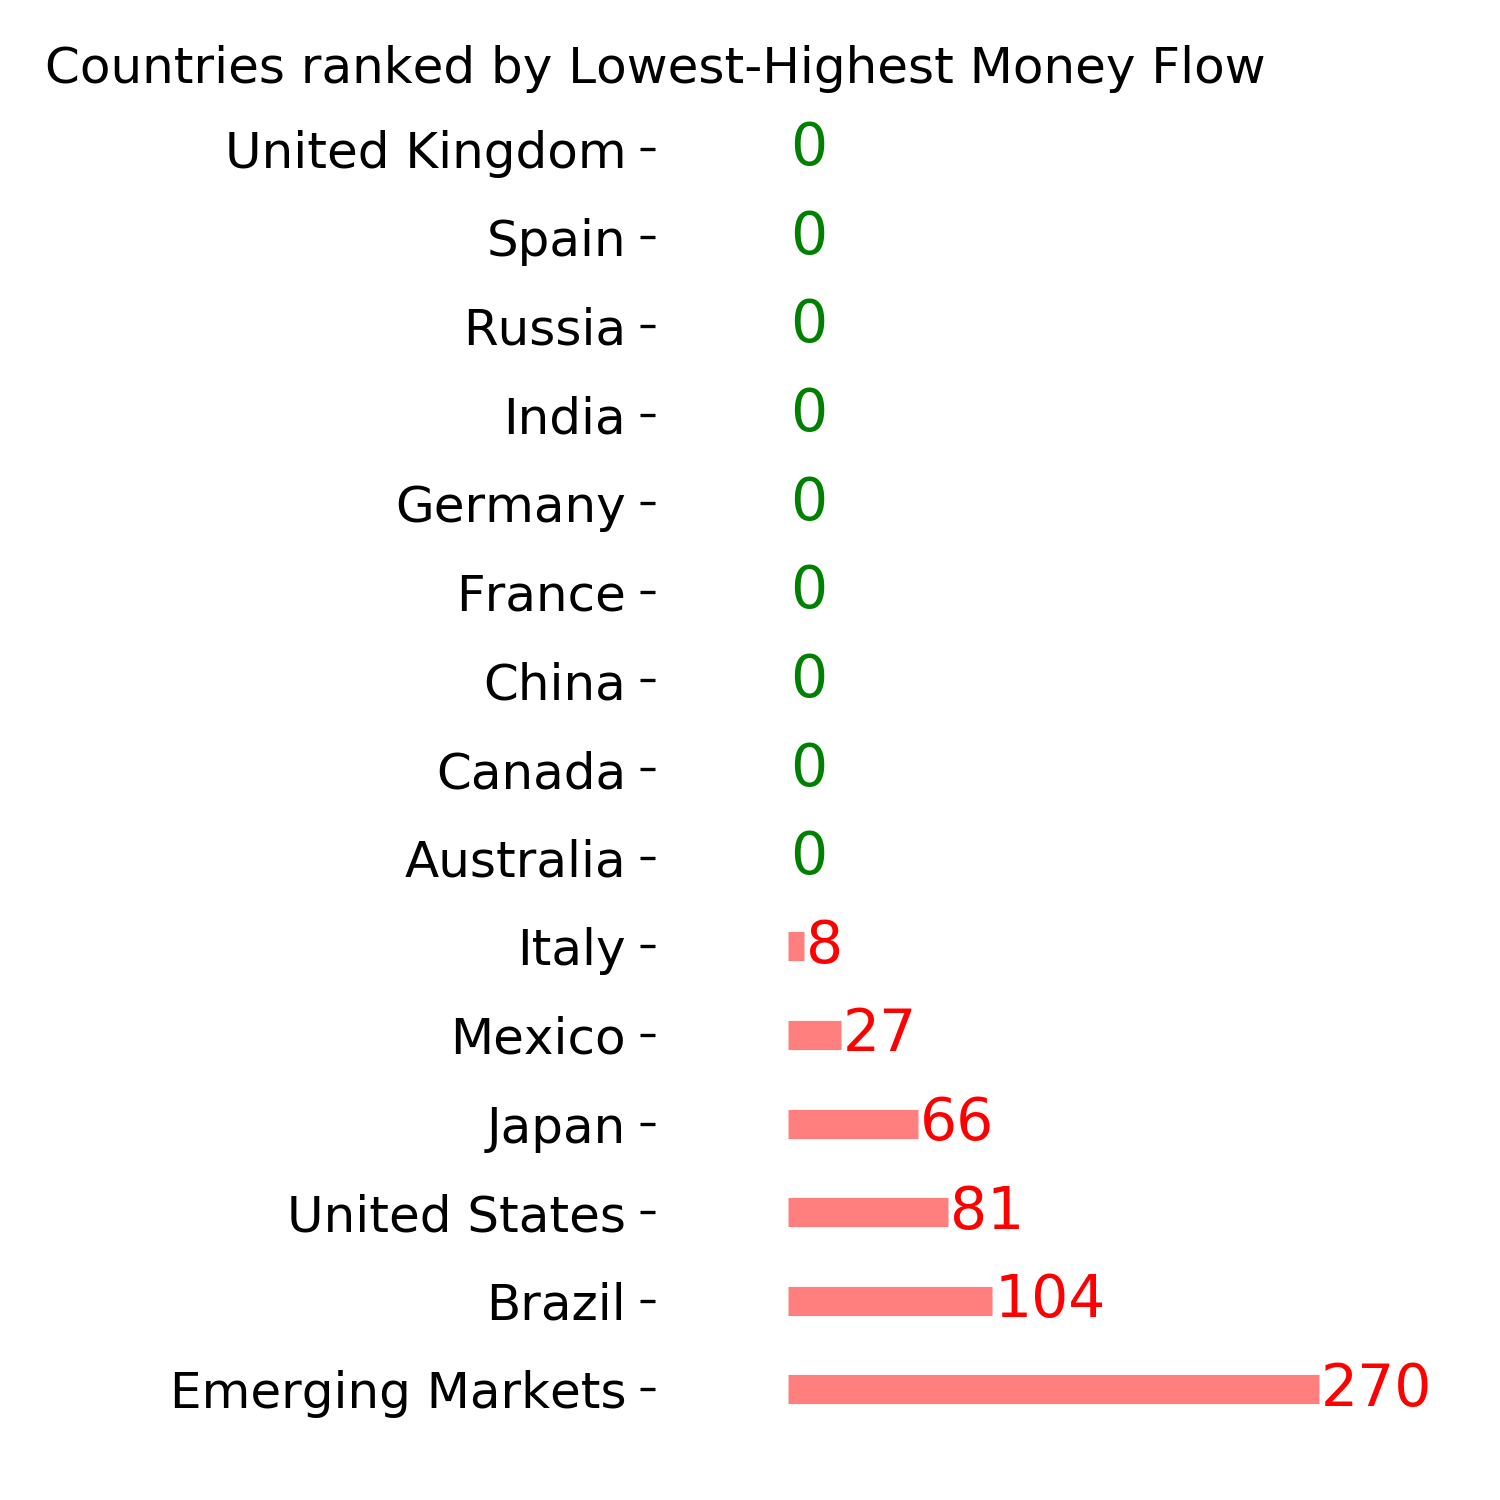
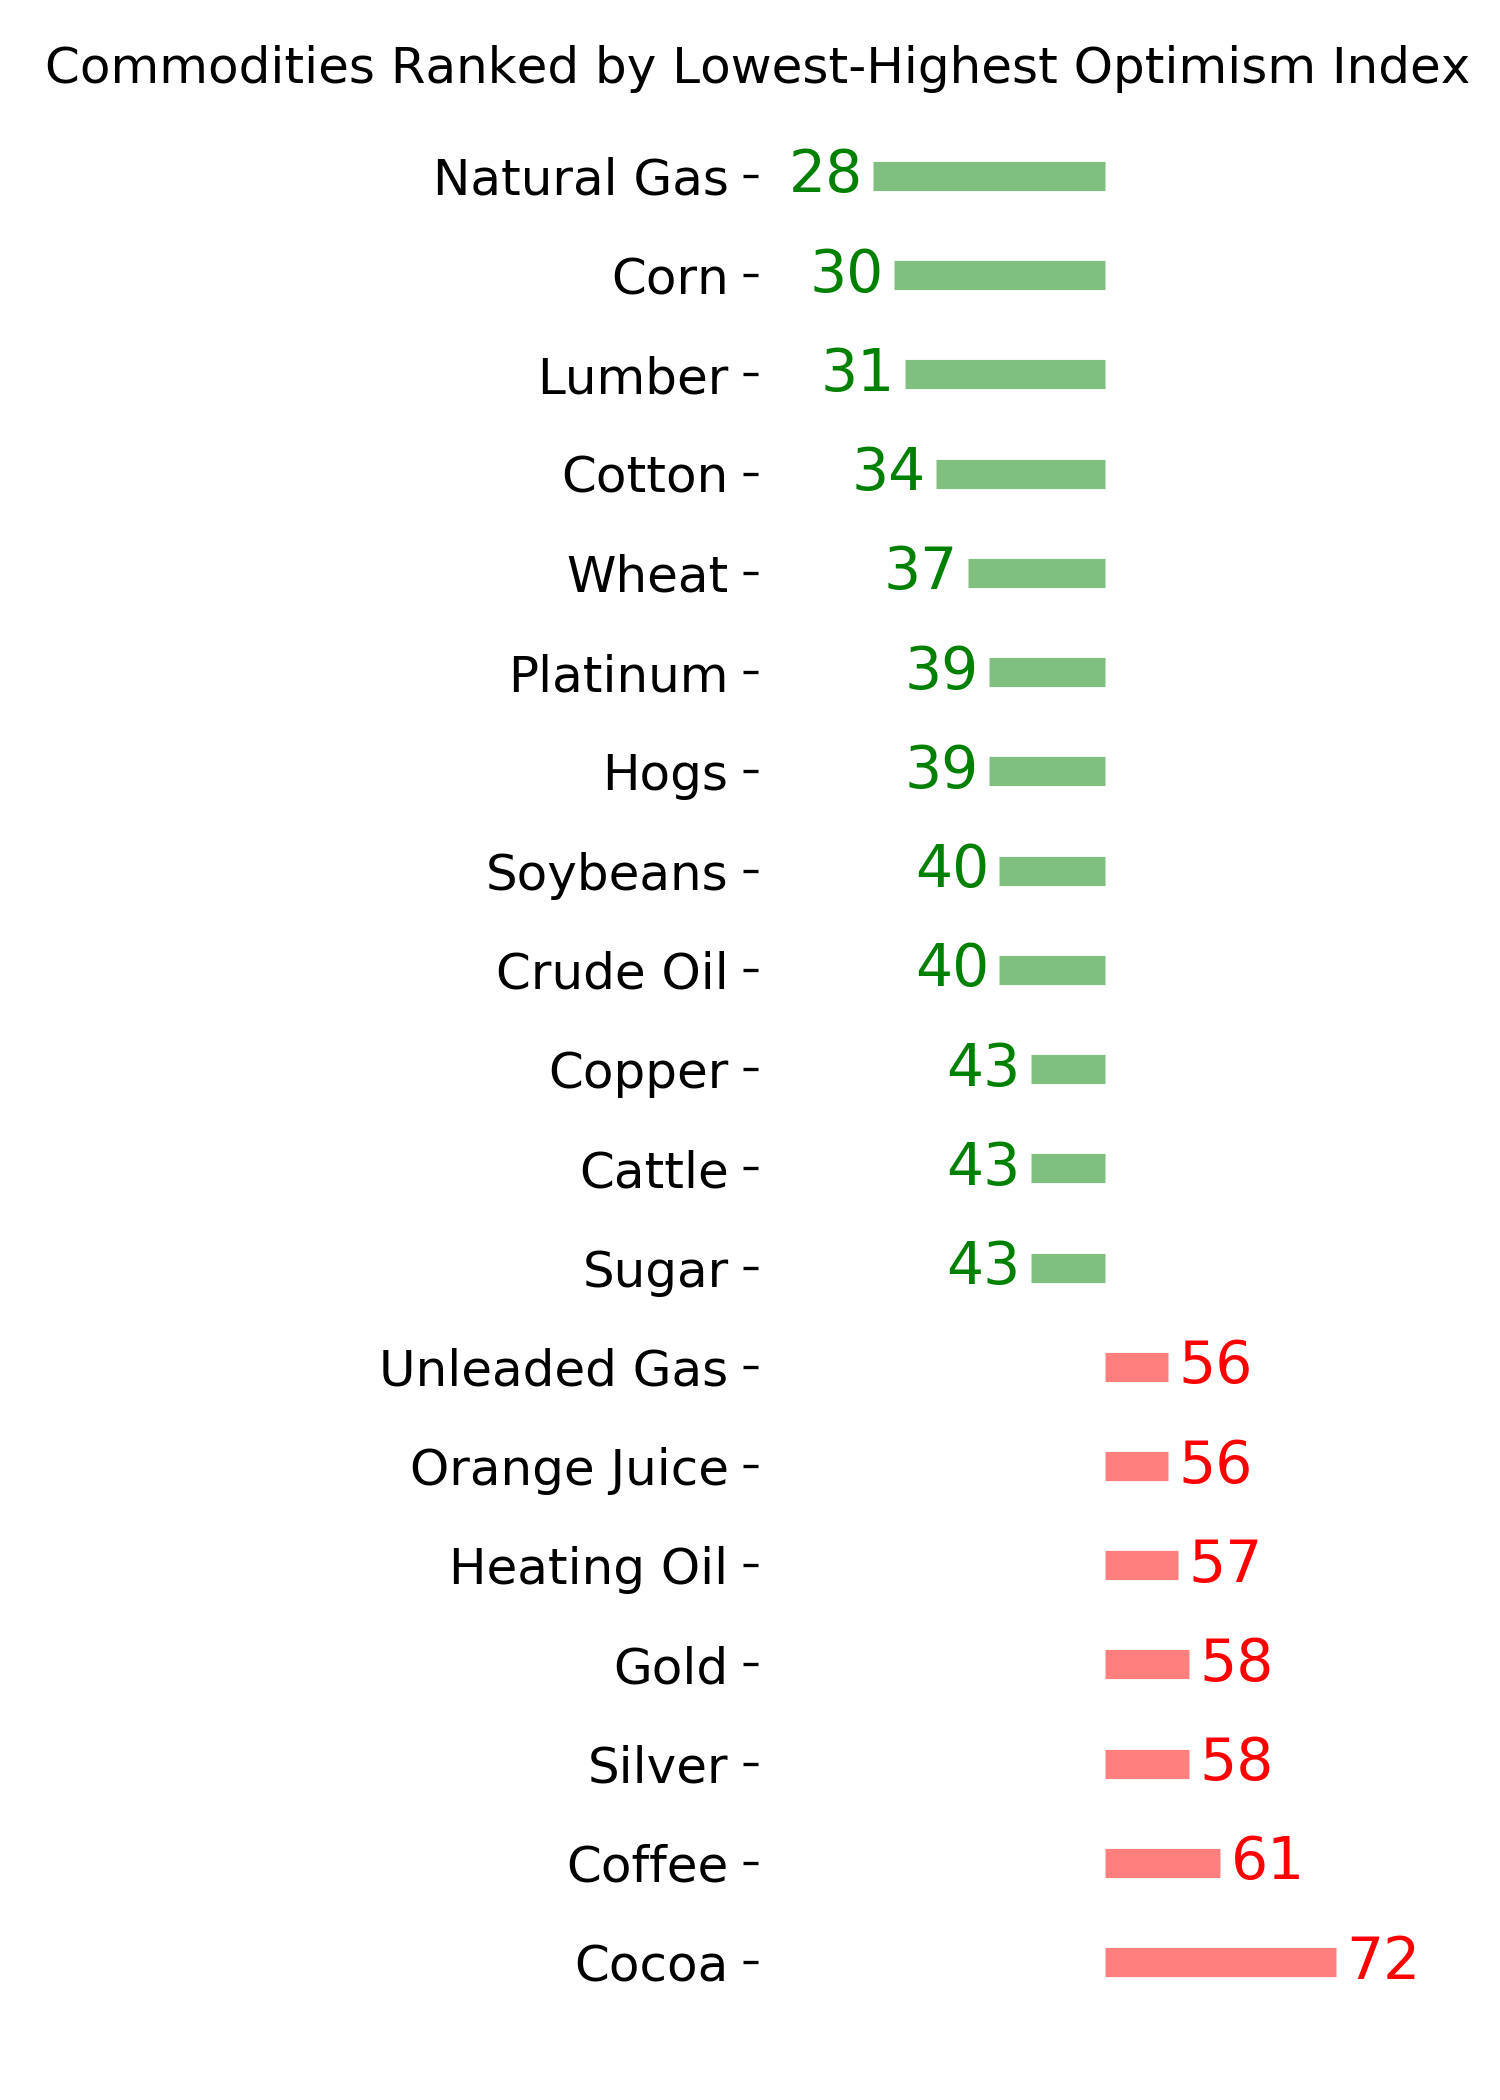
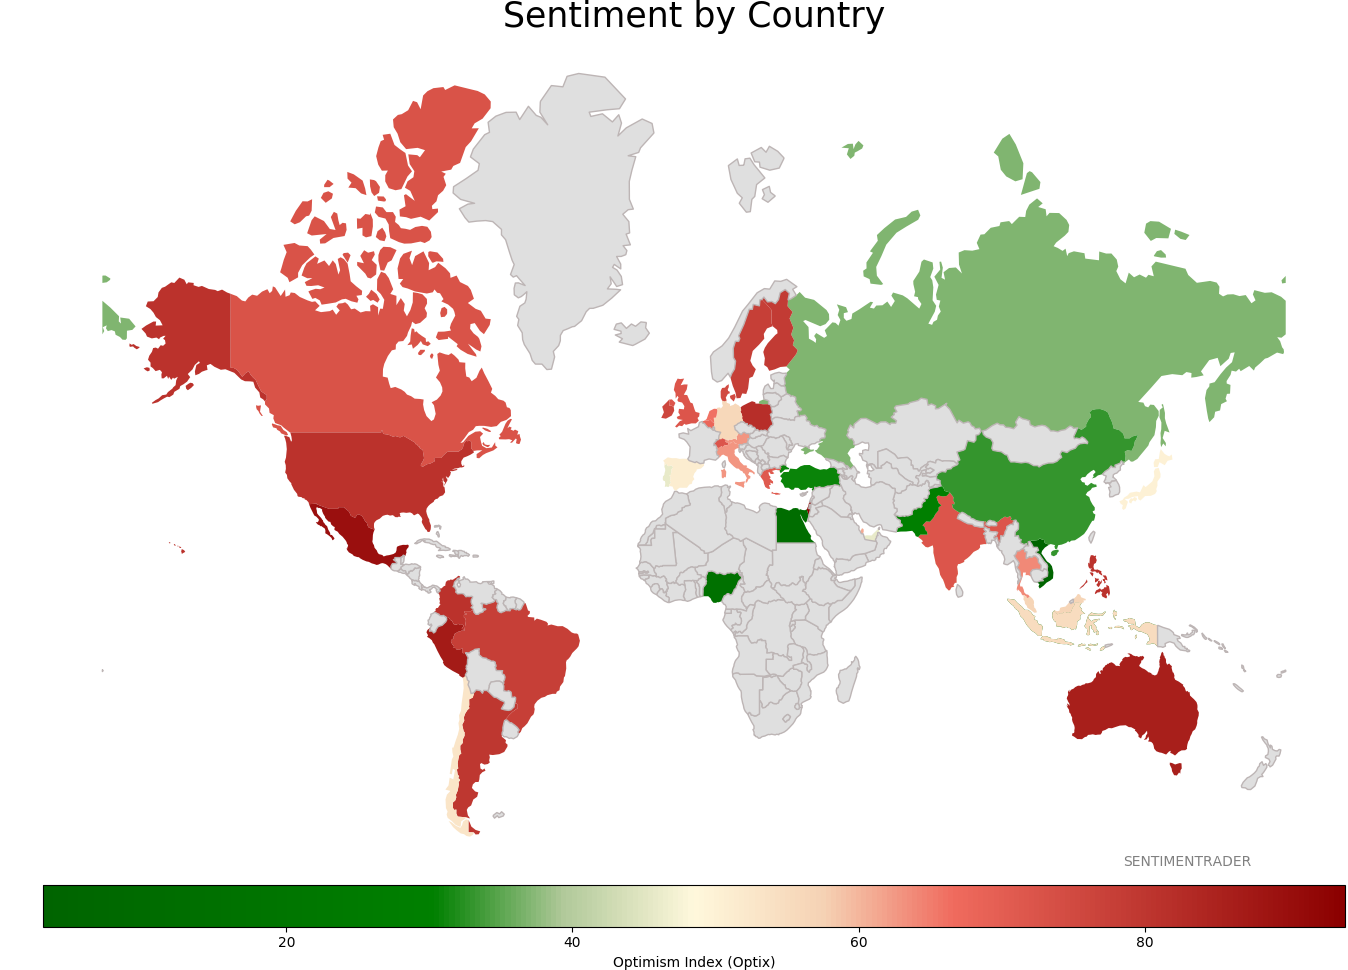
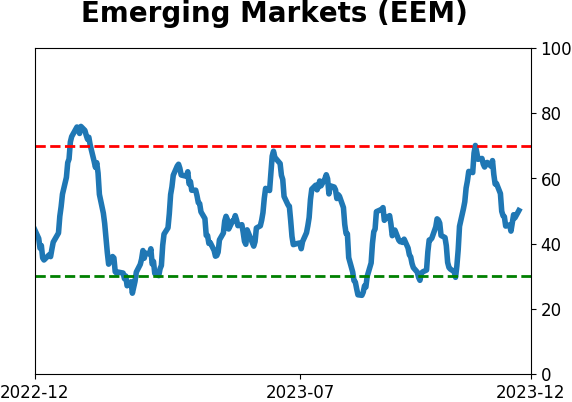
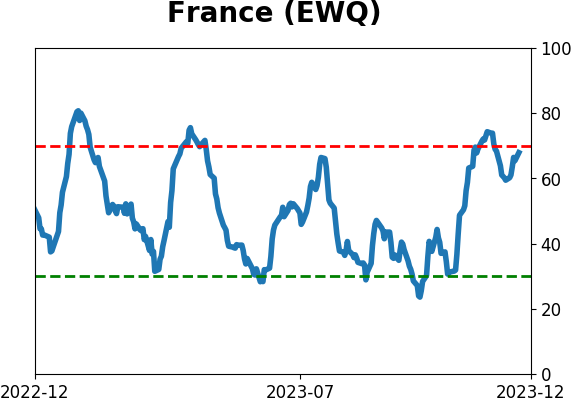
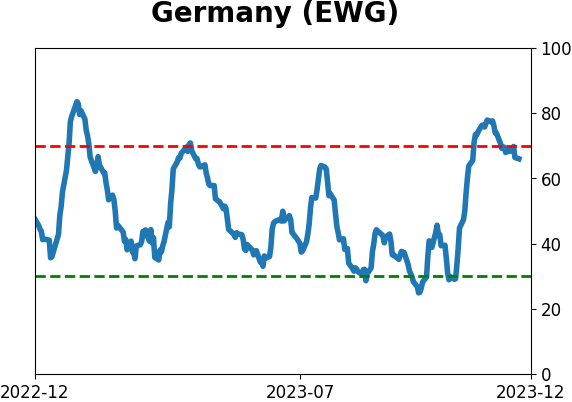
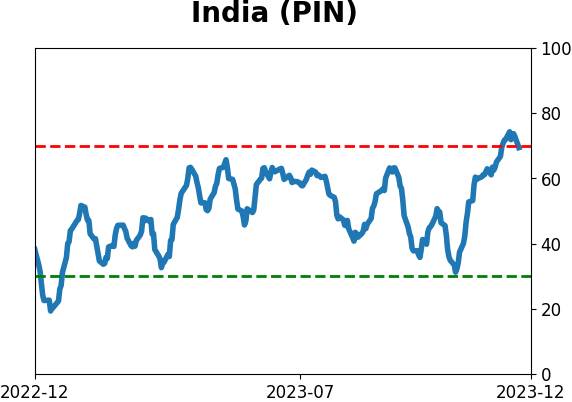
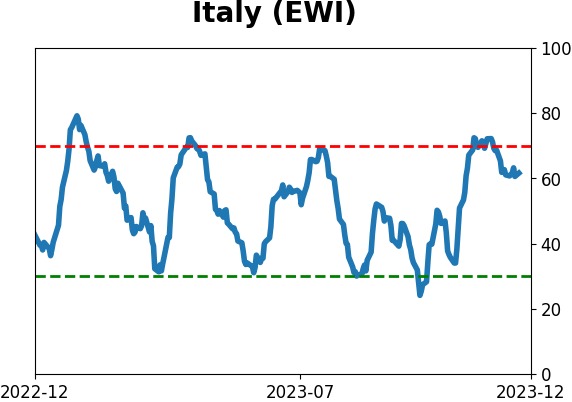
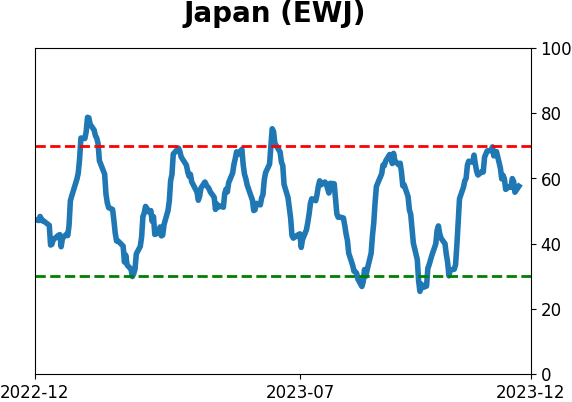
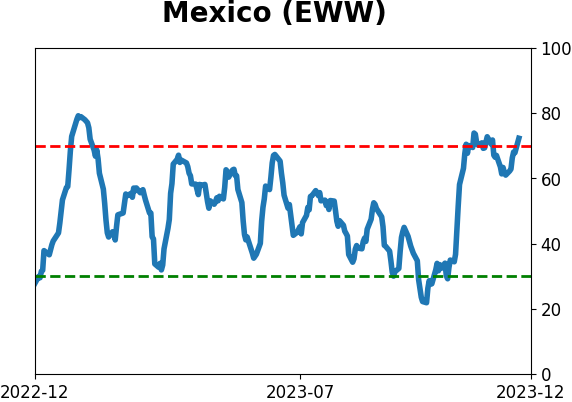
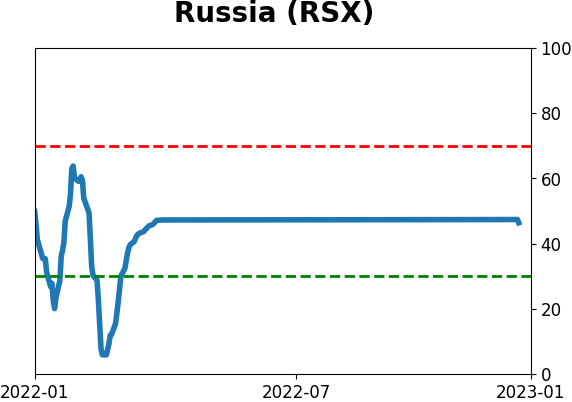
Sentiment Around The World
Optimism Index Thumbnails
|
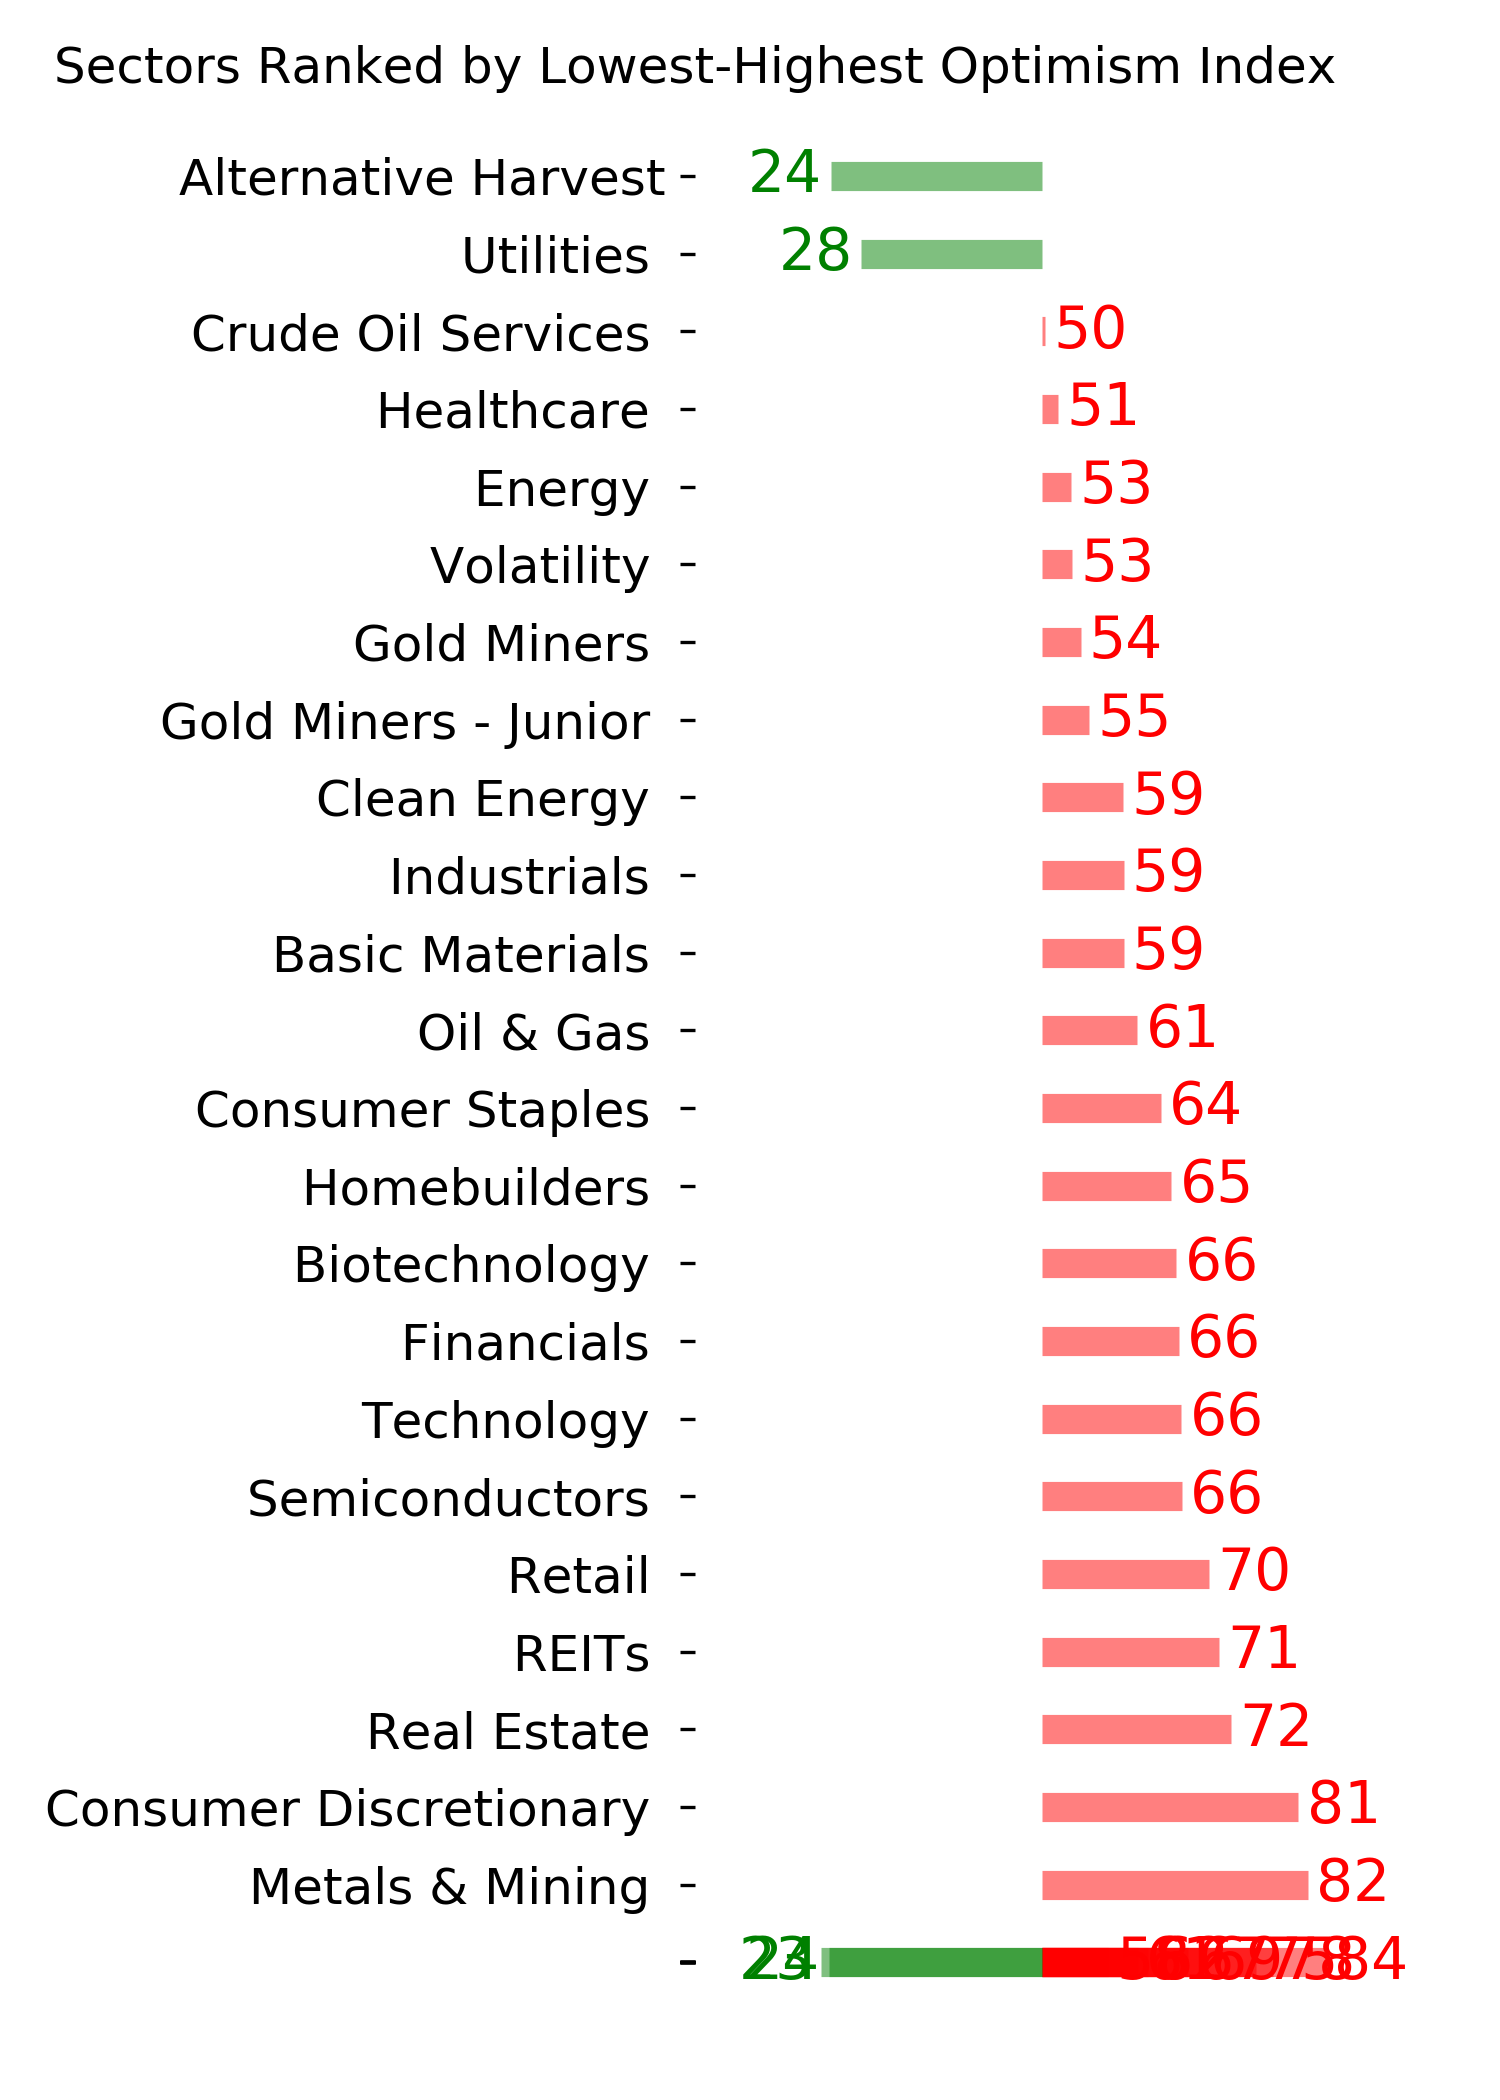
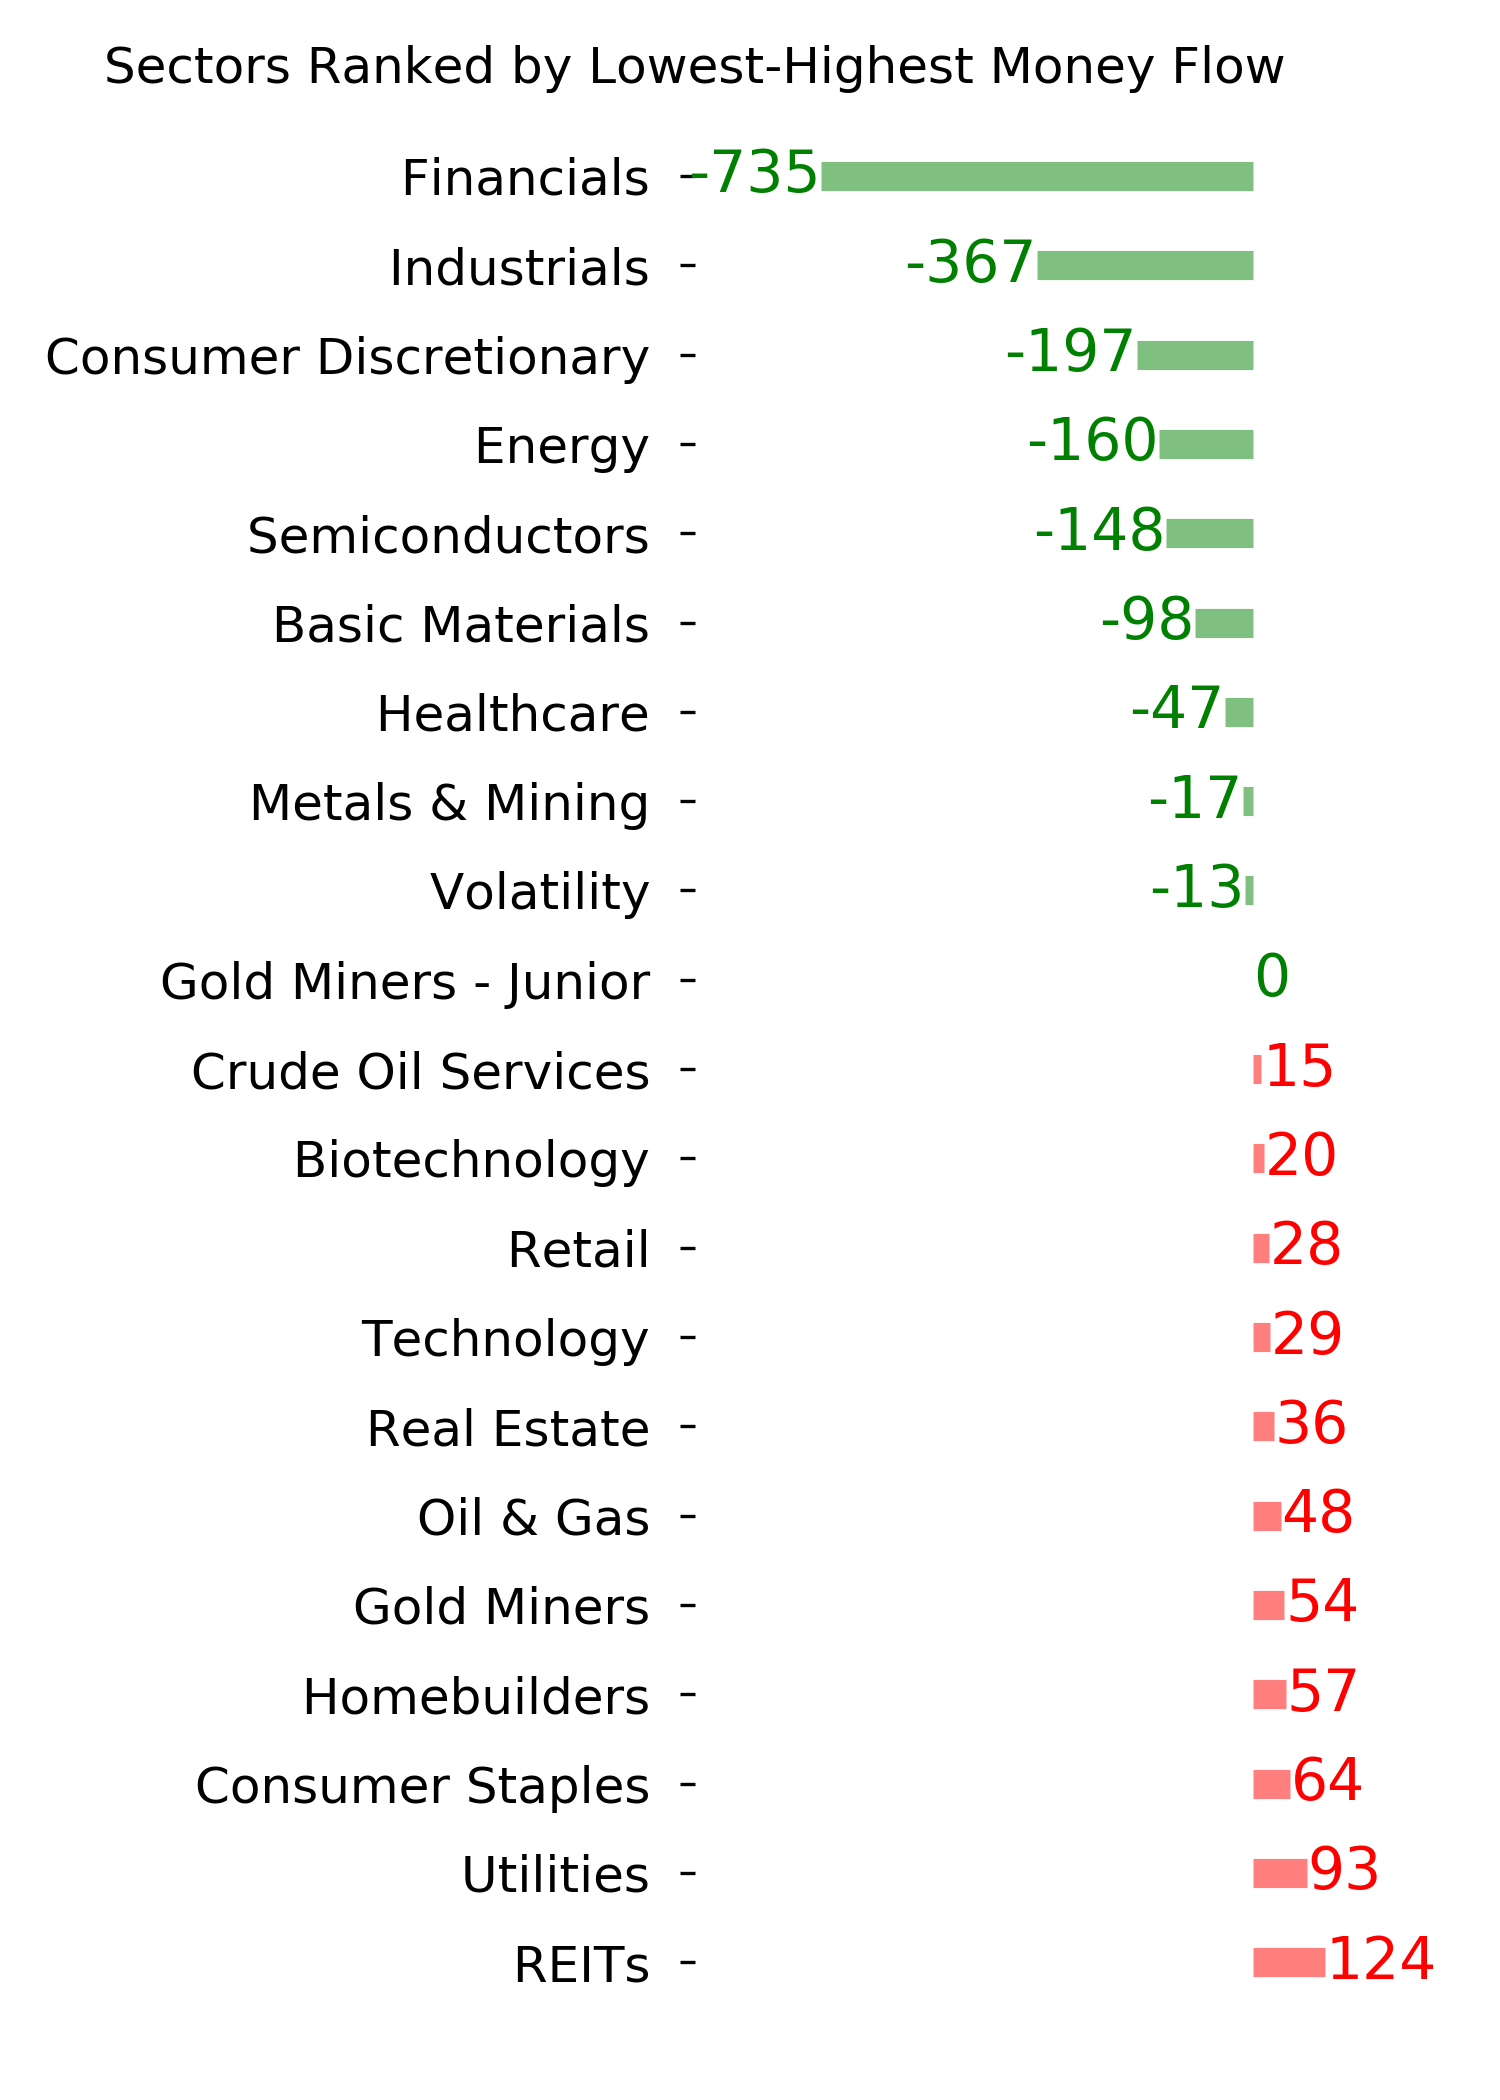
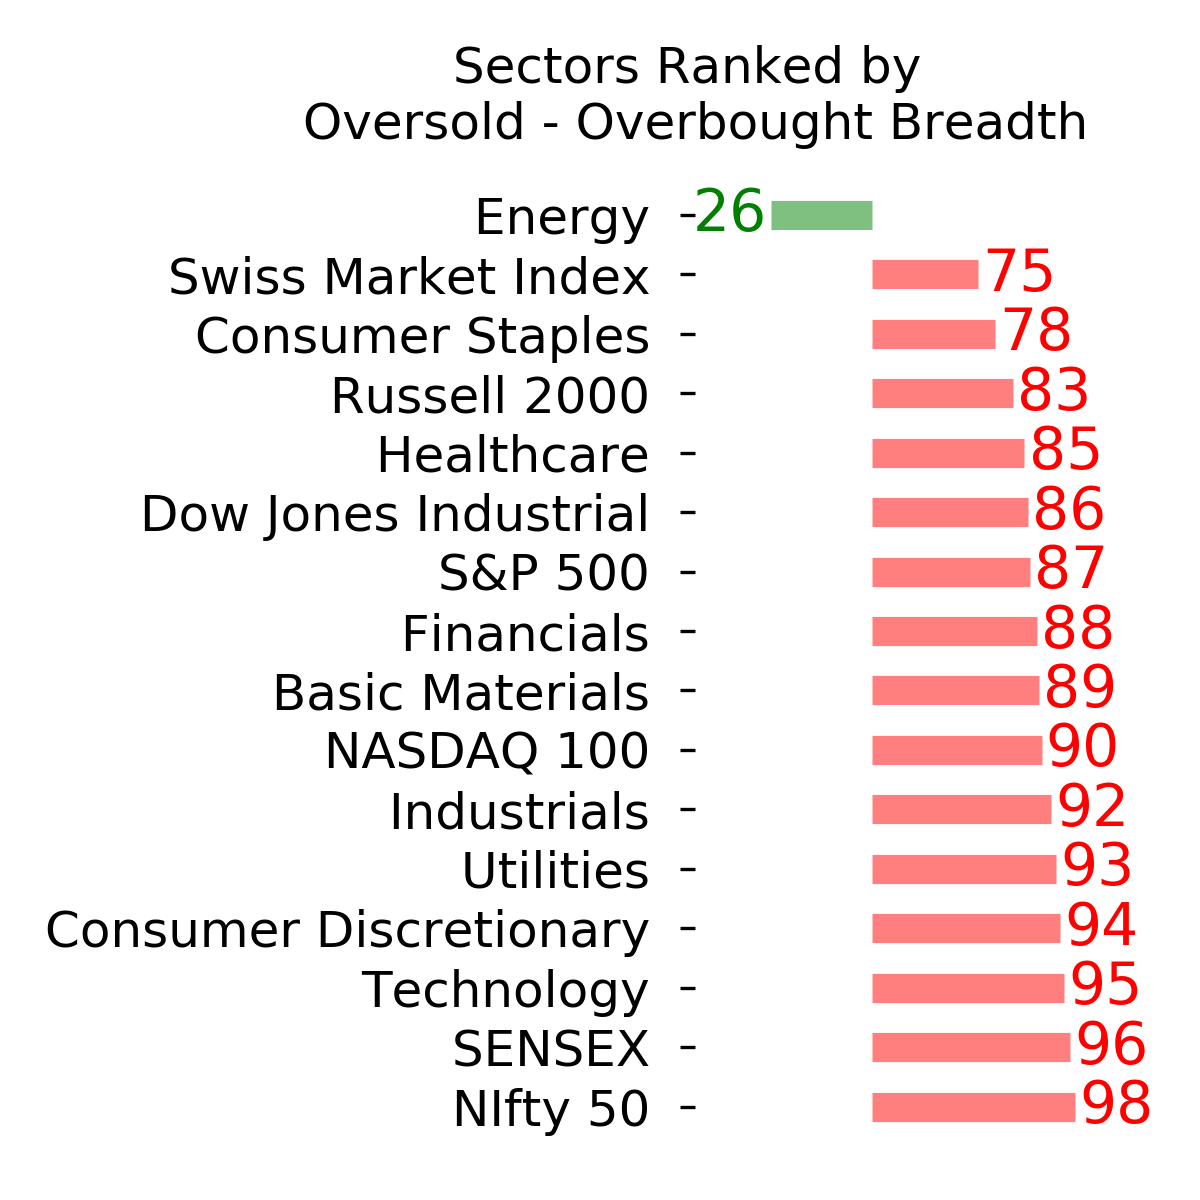
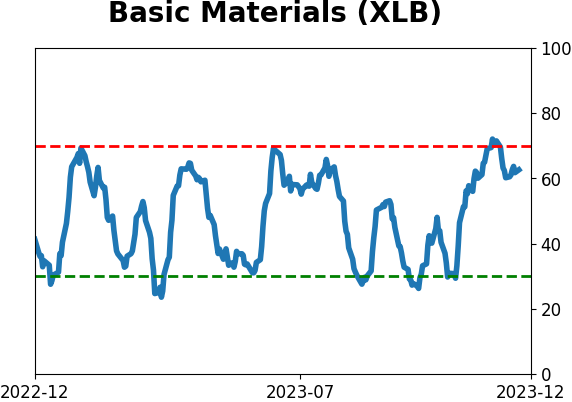
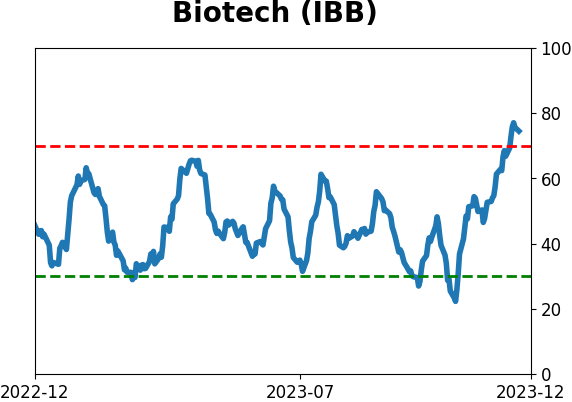
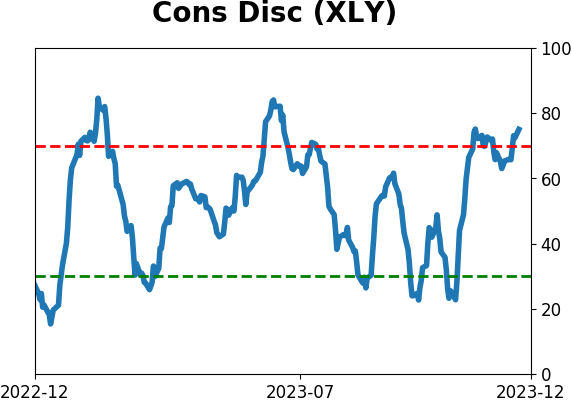
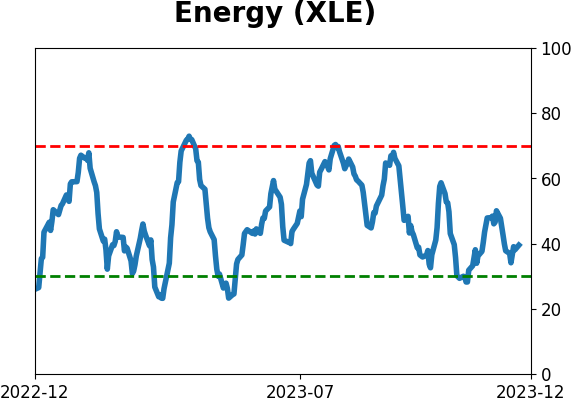
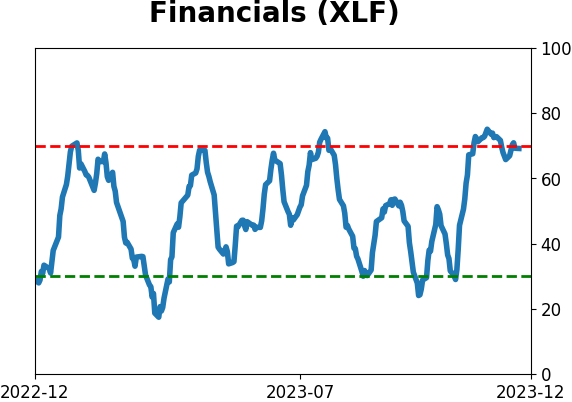
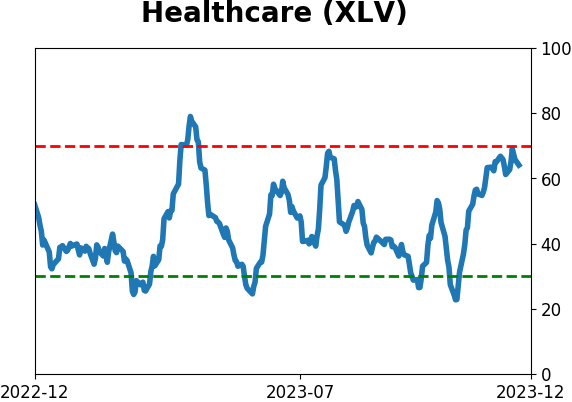
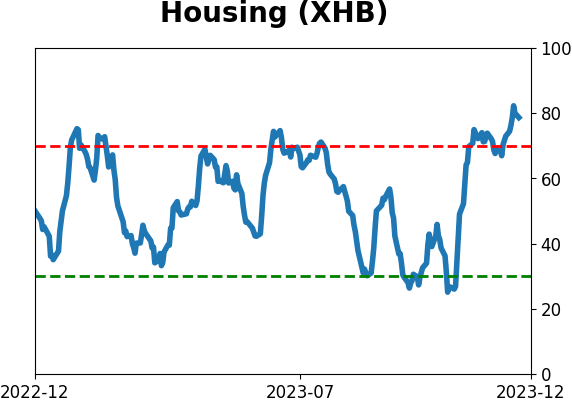
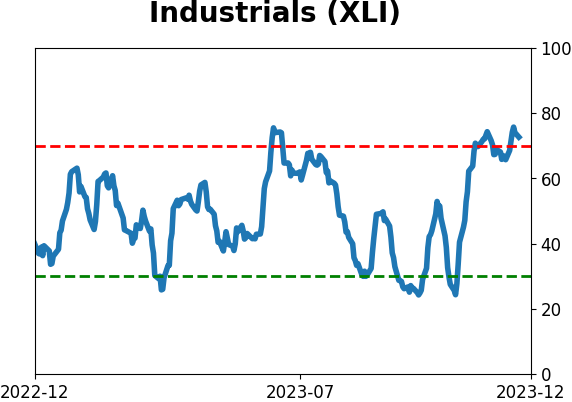
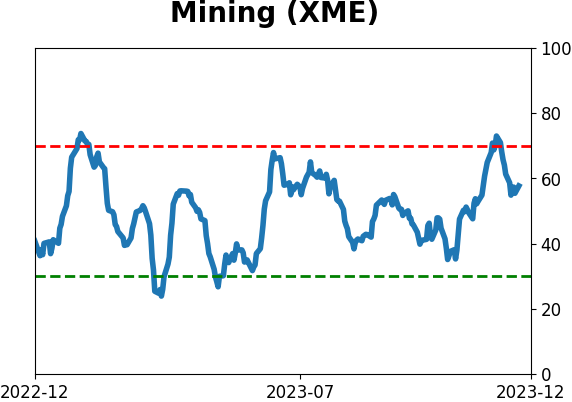
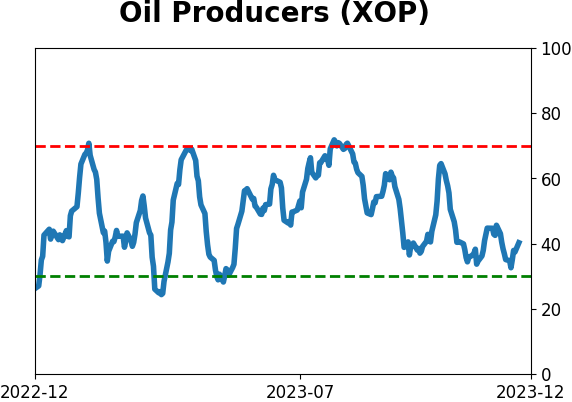
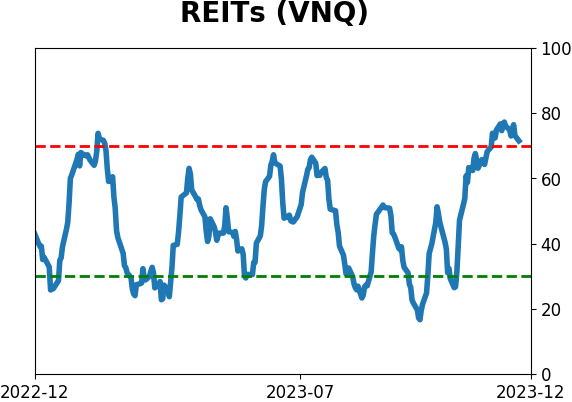
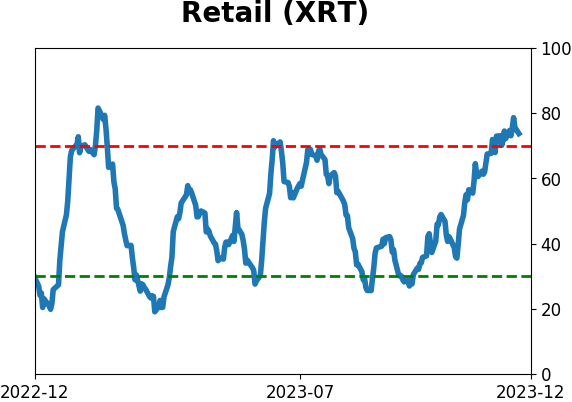
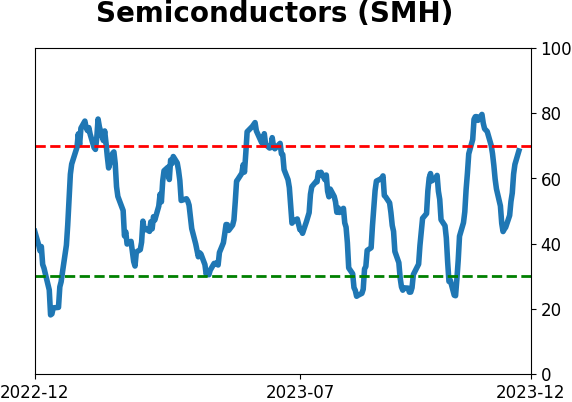
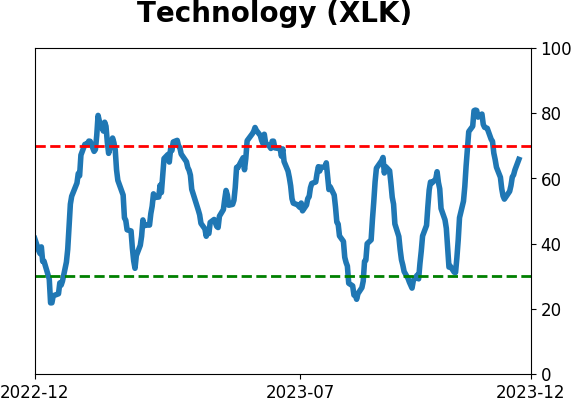
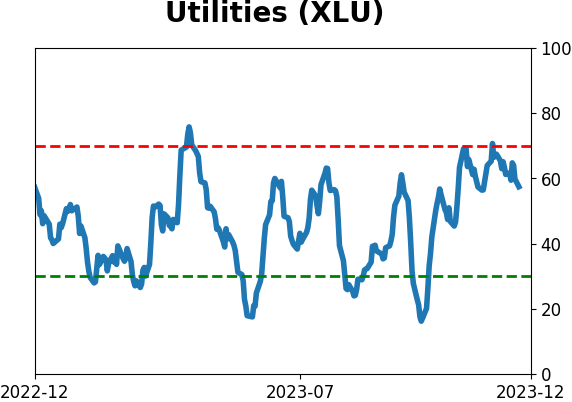
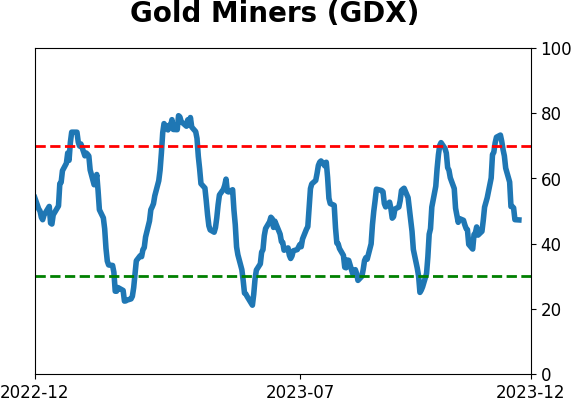
Sector ETF's - 10-Day Moving Average
|
|
|
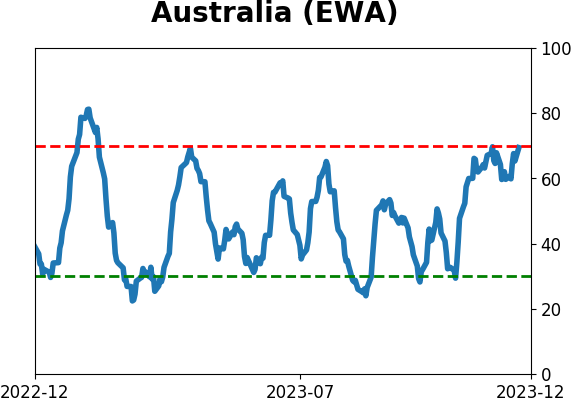
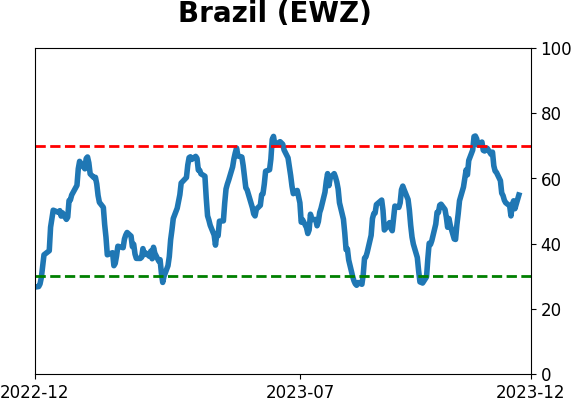
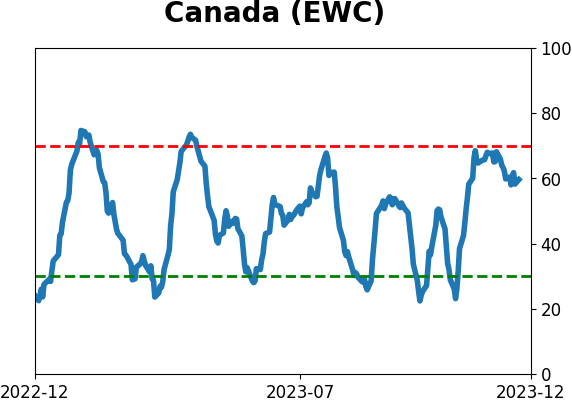
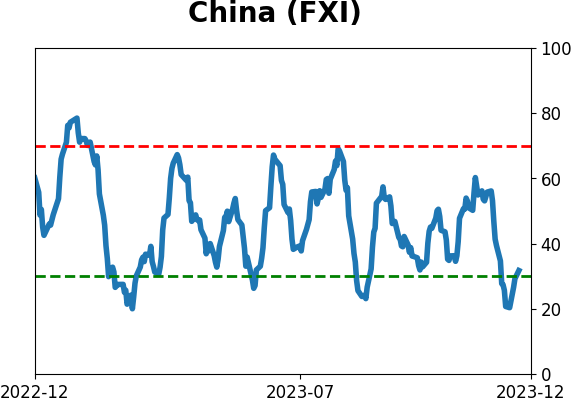
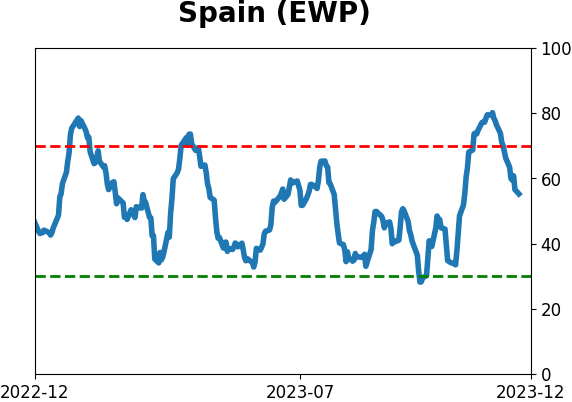
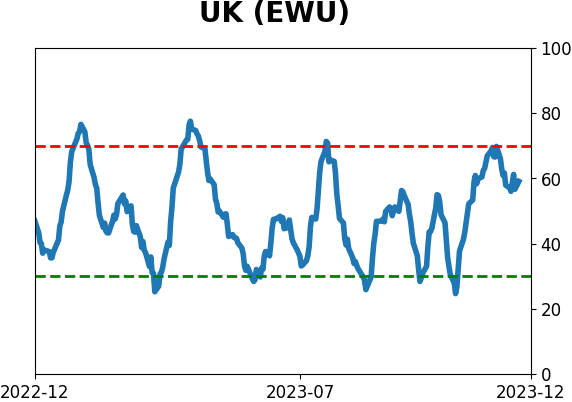
Country ETF's - 10-Day Moving Average
|
|
|
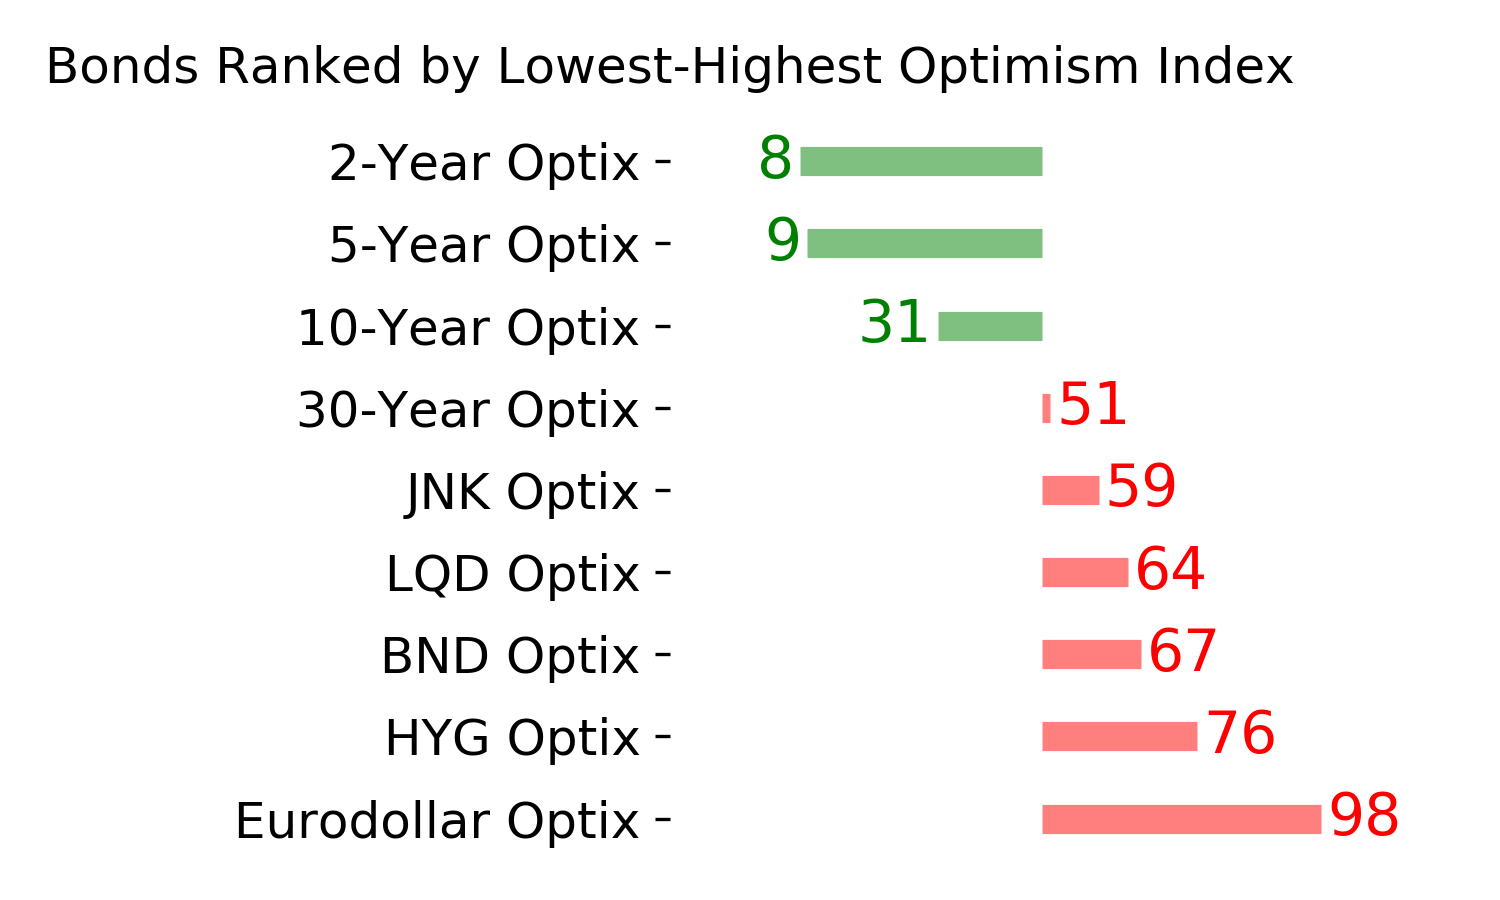
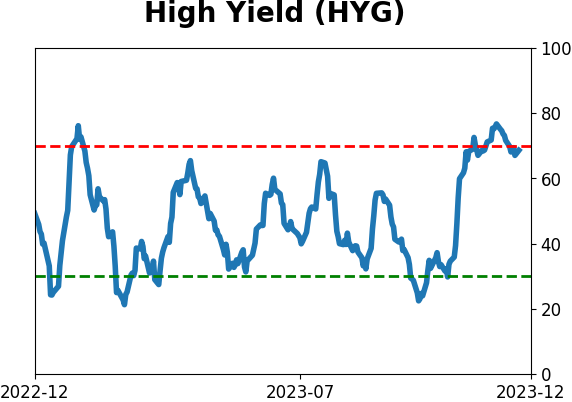
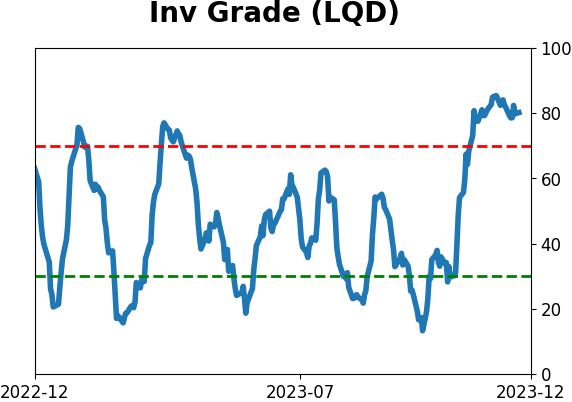
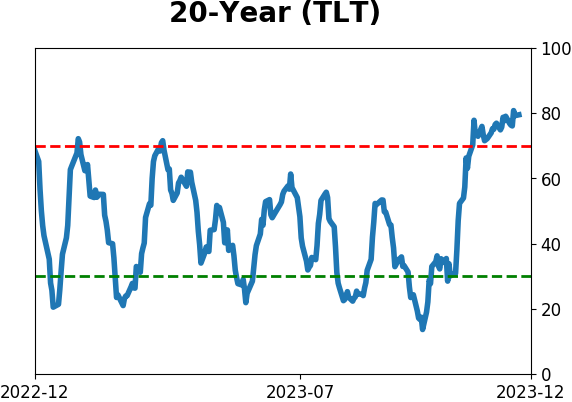
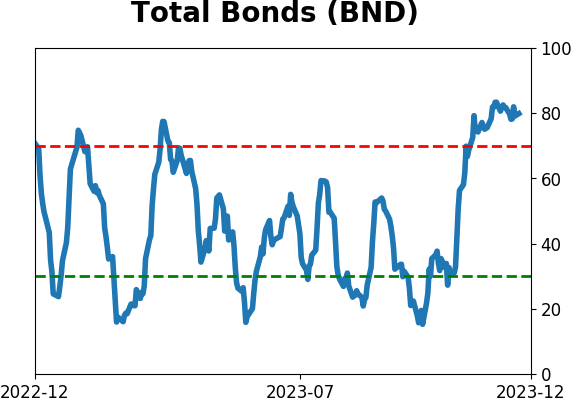
Bond ETF's - 10-Day Moving Average
|
|
|
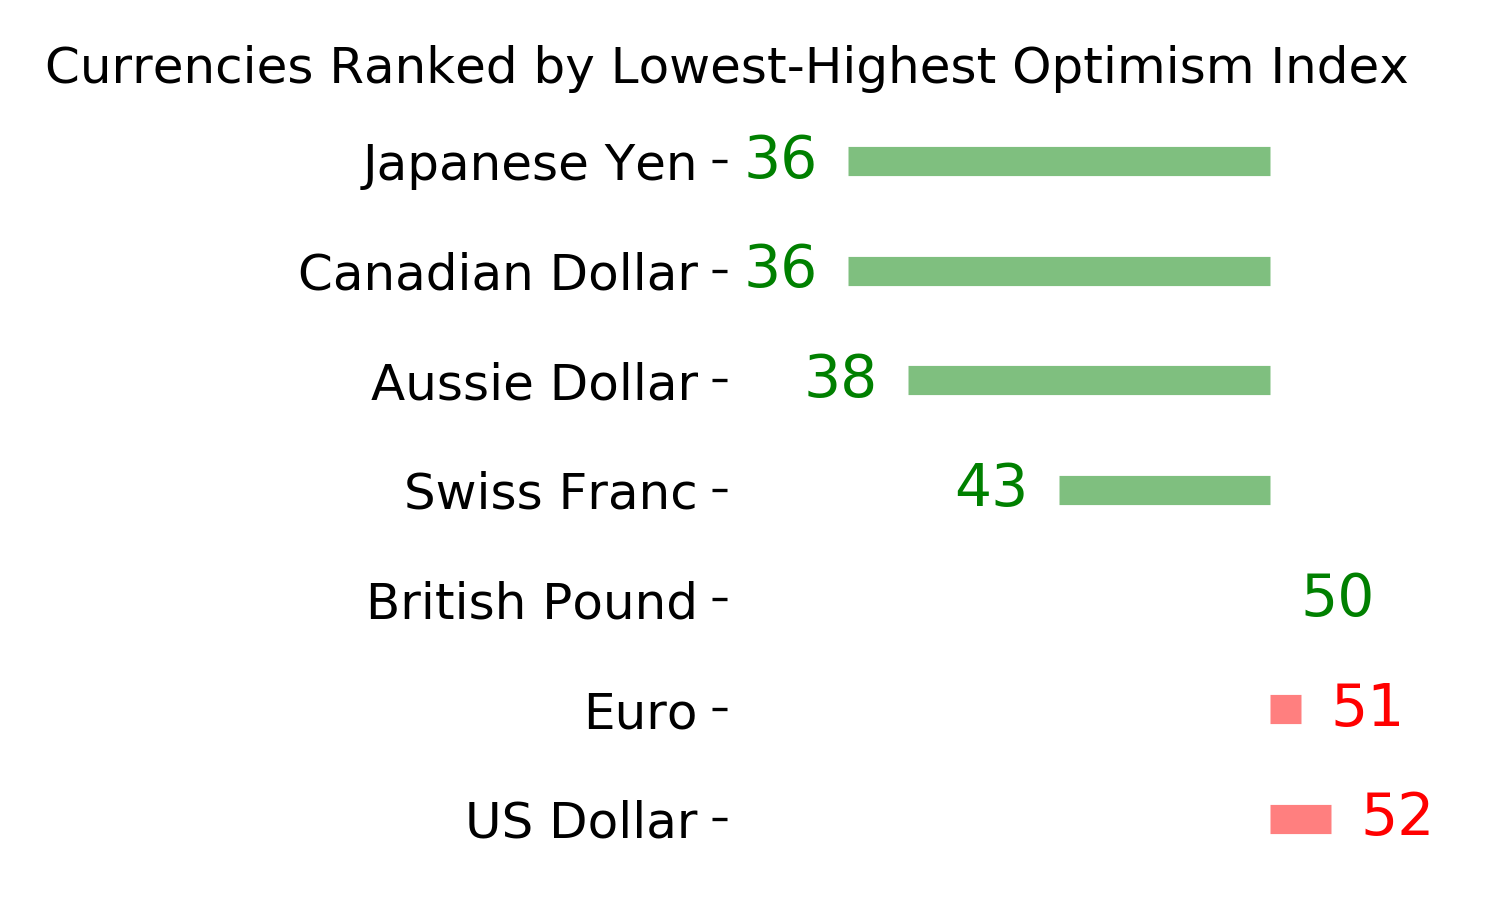
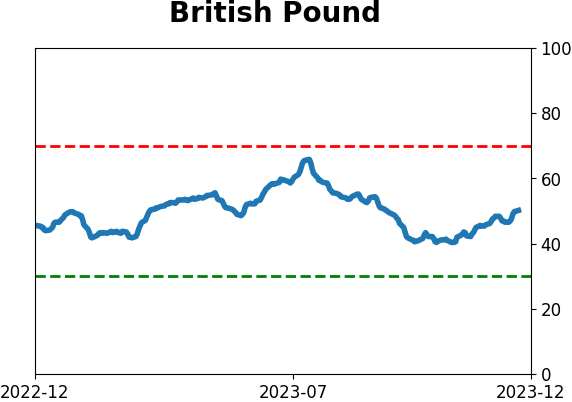
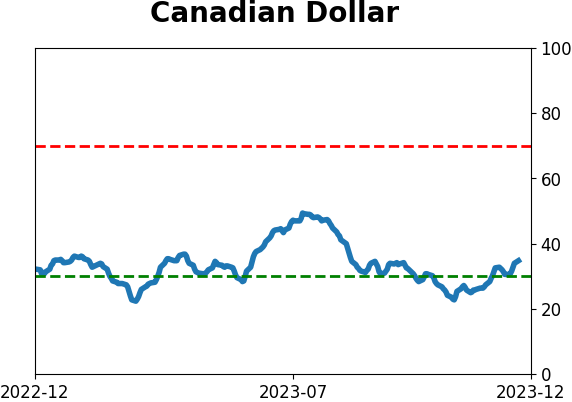
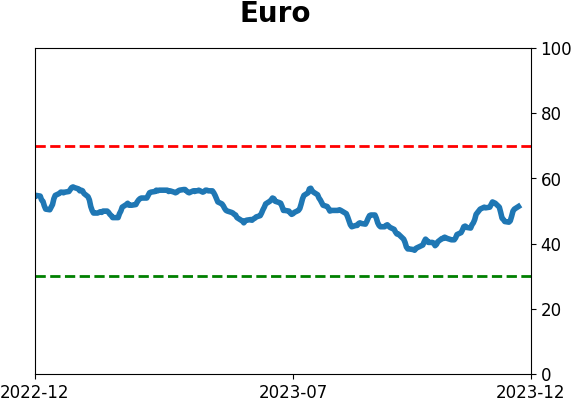
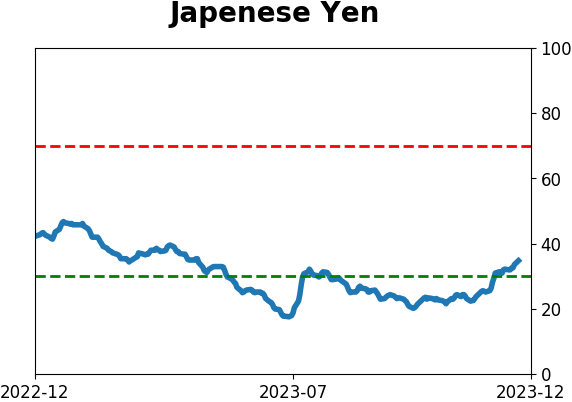
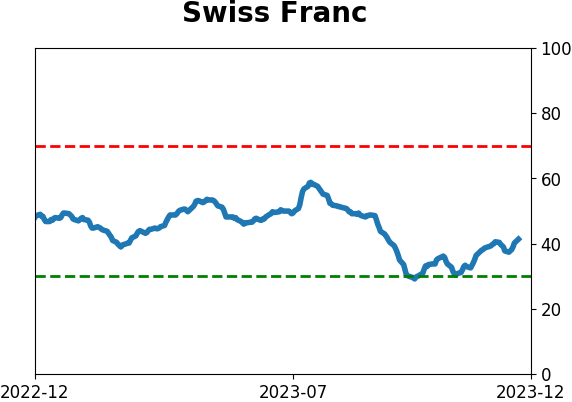
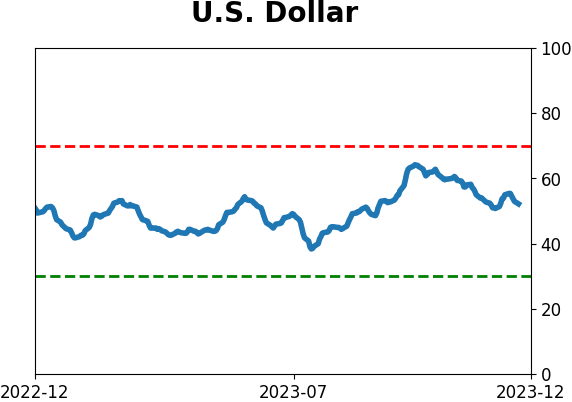
Currency ETF's - 5-Day Moving Average
|
|
|
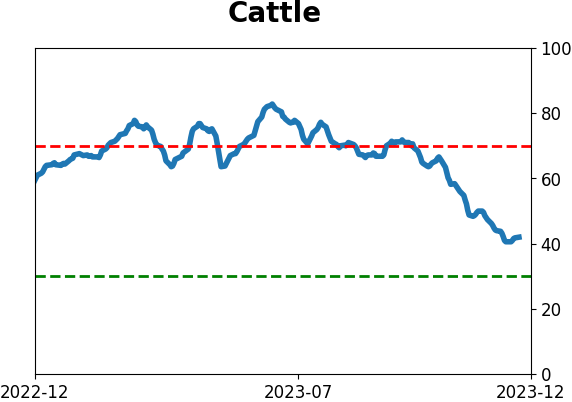
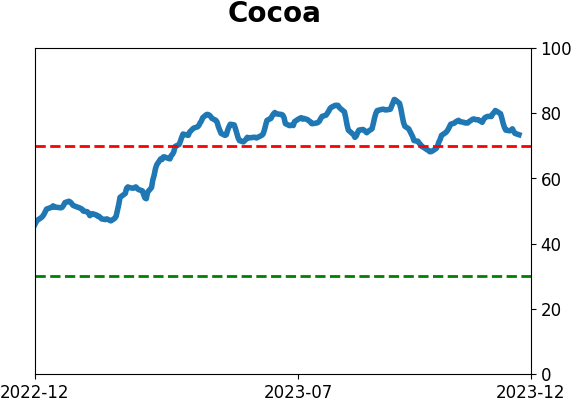
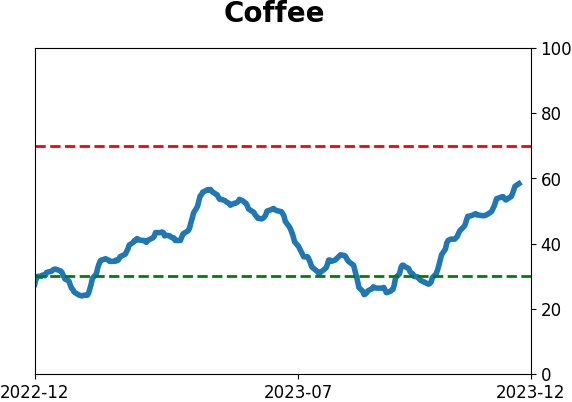
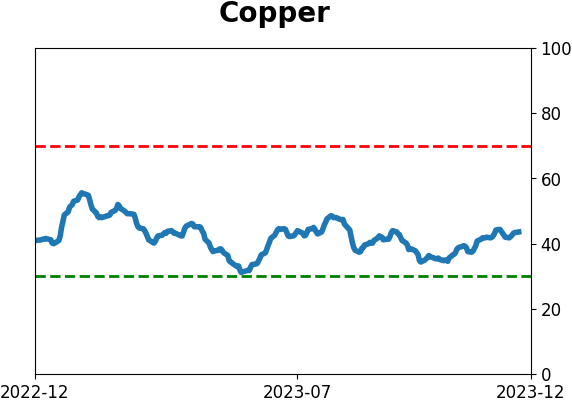
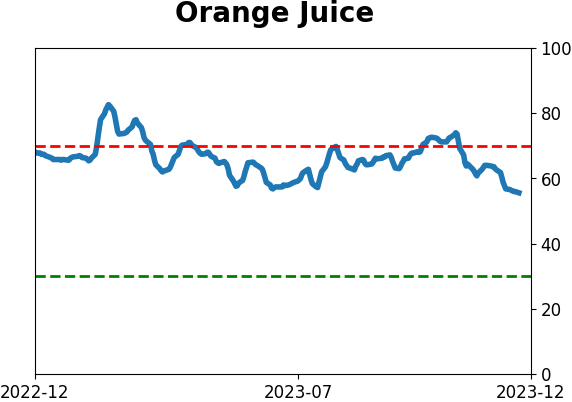
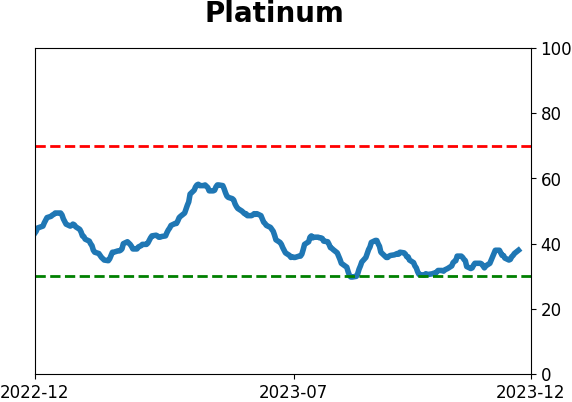
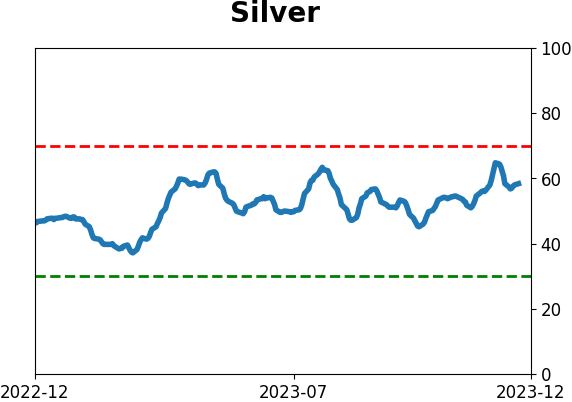
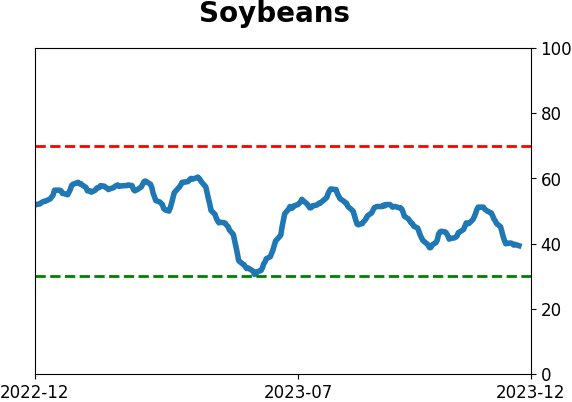
Commodity ETF's - 5-Day Moving Average
|
|