Daily Report : TradingEdge Weekly for Dec 16 - Big bets against stocks, oversold energy, tailwinds for bonds and gold

| View/Print a PDF version of this Report |
Headlines
|
TradingEdge Weekly for Dec 16 - Big bets against stocks, oversold energy, tailwinds for bonds and gold: This week, we saw that large options traders have once again placed near record bets against stocks. That helped push put/call ratios on the S&P 500 and several sectors to records, while smart money corporate insiders pull back on selling. Enery stocks became oversold, thanks to a big drop in crude oil sentiment. High-yield bonds, and gold, are entering positive seasonal windows. |
Smart / Dumb Money Confidence
|
|
Risk Levels
|
|

|


Research
TradingEdge Weekly for Dec 16 - Big bets against stocks, oversold energy, tailwinds for bonds and goldBy Jason GoepfertBOTTOM LINEThis week, we saw that large options traders have once again placed near record bets against stocks. That helped push put/call ratios on the S&P 500 and several sectors to records, while smart money corporate insiders pull back on selling. Enery stocks became oversold, thanks to a big drop in crude oil sentiment. High-yield bonds, and gold, are entering positive seasonal windows. FORECAST / TIMEFRAME |
Key points:
- NOTE: TradingEdge will not be published for the next two weeks, and publication of the Daily Report will be similarly interrupted
- Large options traders once again placed massive bets against stocks
- Put/call ratios on the S&P 500 and some sectors hit record highs as corporate insider selling near decade lows
- Energy stocks saw a spike in oversold conditions but many remain in long-term uptrends
- The decline in oil prices has pushed sentiment to the lowest in years
- Treasury yields across the board recently fell to multi-month lows
- High-yield bonds are entering a very positive seasonal window
- So is gold, but it would help if the price trend improves
- That would also help gold mining stocks, which are trying to hold onto a recovery
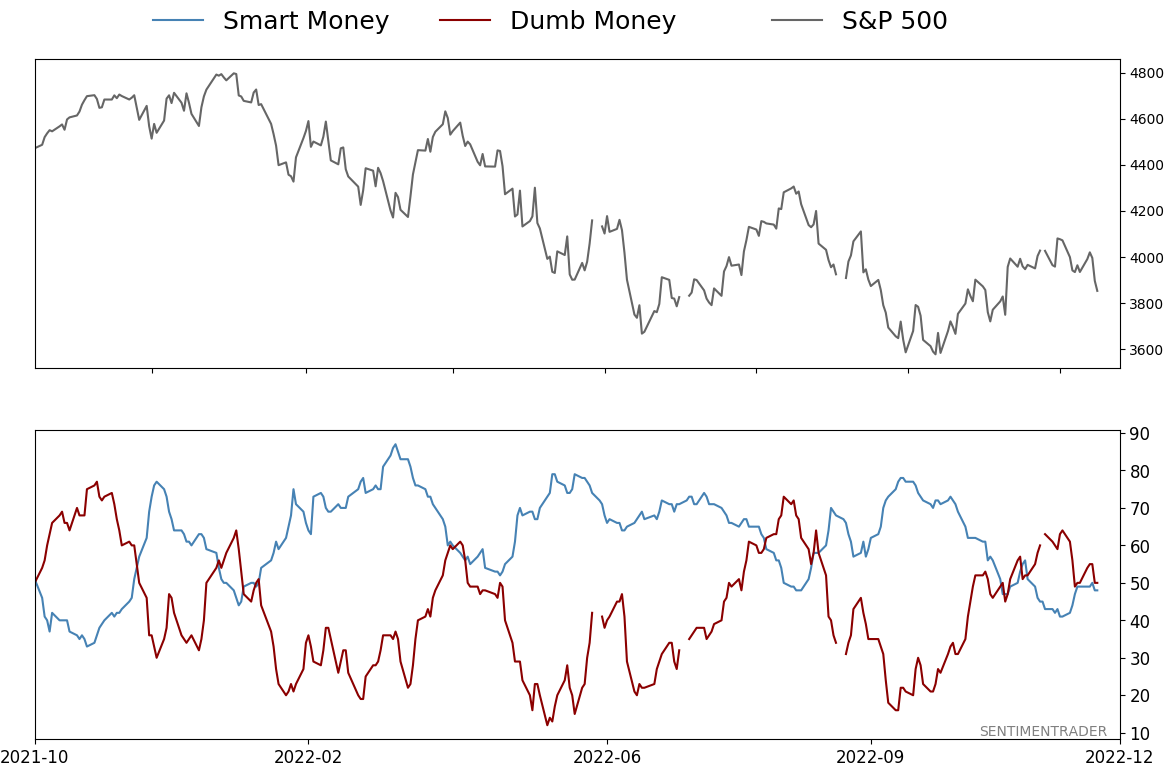
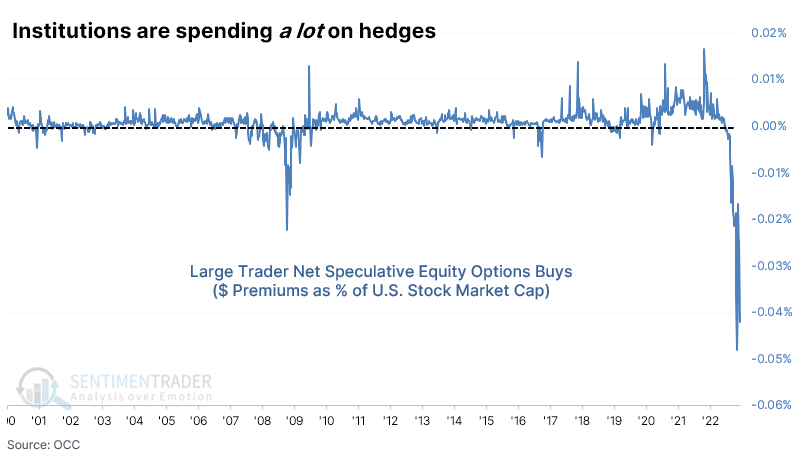
Institutions once again place massive bets against stocks
Two months ago, we looked at the historic surge in institutional traders' options bets against stocks. We'd never seen anything like it other than during the financial crisis.
The S&P 500 rallied more than 13% since that point, but they are once again placing near-record bets against stocks.
Looking at the weekly report of options activity across all U.S. exchanges can be helpful. It weeds out the weird stuff and allows us to narrow down who is doing what. And last week, the largest traders in the market bought to open the fewest equity call options relative to put options since 2009.
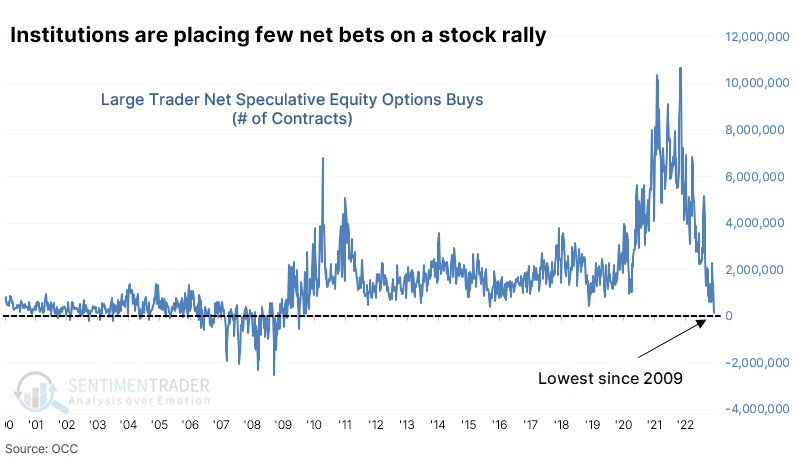
More importantly, they're paying up for the right to buy those puts as hedges against a decline. Large traders bought to open $1.1 billion worth of call options but a massive $19.0 billion of put options for a net speculative volume of -$17.8 billion. As a percentage of market capitalization, last week's put bonanza isn't all the much, but that ignores the knock-on effects of downstream hedging activity from dealers. And it's still among the largest net speculative bets against stocks in history.
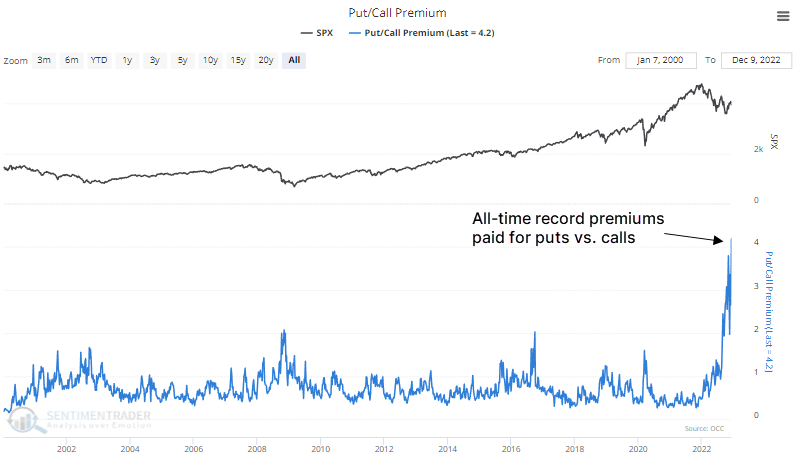
If we look at the total amount of premiums spent on puts divided by the amount spent on calls among all traders across all U.S. exchanges, there was $4.20 spent on puts for every $1 spent on calls among equities and ETFs. This excludes closing and selling-to-open transactions, so it's a pretty pure reflection of traders' immediate thoughts on the direction of the stock market.
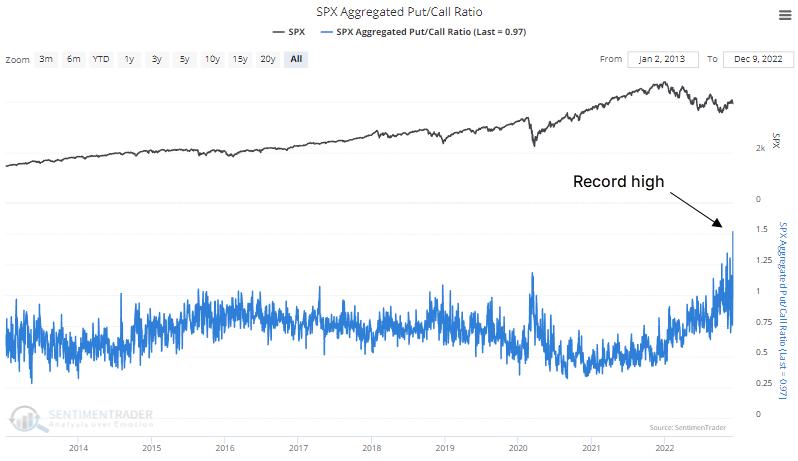
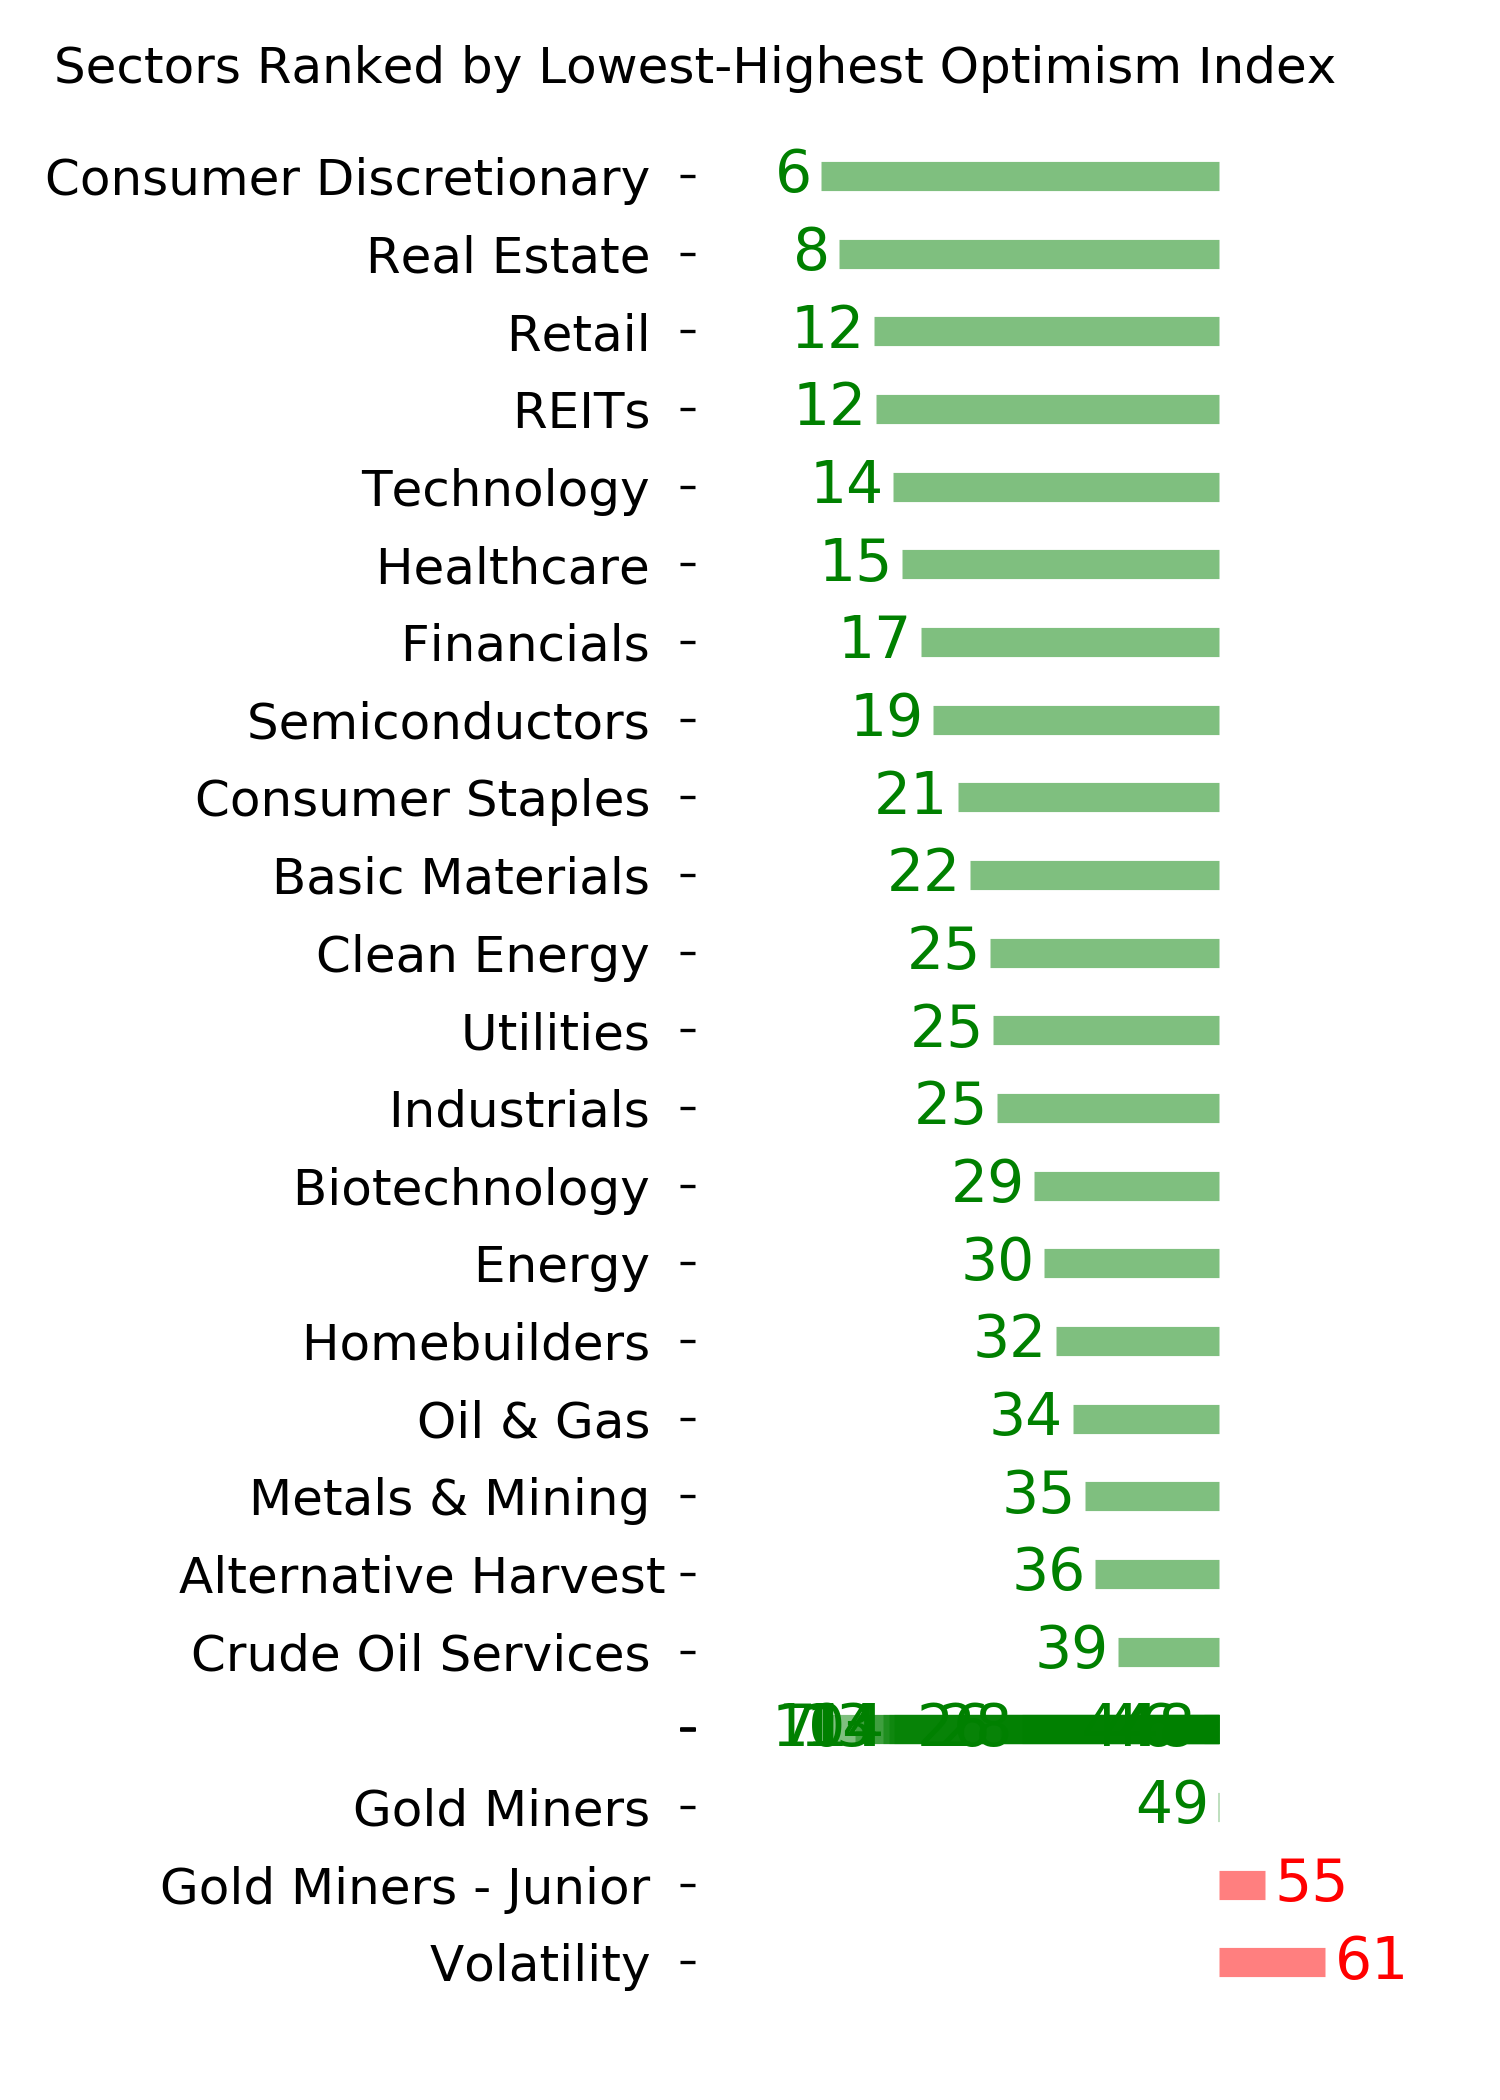
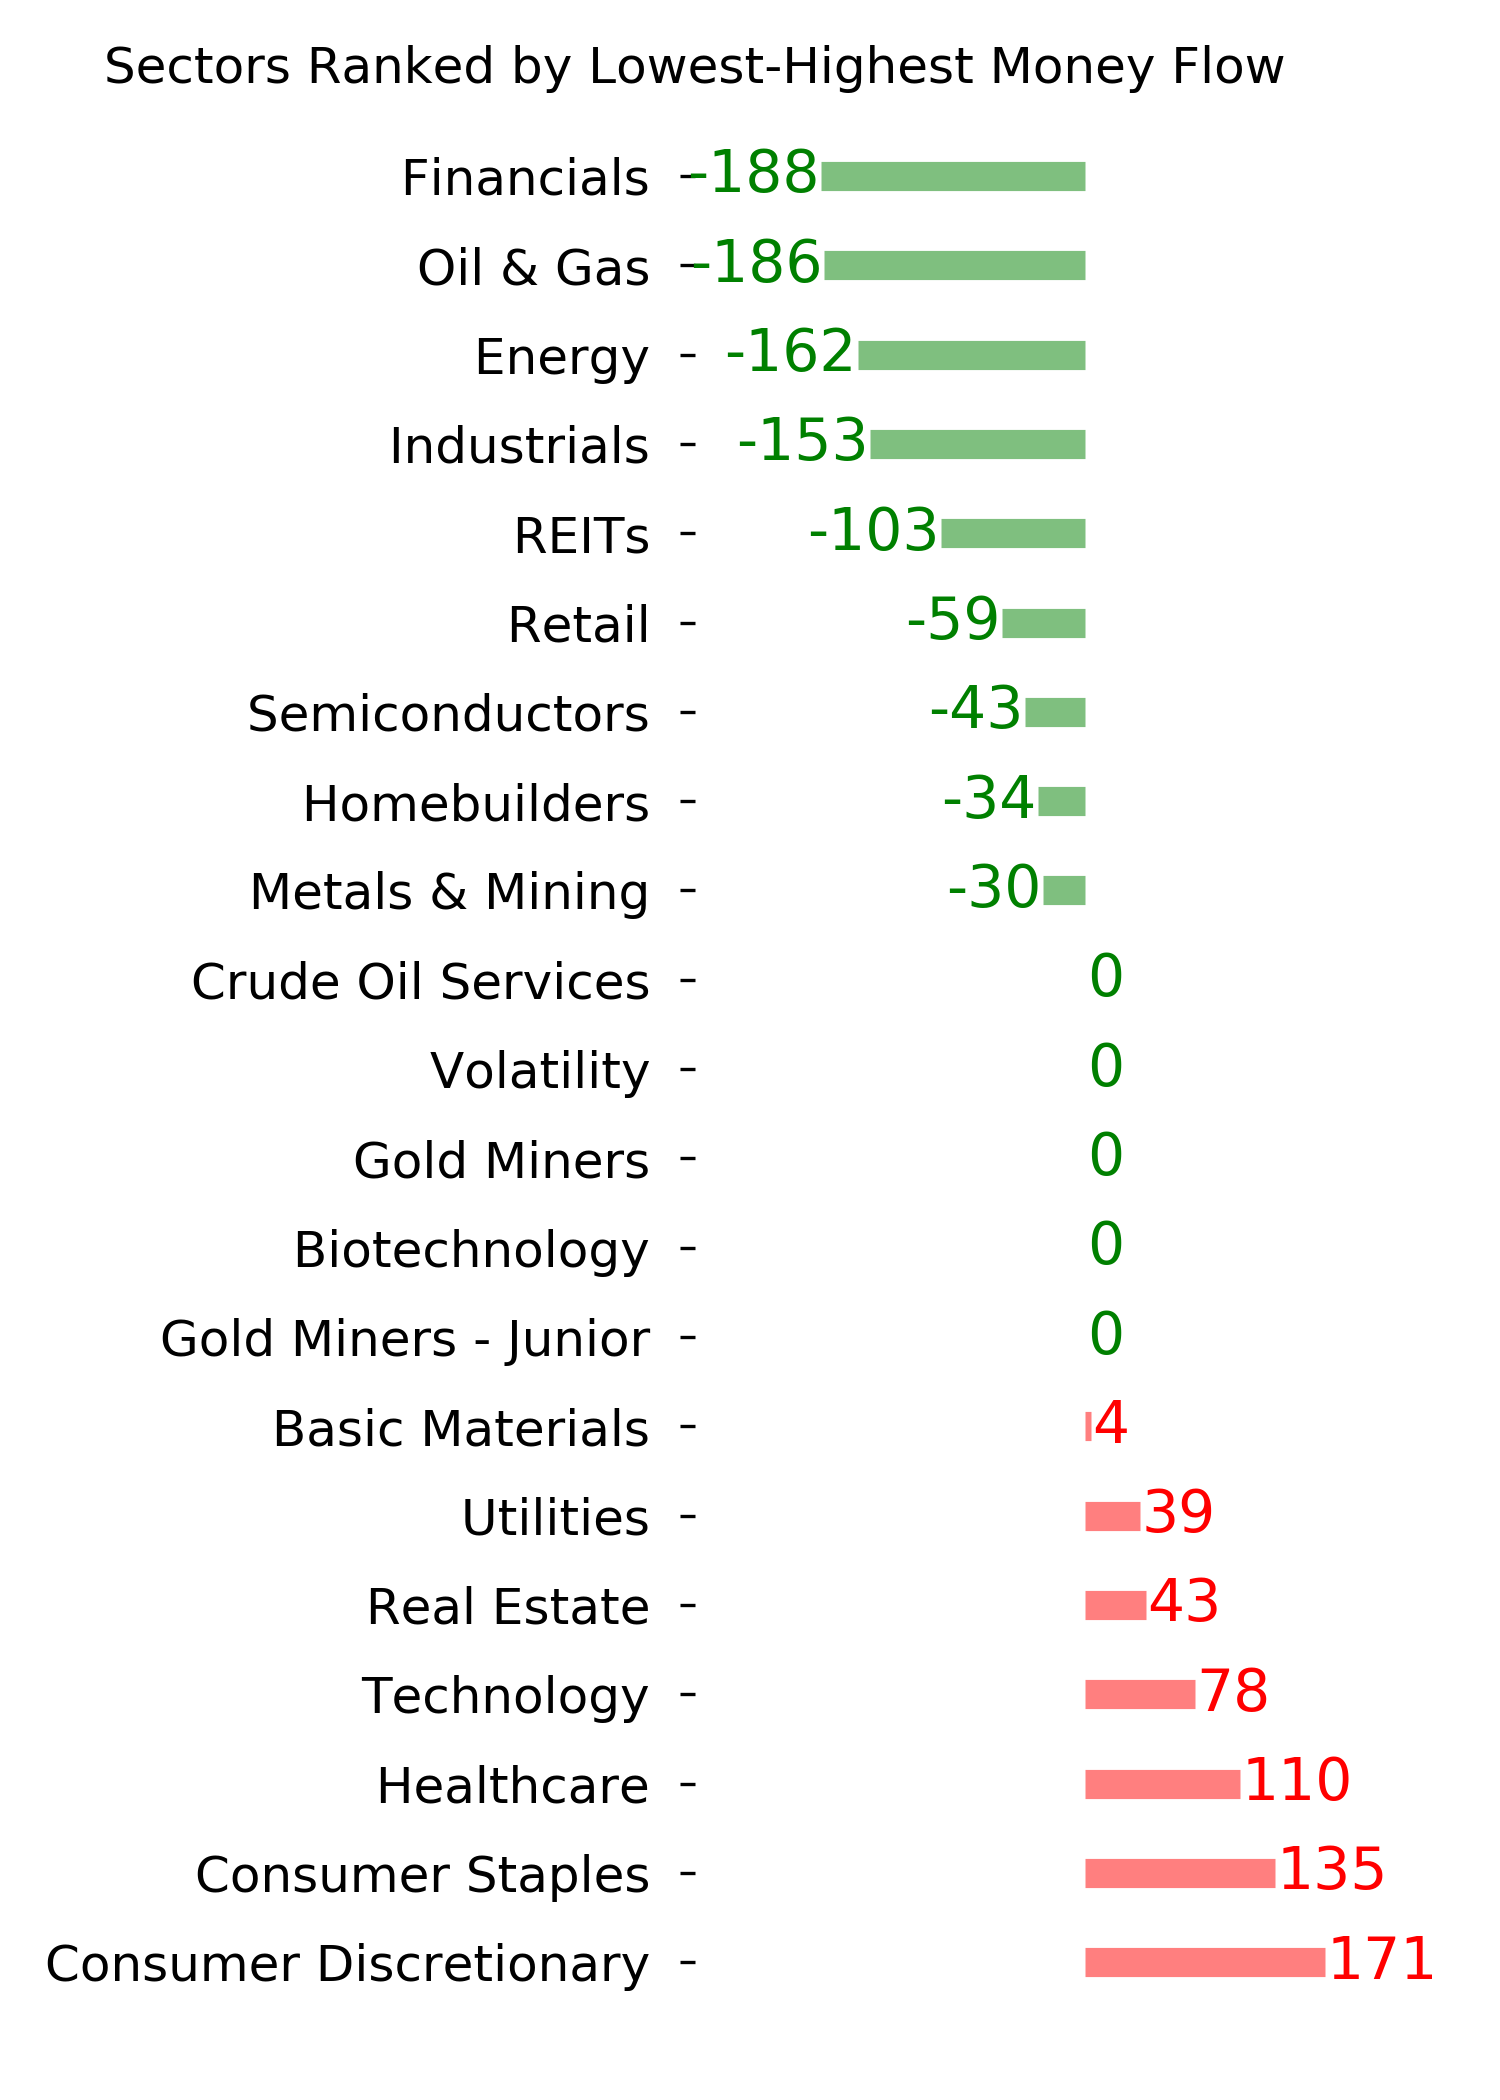
Several sectors also see record put option activity
Put/call ratios among stocks in the Nasdaq 100, broader S&P Information Technology sector, and Financials, all hit records last week. At the same time, corporate insider selling in those sectors is at or near decade lows.
If we roll all the sectors together and look at the total S&P 500 Aggregated Put/Call Ratio, it should be no surprise that it also skyrocketed to a record high last week.
But some smart money folks aren't getting rid of their shares. Among all companies in the index, corporate insider selling has just increased from a record low (at least over the past 12 years).
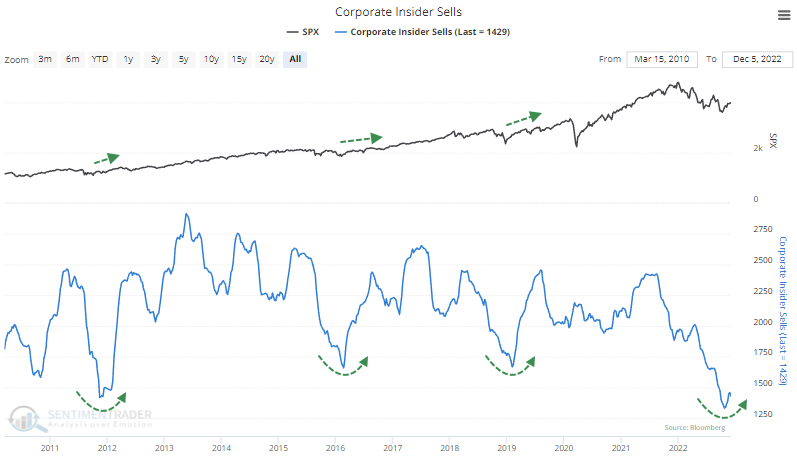
There are always reasons to ignore extremes in indicators. We've done it in the past and usually regretted it. Sometimes, markets change, and indicators lose effectiveness. Maybe that's the case here but it takes many successive failures in an indicator to cast doubt on their future effectiveness, and we don't have nearly enough evidence for that here.
Energy stocks are oversold
Dean recently shared a study suggesting energy stocks could decline in the near term as the sector diverged from crude oil. Two weeks later, the group was down 10%. The swift correction created a potentially bullish setup for the sector, as most stocks maintain a rising 200-day average.
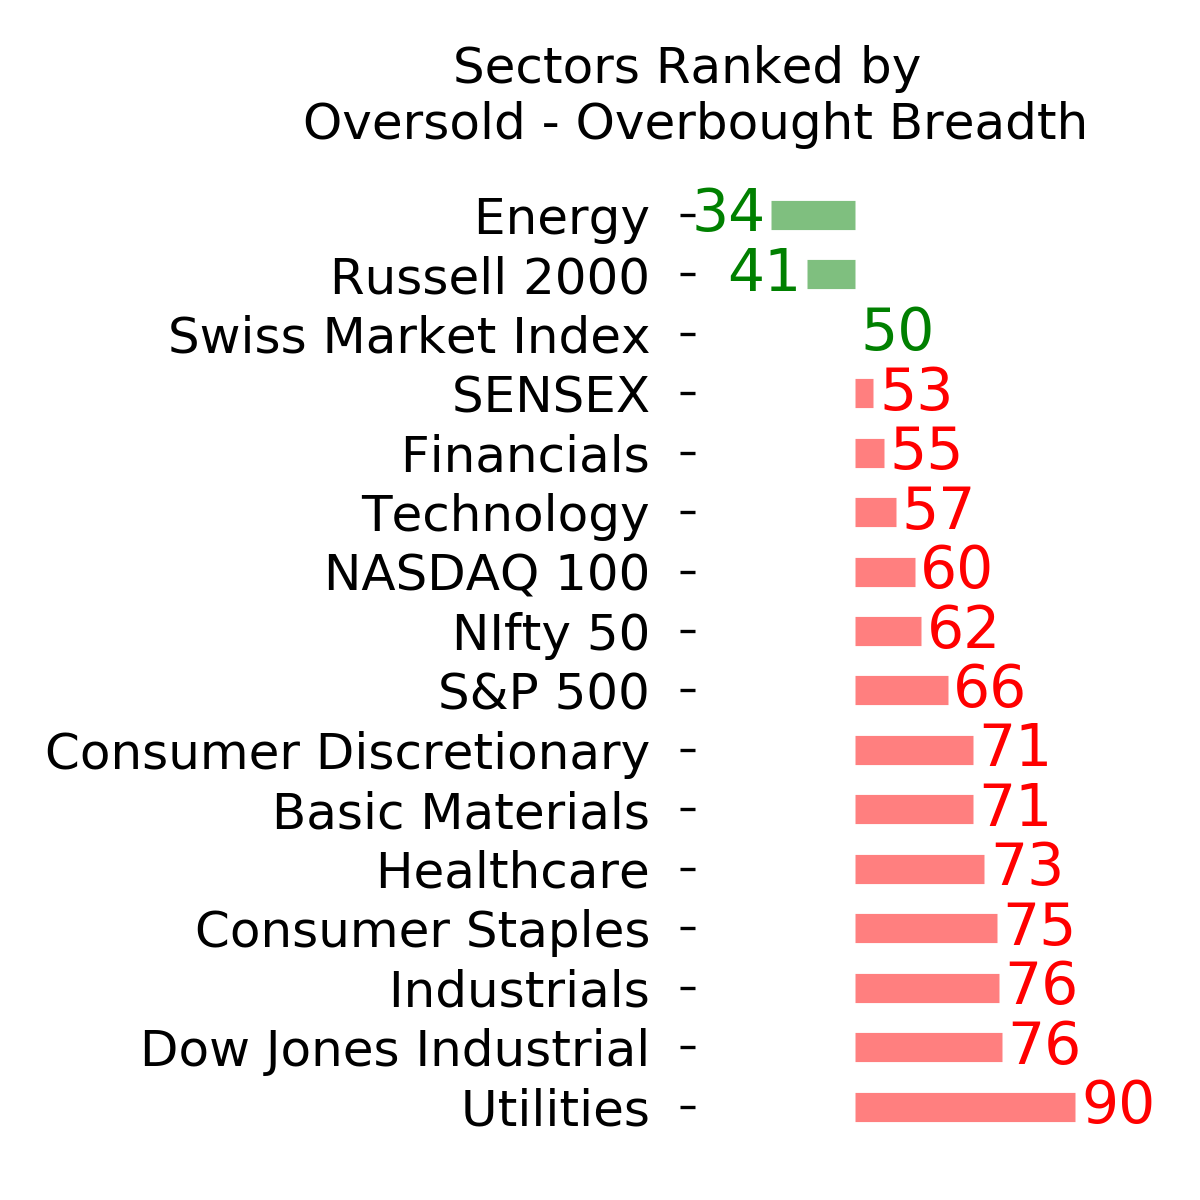
He noted that for only the 23rd time since 1953, the percentage of oversold stocks within the S&P 500 energy sector exceeded 95%. An oversold condition occurs when the 14-day stochastic oscillator, a momentum indicator, falls below 20%.
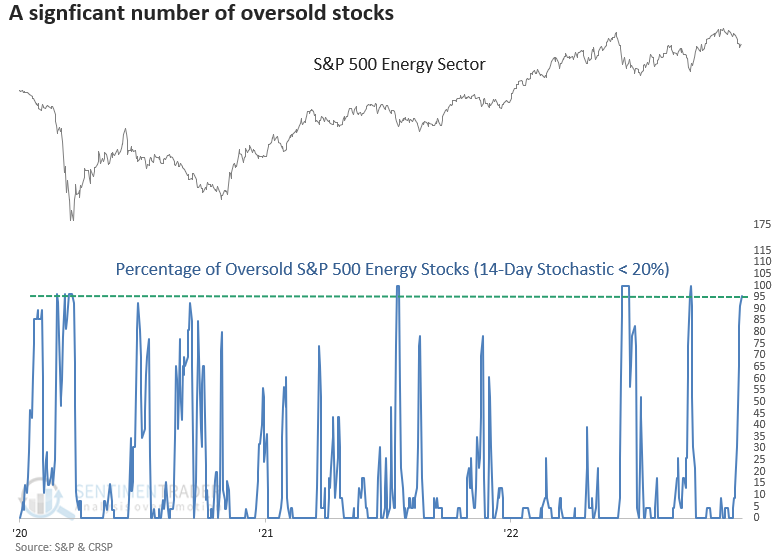
When the percentage of oversold S&P 500 energy stocks exceeds 95%, the sector tends to bounce, especially three months later. The signal struggled during unfavorable long-term trend conditions for the group, which is not the case now.
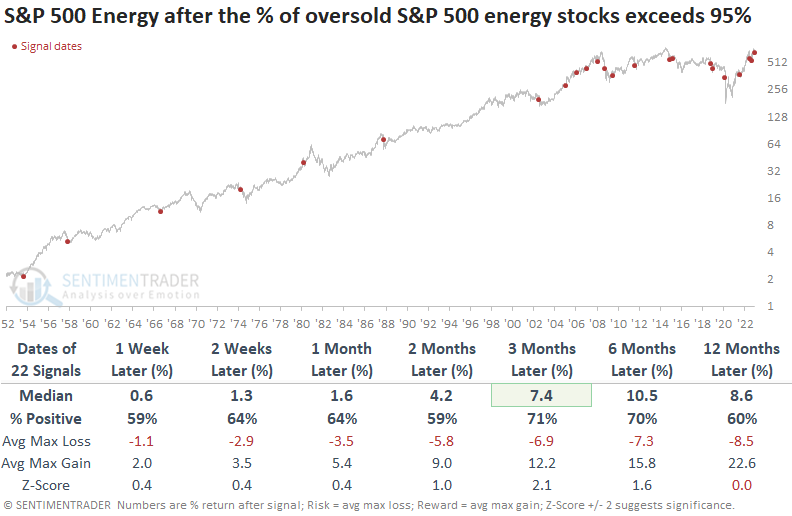
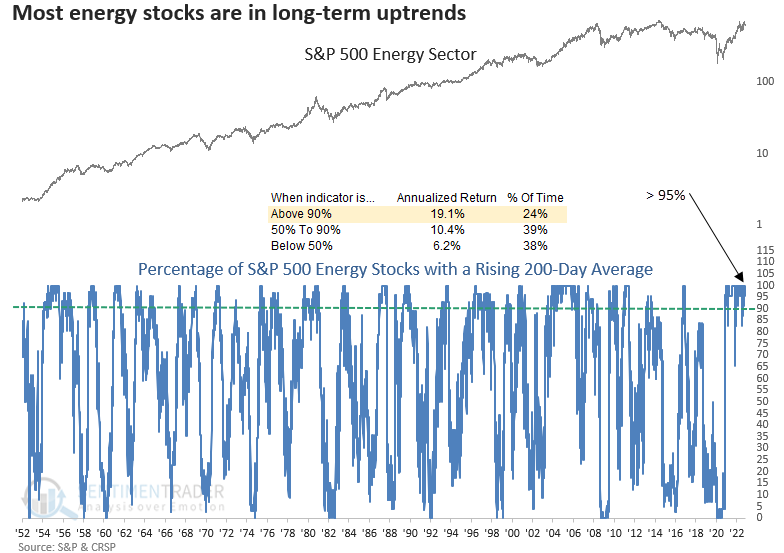
The long-term trend backdrop for S&P 500 energy stocks remains favorable, with over 95% of sector members maintaining a rising 200-day average. The current trend profile looks similar to other bullish secular periods like 2003-08 and 1974-80.
While it could always be different this time, the energy sector typically provides positive returns in the first few months after the NBER declares a recession. And from a sub-sector perspective, integrated oil companies tend to perform the best.
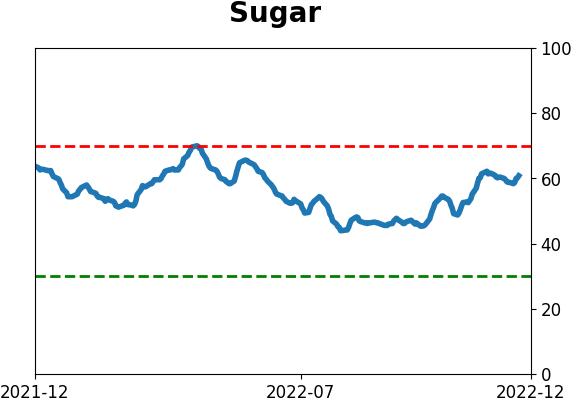
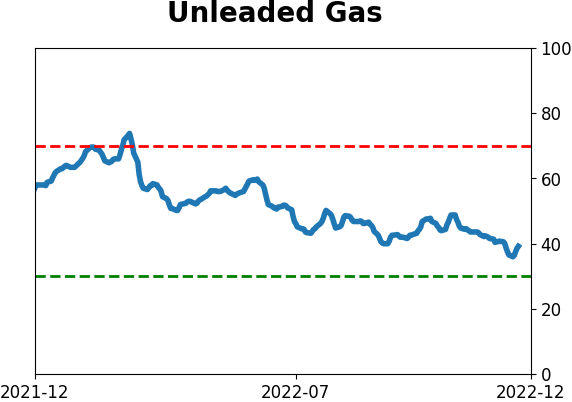
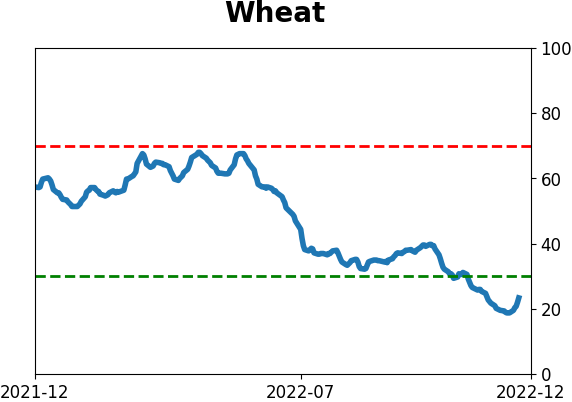
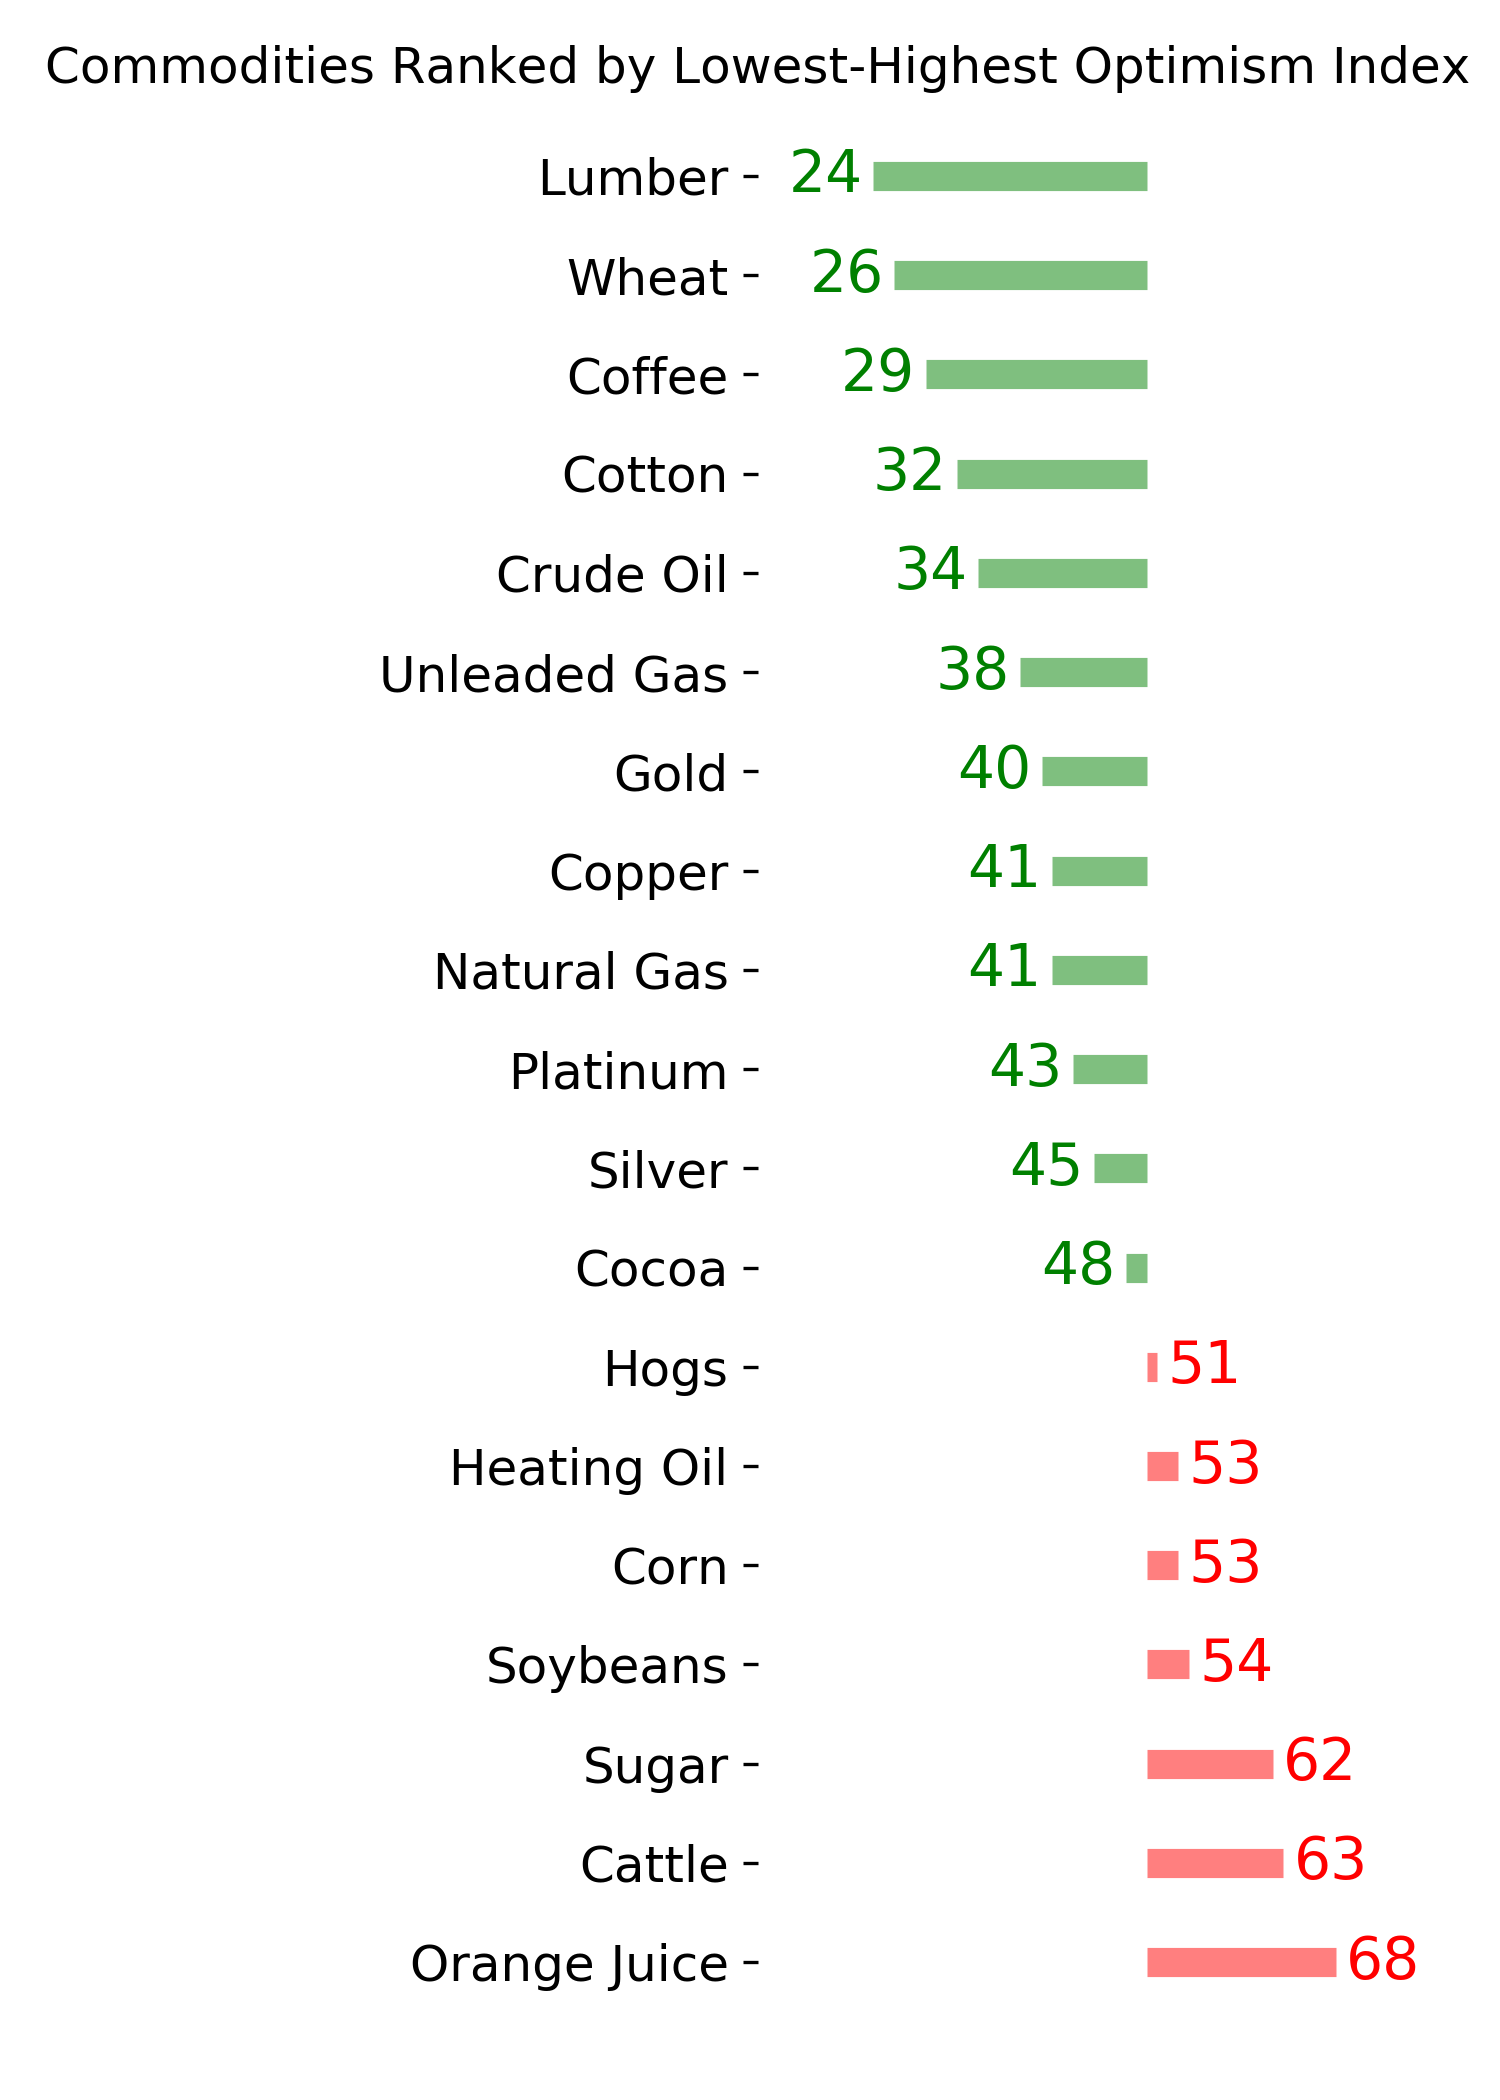
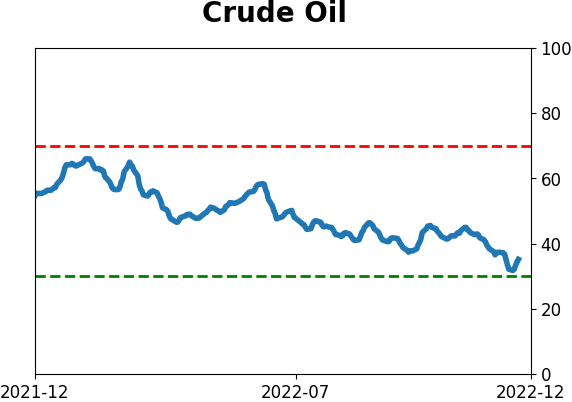
The drop in oil prices has dented sentiment
Crude oil has been taking it on the chin, a major victory for consumers and a minor one for investors. We should see consumer sentiment surveys improving as oil struggles.
The decline in recent weeks was enough to push the Crude Oil Optimism Index (Optix) to 30% for the first time in years. The Backtest Engine shows that a reading of 30% or below leads to below-average returns for crude oil. While a low reading occurred at most major lows, when it first reached this level, trend followers got the benefit of the doubt.
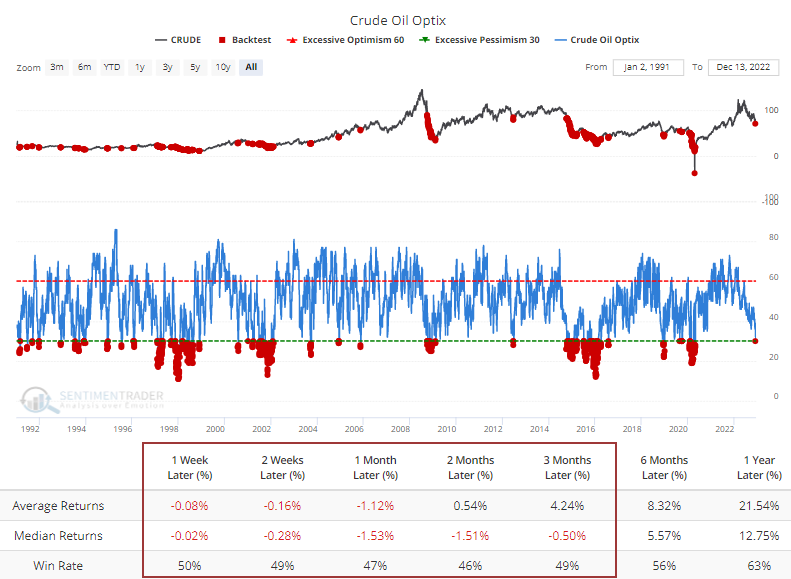
The table below shows every time over the past 30 years when oil's Optix cycled from 60% or above to 30% or below.
When the cycle took 30 or more days (which is the case now), crude's median 6-month return was -12.5%, and it was higher 45% of the time. When it was under 30 days, the return was +2.8%, with a 67% win rate. So, quick panics in sentiment tended to lead to relief rebounds more often than drips lower in sentiment as we've seen over the past nine months.
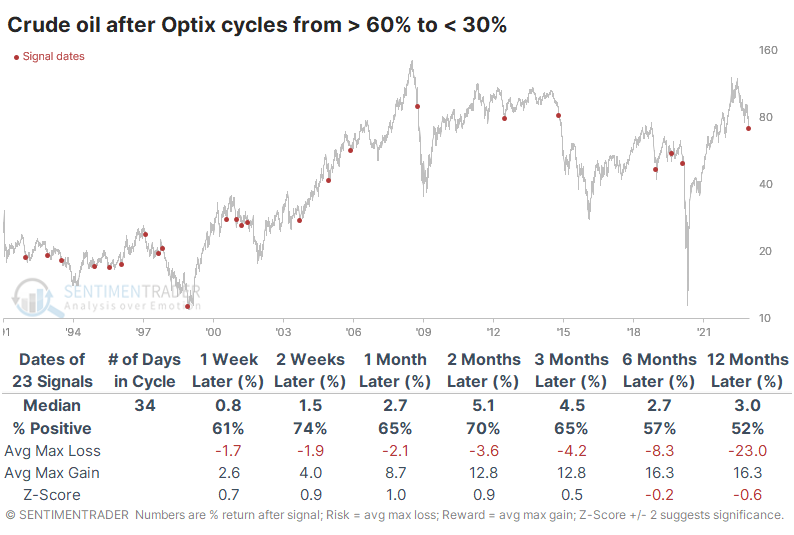
Dean noted the oversold nature of energy stocks above. After these cycles in oil sentiment, the total return in the energy sector was decent, above average up to six months later. There were a few hefty losses in there, however, including the most recent signal.
Treasury yields are dropping across the board
Dean showed that for the first time in more than two years, Treasury yields ranging from 2-10 years closed at a 2-month low in the past month.
Let's assess the outlook for bonds and stocks after 100% of Treasury yields ranging from 2-10 years close at a 2-month low in the past month. I will use a reset condition that requires the 10-year bond yield to close at a 252-day high before a new signal can occur again.
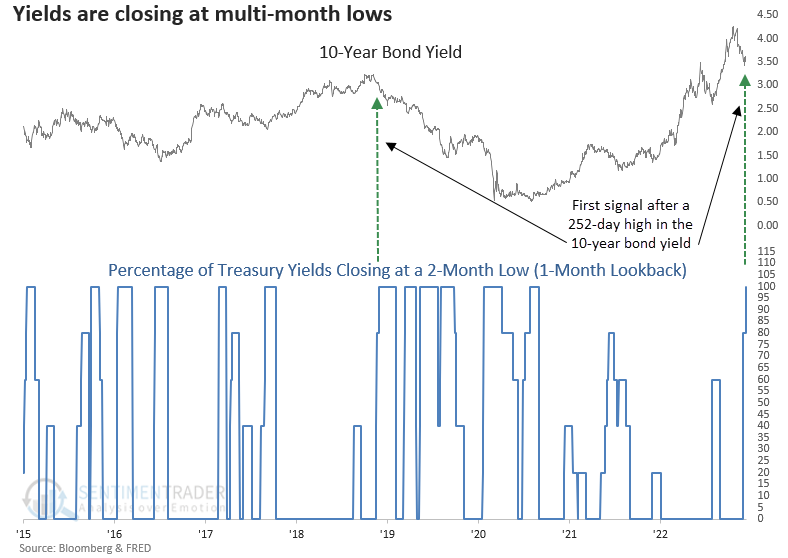
The 2-month low for Treasury yields across the curve provides a compelling case for an easing in the 10-year bond yield. Six months later, rates were lower 75% of the time. Historical precedents during the inflationary 1970-82 period are limited. However, rates were lower in all three instances a month later.
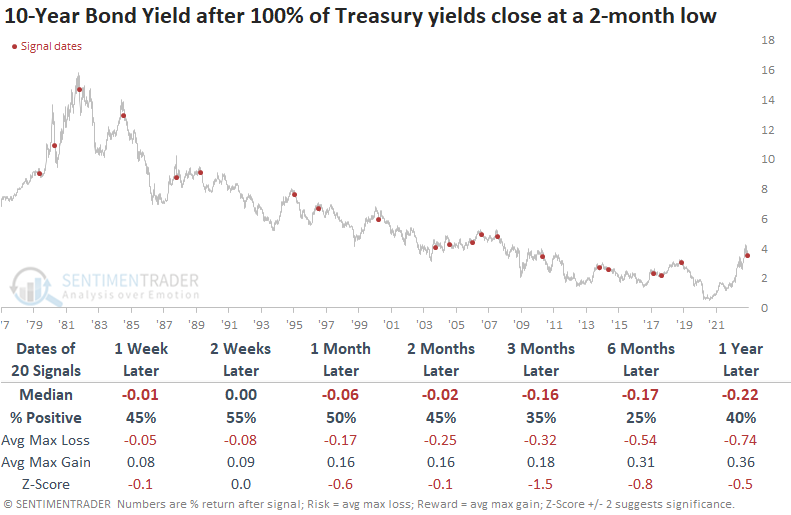
Yields across the curve tend to fall from 1-12 months later. Not surprisingly, long-duration bonds show slightly better win rates.
While a few signals, like 2000 and 2007, are alarming, the overall message from an easing in rates is extremely bullish for stocks. The S&P 500 was higher 90% of the time a year later. From a sector and industry perspective, Financials and Technology tended to perform the best across most time frames. After a year like 2022, Technology-oriented investors would welcome a rate reprieve.
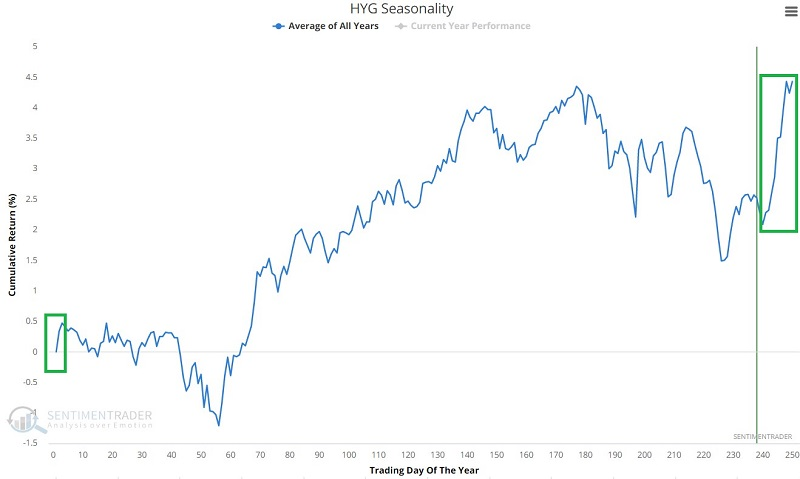
High-yield bonds are entering a positive seasonal window
Jay showed that high-yield bonds are entering a favorable seasonal period. The period combines the end of the year with the first few days of the new year and ETFs offer investors a simple way to play.
The window begins on the close of Trading Day of Year (TDY) #240 and extends through the close on the 3rd trading day of the new year. For 2022, this period begins at the close on December 14 and extends through the close on January 5 of 2023.
The chart below displays the annual seasonal trend for iShares iBoxx $ High Yield Corporate Bond ETF (HYG) and highlights the seasonal window.
To create the longest test period possible, we will initially use daily total return data for Vanguard High Yield Corporate Fund (VWEHX), which began trading in 1980. The chart below displays the cumulative growth of $1 invested in VWEHX only from TDY #240 through TDY #3 of the following year each year, starting in 1980.
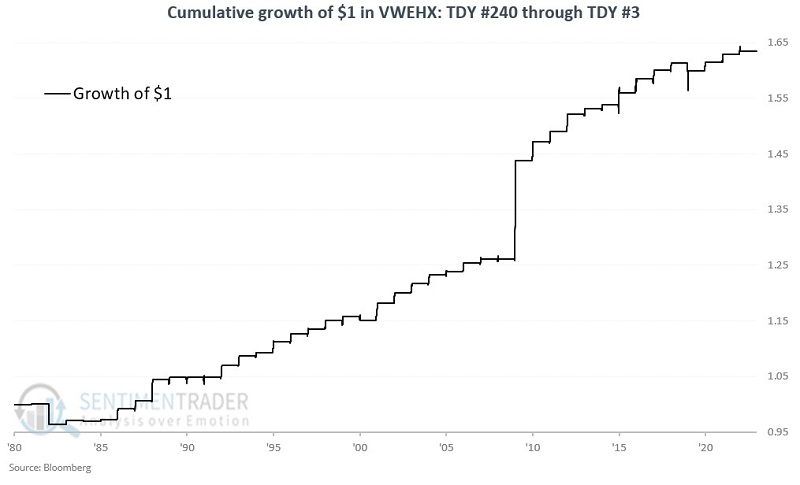
During these windows, the fund gained 36 times and retreated only 6 times. Its average gain of +1.5% wasn't exceptional, but remember, this is a bond fund where volatility tends to be lower.
Vanguard has certain switching restrictions, but there is an ETF alternative. iShares iBoxx $ High Yield Corporate Bond ETF (HYG) is a heavily-traded ETF that tracks the iBoxx USD Liquid High Yield Index. HYG began trading in 2007. It also tended to show good performance during these seasonal windows.
Gold's positive window combined with trend
Last week, Jay wrote about a seasonal anomaly for gold mining stocks. Now, let's turn to the yellow metal itself. The chart below shows the annual seasonal trend for gold. We are about to enter what is typically one of the most favorable times of the year for gold.
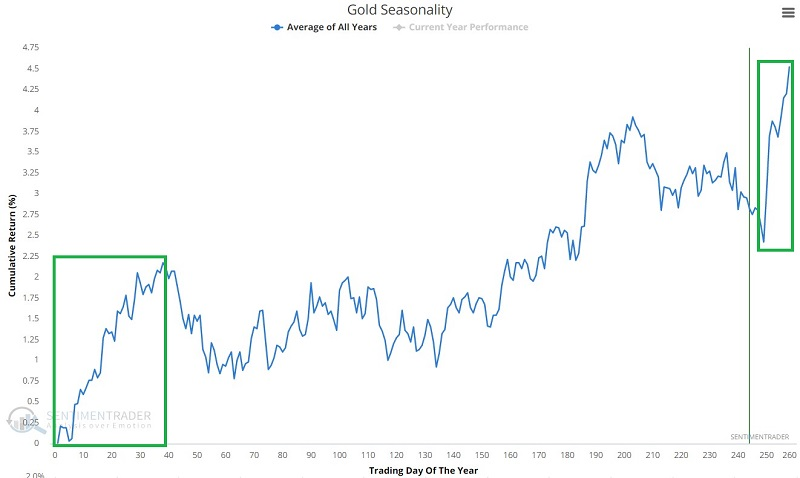
The period in question begins on the close of Trading Day of the Year #249. It extends through the close of TDY #39 of the following year. For 2022-23 this period extends from the close on December 15 through the close on February 23 next year.
The chart below displays the cumulative growth of $1 invested in gold bullion held long during these seasonal windows starting in December 1975.
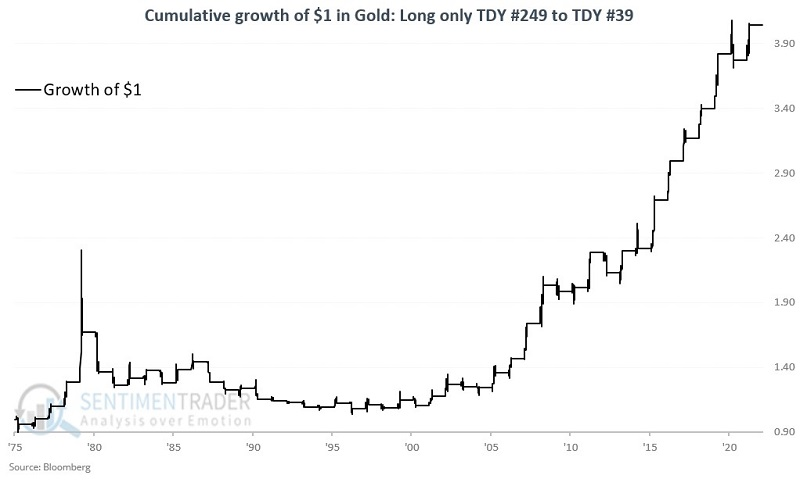
Gold rallied 60% of the time during these windows, which is decent. Its average return during the winning years was nearly twice as large as the average loss during the losing years. While it did suffer a couple of large losses, it was much more common to see large gains.
Gold is a market that typically trends well.
- We will call the price trend favorable if gold is trading higher than it was 252 trading days prior
- We will call the price unfavorable if gold is trading lower than it was 252 trading days prior
The blue line in the chart below displays the cumulative growth of $1 invested gold only when a) gold is higher than it was 252 days prior, and b) the current TDY is greater than 249 or less than 39 (blue line), versus the original results shown above (black line).
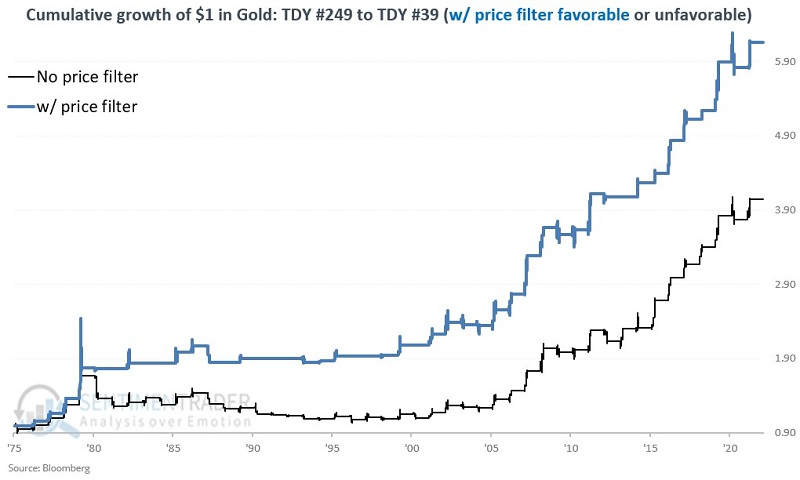
As you can see, trading a long position in gold during the seasonally favorable period only if the price is in an uptrend appears to improve overall long-term results.
Adding the price filter improved the winning percentage to 77%, and the average gain during winning years vastly outpaced the losses during losing ones. And there was a much greater chance of a big win than a big loss.
For the GLD exchange-traded fund, Jay noted that the favorable year-end/new-year period is slightly different and extends from the close of TDY #246 through the close of TDY #36 of the following year. For GLD, the seasonally favorable period this year extends from the close on December 22 through the close on February 23 next year.
The chart below displays the cumulative growth of $1 invested in GLD only during this seasonally favorable period.
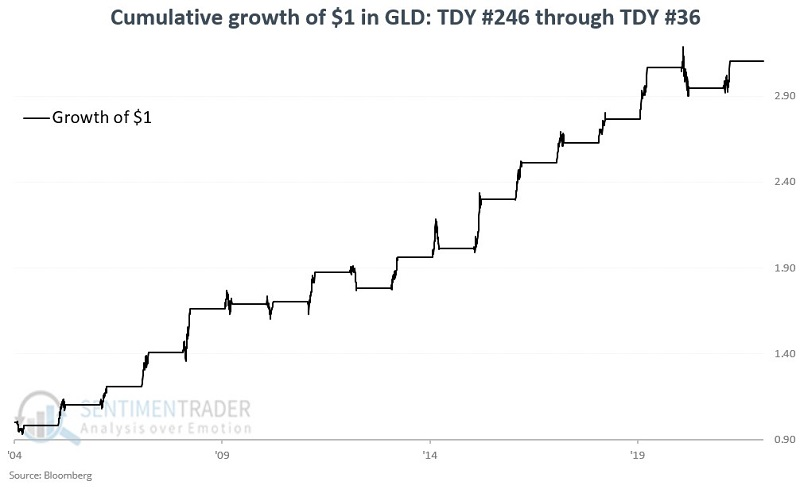
It resulted in 15 gains out of 18 years, with much better average gains than average losses.
A seasonal tailwind should help gold mining stocks continue their recovery
The long-term trends of many gold mining stocks have improved to the point where more than half of them are regularly trading above their 200-day moving averages. This is a stark change from October, when virtually all mining stocks were below their long-term trendlines.
There have been two similar scenarios in recent decades. In 2009, it equated with the end of the bear market. In 2014, miners took another hard leg down before bottoming. Not much help there.
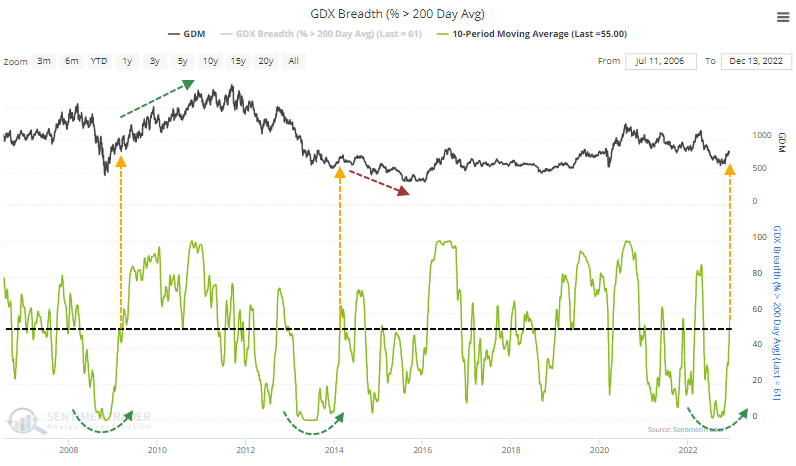
The table below shows every time in the past 40 years when the percentage of mining stocks trading above their 200-day average cycled from below 15% to above 50%. To weed out some of the most volatile periods, we use a 10-day average of the indicator.
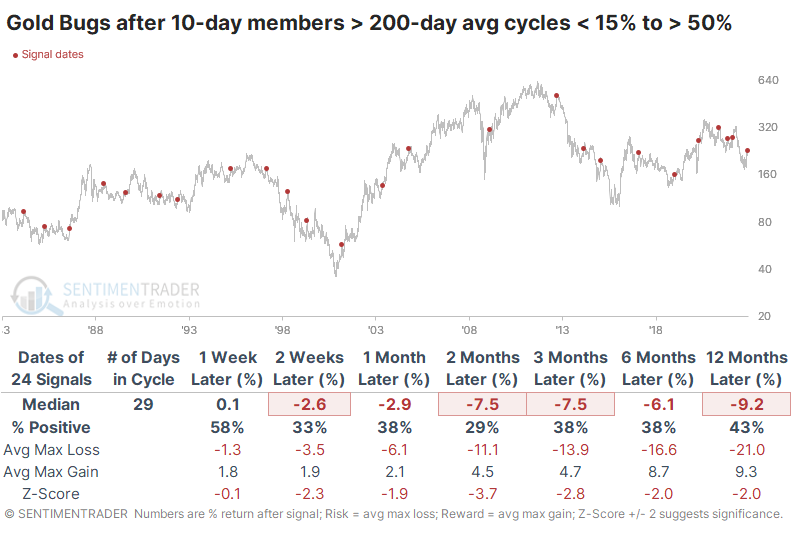
Over the next two months, the HUI Gold Bugs Index tacked on further gains only 29% of the time. Across all time frames from two weeks and beyond, the risk/reward was horrid.
But if miners showed a positive, or very slightly negative, return over the next couple of months, they invariably showed positive returns over the next year. Part of that is tautological since a positive two-month return automatically helps to generate a positive twelve-month return. But in every case, the returns increased, usually substantially.
Notably, the last signal from February of this year shows a positive two-month return, but miners turned down immediately afterward and showed a terrible six-month loss. That throws some cold water on the correlation.
About TradingEdge Weekly...
The goal of TradingEdge Weekly is to summarize some of the research published to SentimenTrader over the past week. Sometimes there is a lot to digest and this summary is meant to highlight the highest conviction or most compelling ideas we discussed. This is NOT the full research that's published, rather it pulls out some of the most relevant parts. It includes links to the published research for convenience; if you don't subscribe to those products it will present the options for access.
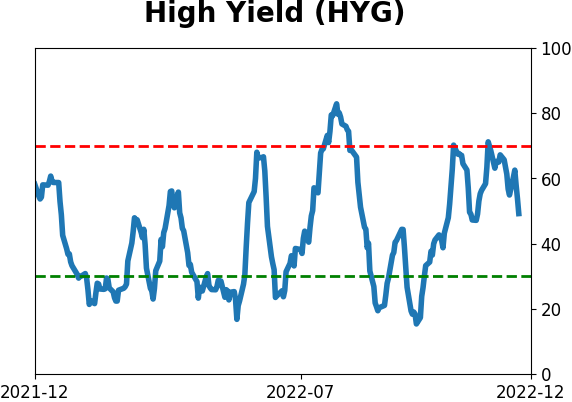
Indicators at Extremes
|
|
|
|
Phase Table
|
|
|
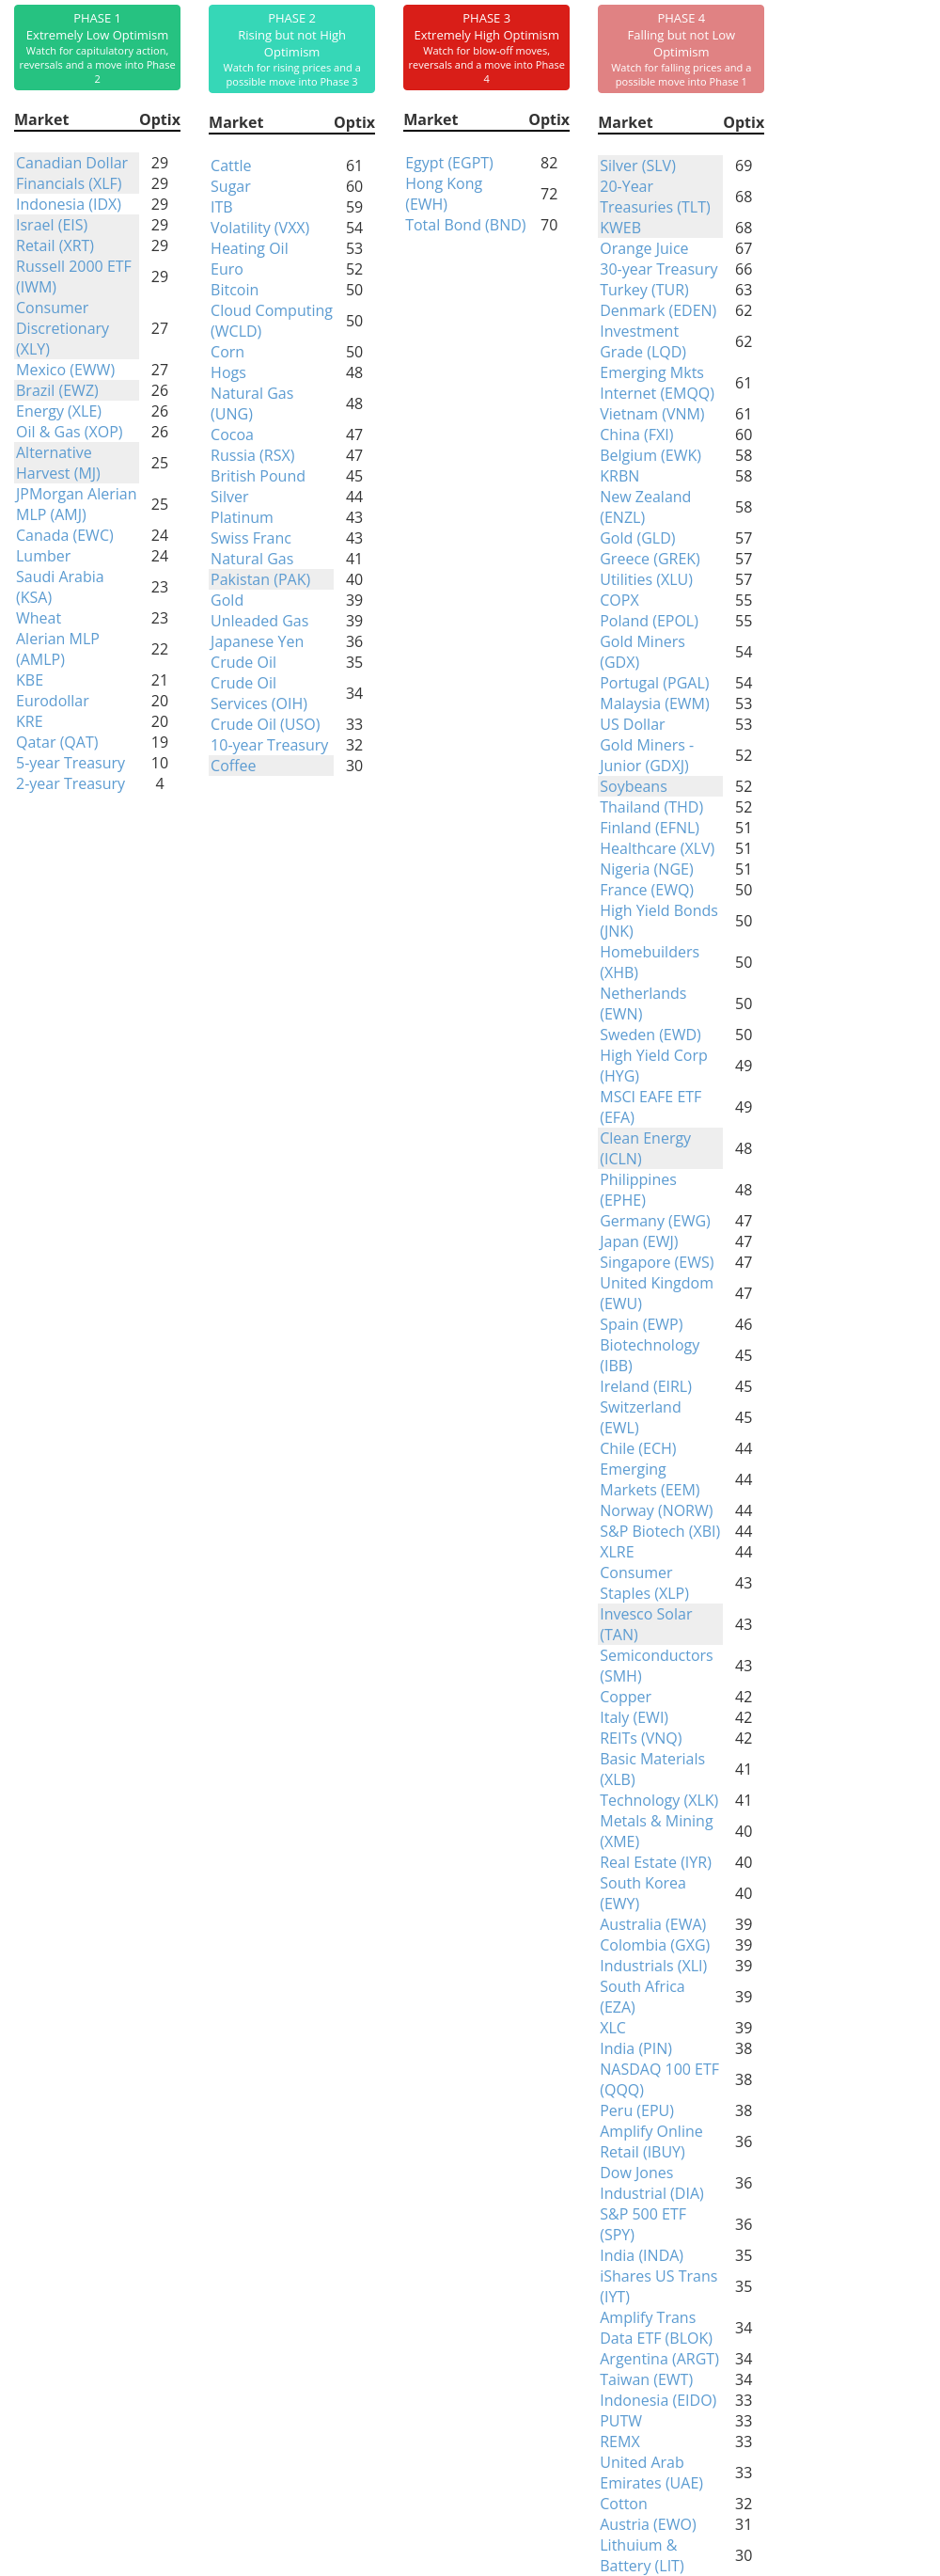
Ranks
|
|
|
|
|
|
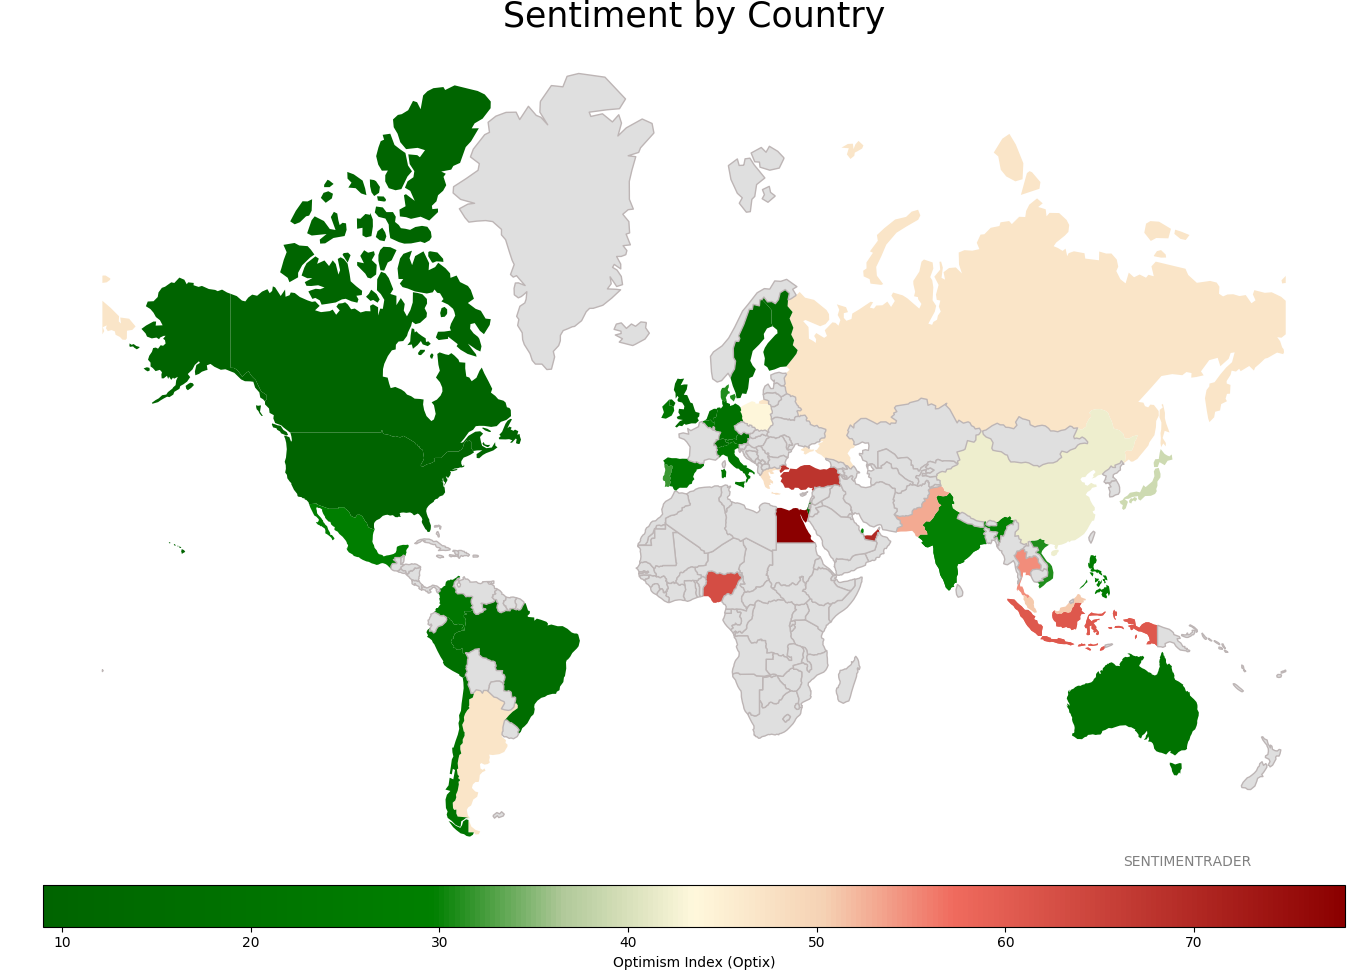
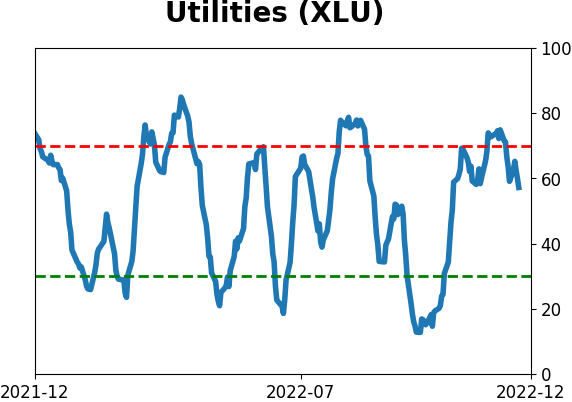
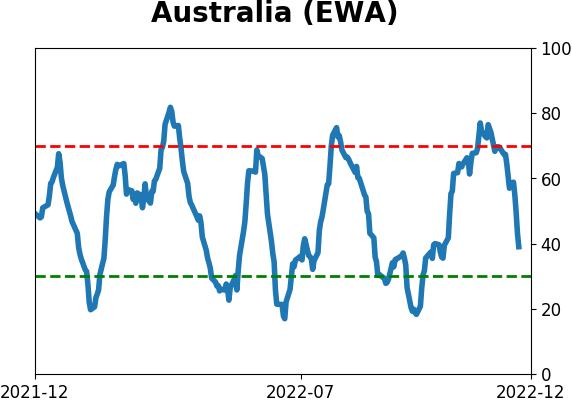
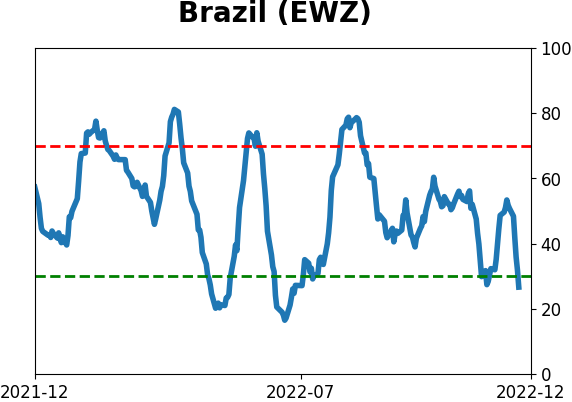
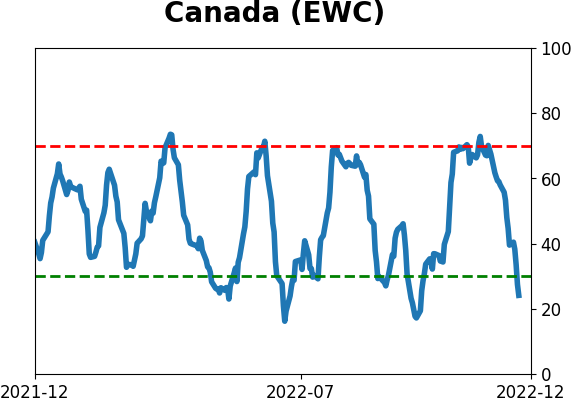
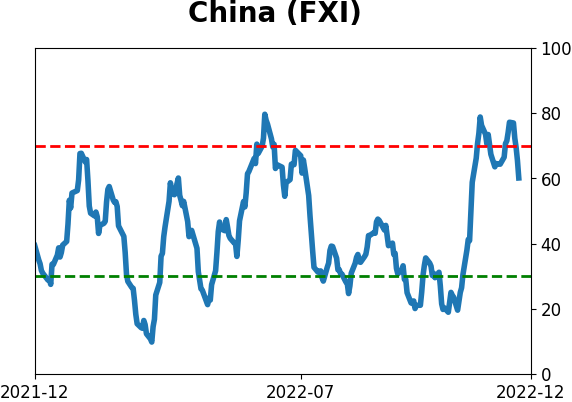
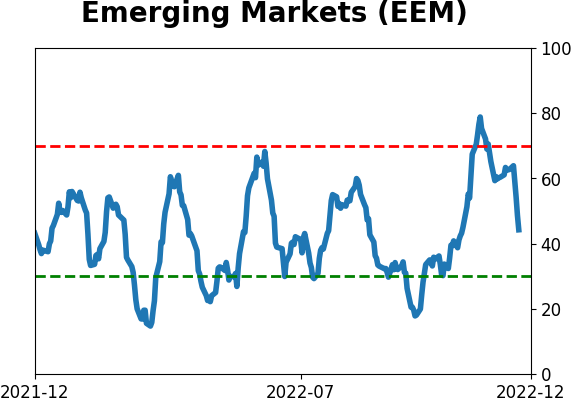
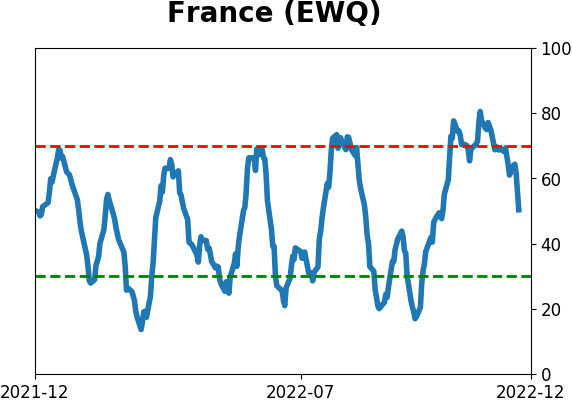
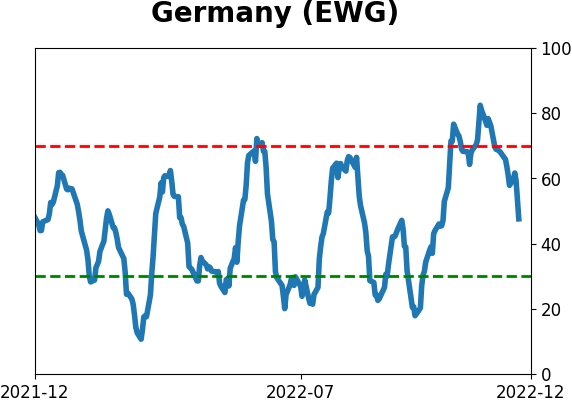
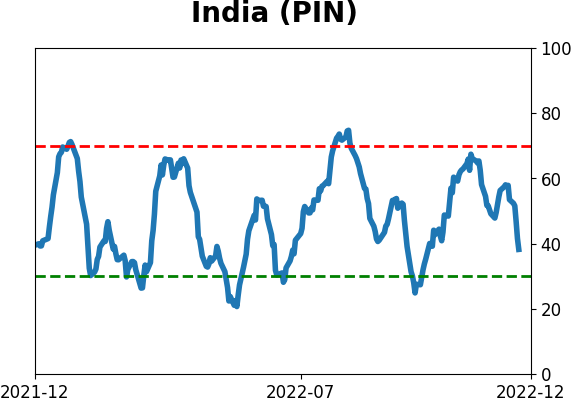
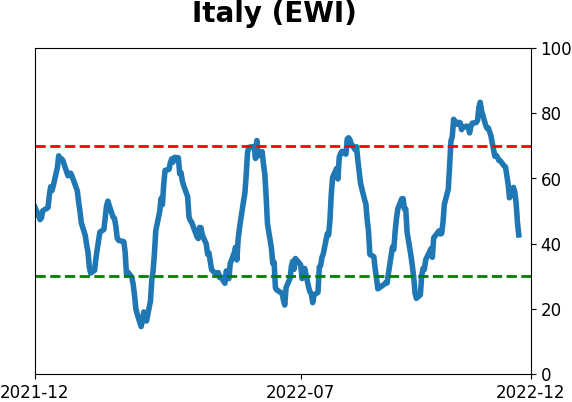
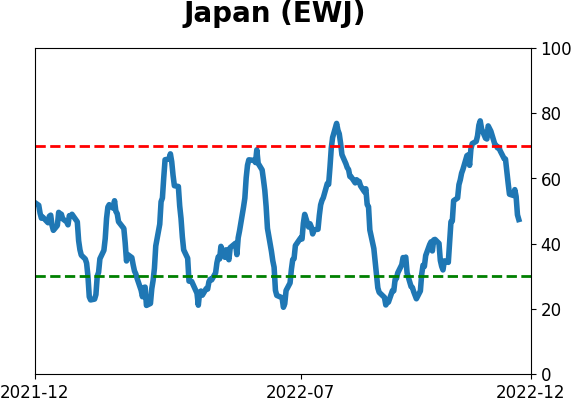
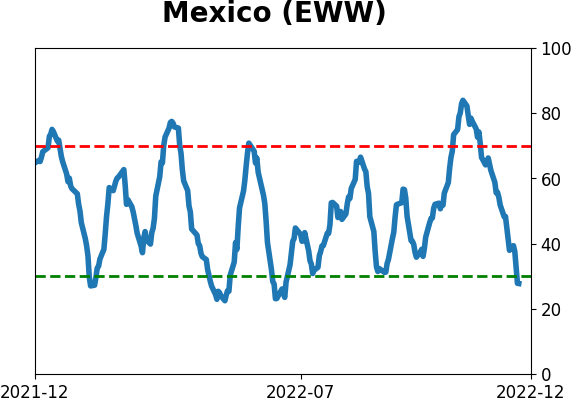
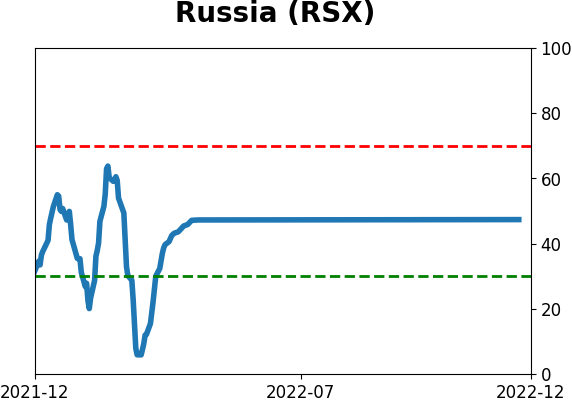
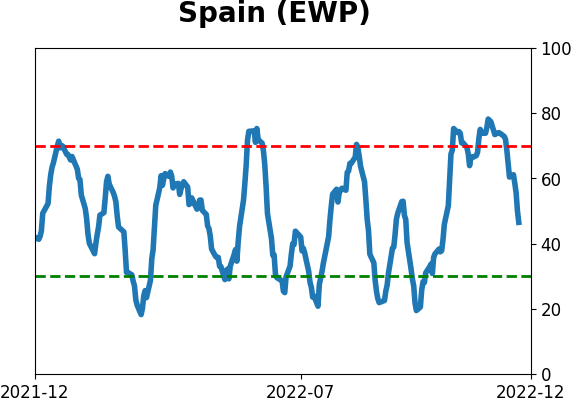
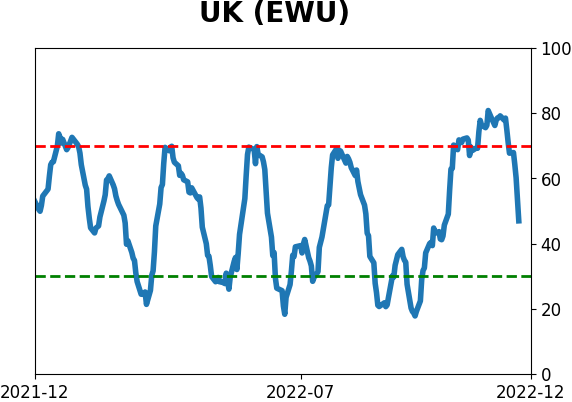
Sentiment Around The World
|
|
|
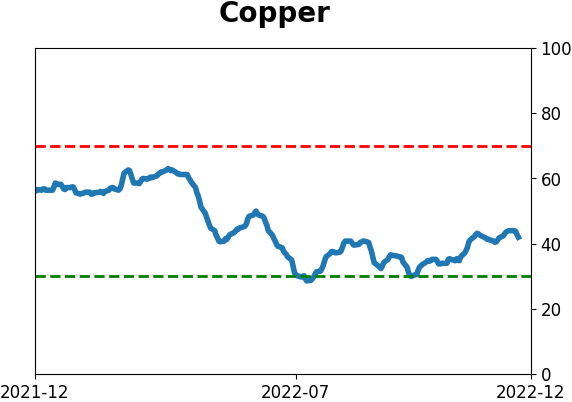
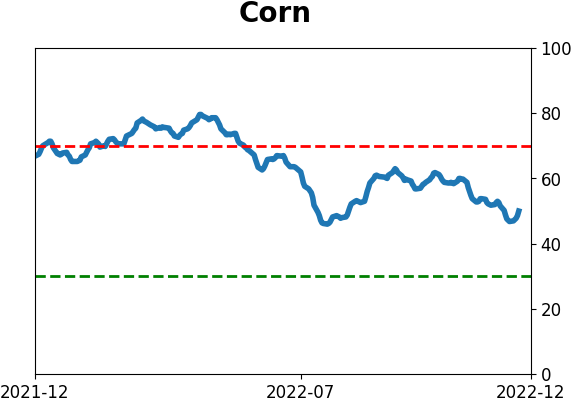
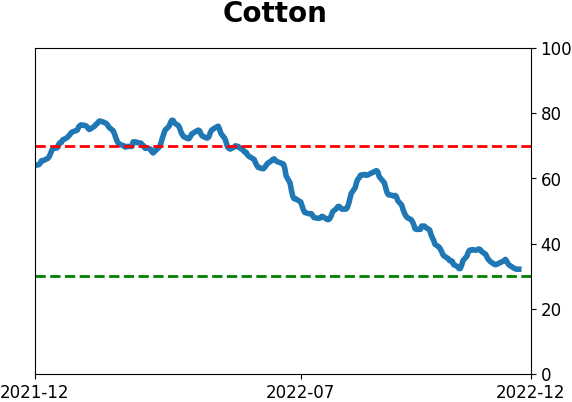
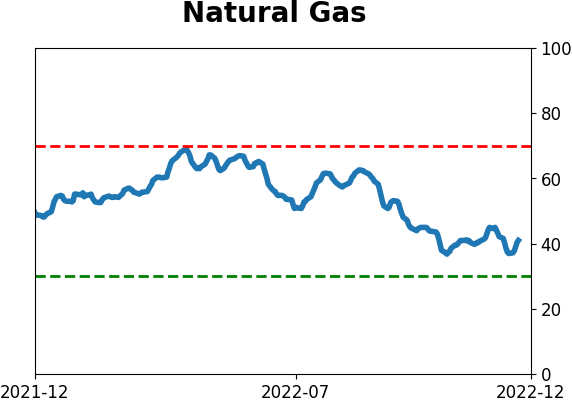
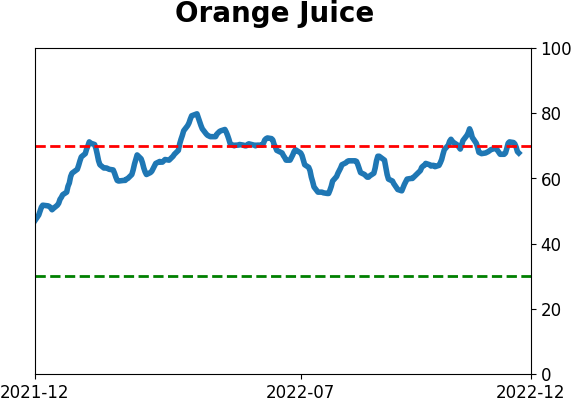
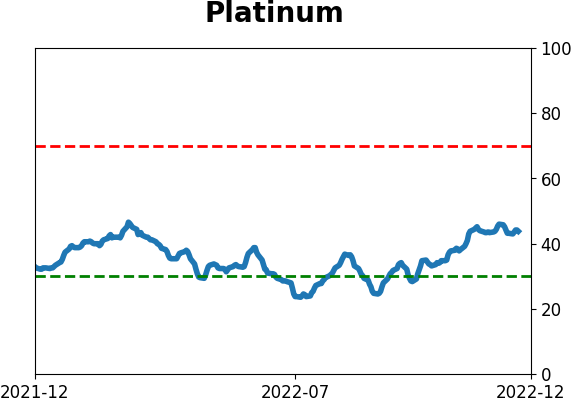
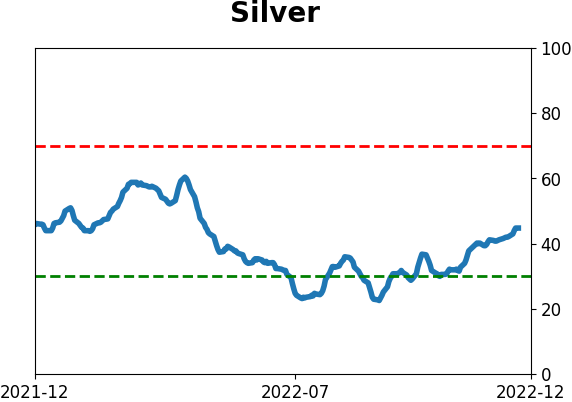
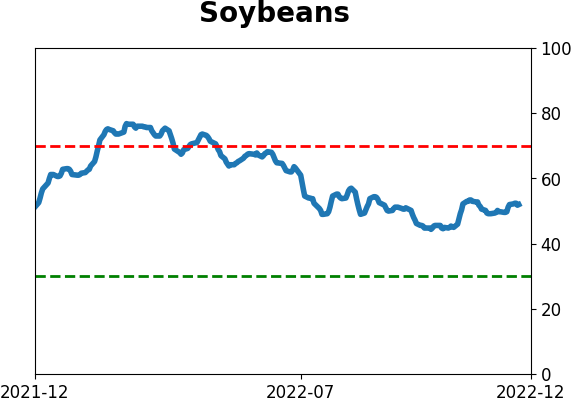
Optimism Index Thumbnails
|
|
|
|
|
|
|
|
|
|
|
|
|
|
|
|
|
|
|
|
|