Headlines
|
|
Gold miners stage another recovery:
There has been a substantial recovery in long-term uptrends among gold mining stocks. When there is a bust like October followed by a recovery like we've seen, how investors react over the next 8 weeks should have an outsized impact on long-term returns.
|
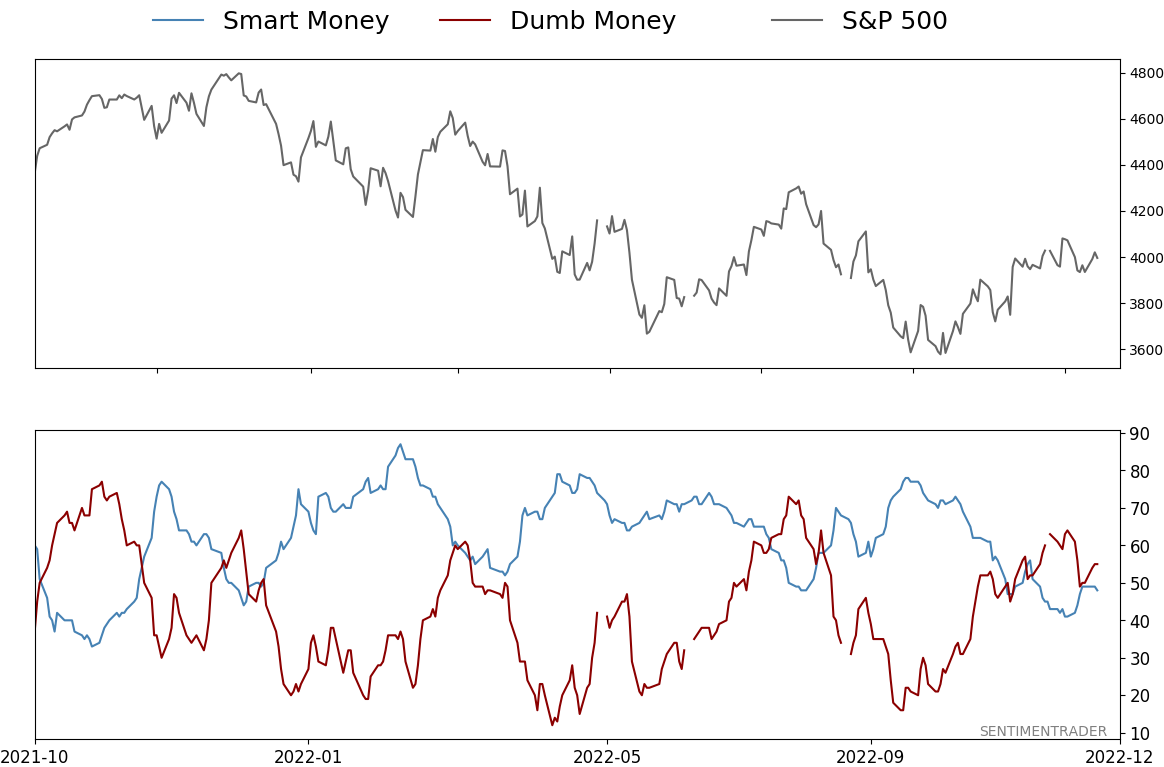
Smart / Dumb Money Confidence
|
Smart Money Confidence: 48%
Dumb Money Confidence: 55%
|
|
Risk Levels
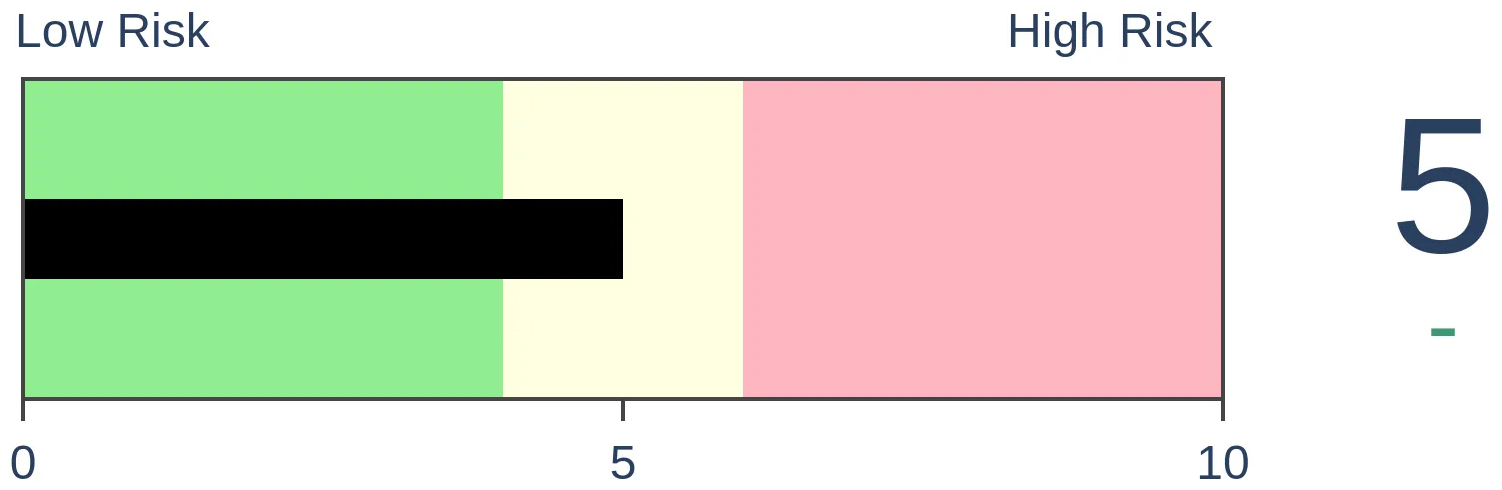
Stocks Short-Term

|
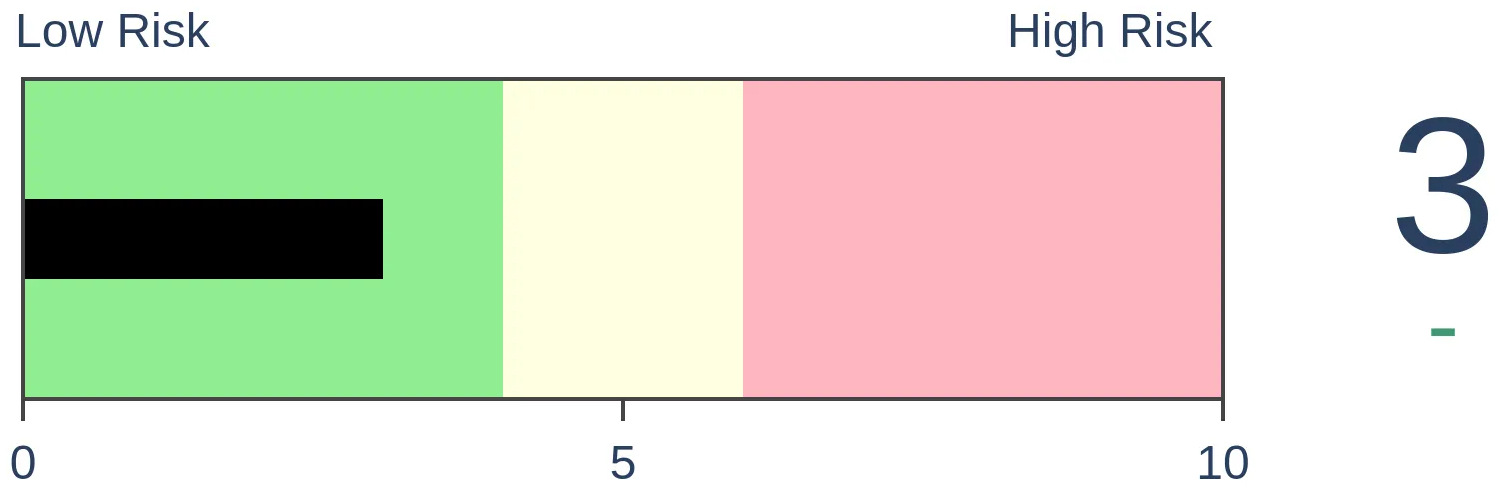
Stocks Medium-Term
|
|
Bonds

|
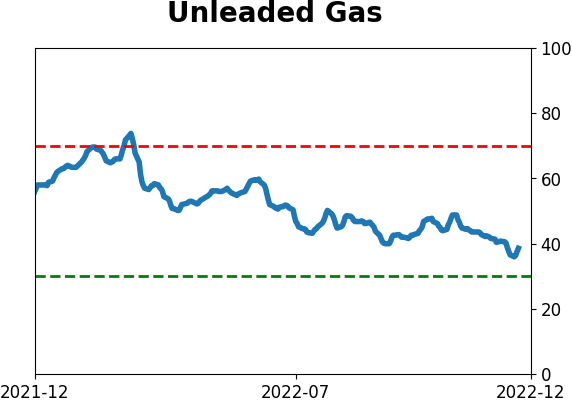
Crude Oil
|
|
Gold
|
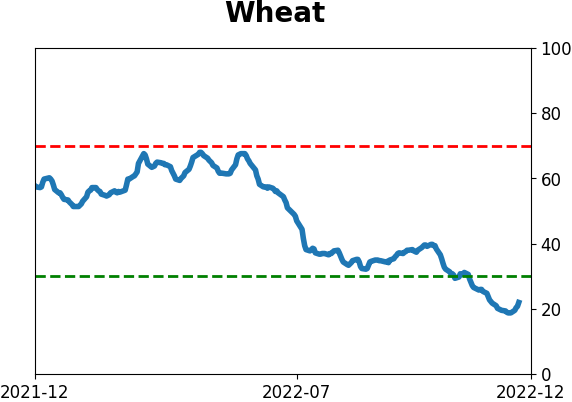
Agriculture
|
|
Research
By Jason Goepfert
BOTTOM LINE
There has been a substantial recovery in long-term uptrends among gold mining stocks. When there is a bust like October followed by a recovery like we've seen, how investors react over the next 8 weeks should have an outsized impact on long-term returns.
FORECAST / TIMEFRAME
None
|
Key points:
- In October, almost all gold mining stocks were mired in long-term downtrends
- Recently, more than half of them have climbed back above their 200-day moving averages and held
- If the sector can add to gains over the next couple of months, it bodes well for their long-term returns
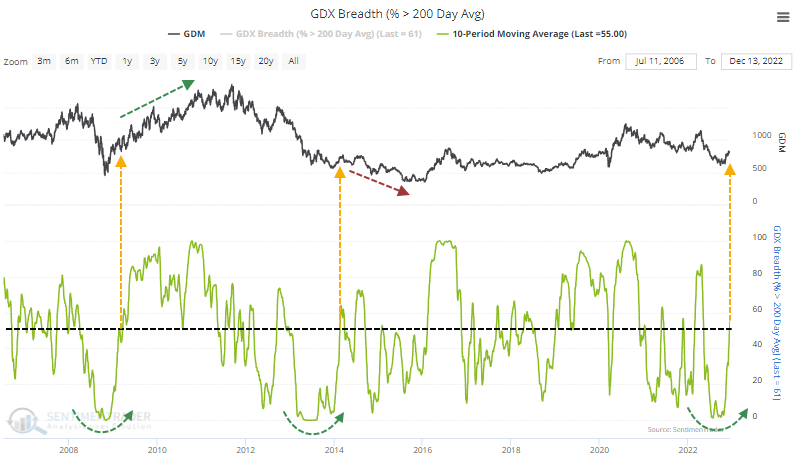
Gold mining stocks have enjoyed a recovery in long-term trends
The long-term trends of many gold mining stocks have improved to the point where more than half of them are regularly trading above their 200-day moving averages. This is a stark change from October, when virtually all mining stocks were below their long-term trendlines.
There have been two similar scenarios in recent decades. In 2009, it equated with the end of the bear market. In 2014, miners took another hard leg down before bottoming. Not much help there.
Gold mining stocks tend to have a fervent base of investors. Partly, it's due to a faith-based investment philosophy rather than any historical evidence that the companies are good at generating consistent profits or cash flows. Outside of a couple of boom periods, rallies in miners have tended to be quickly followed by negative returns.
The table below shows every time in the past 40 years when the percentage of mining stocks trading above their 200-day average cycled from below 15% to above 50%. To weed out some of the most volatile periods, we use a 10-day average of the indicator.
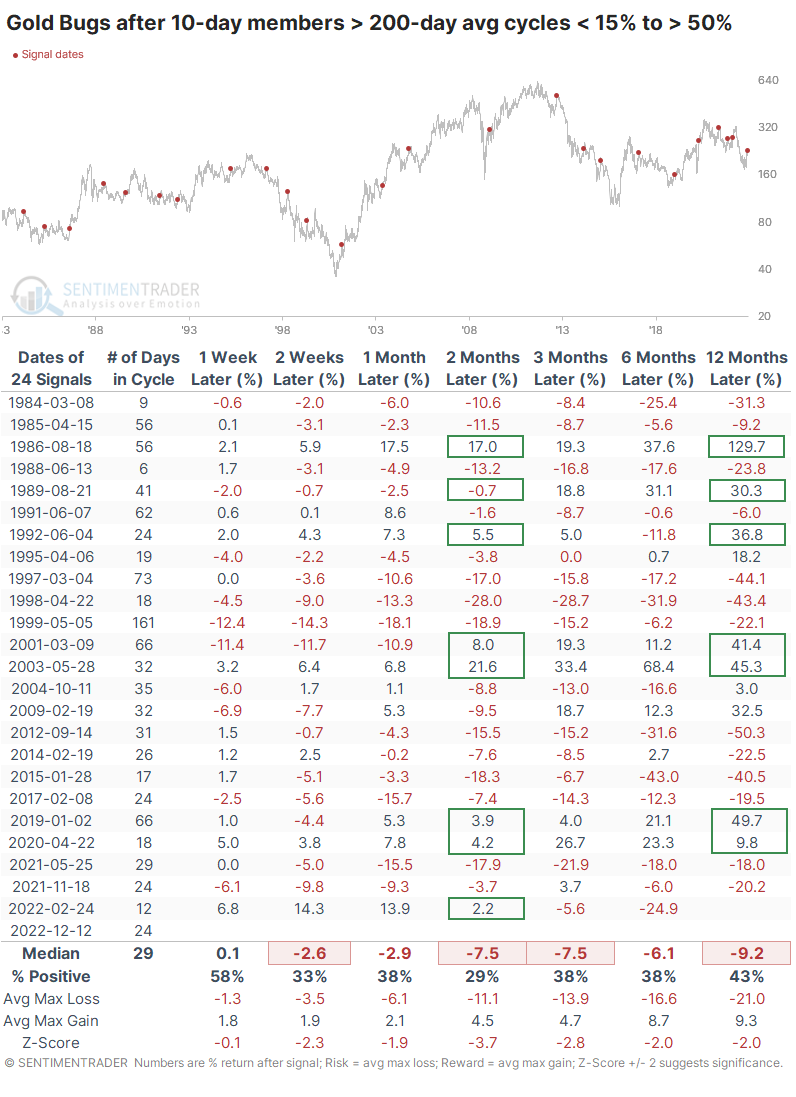
Over the next two months, the HUI Gold Bugs Index tacked on further gains only 29% of the time. Across all time frames from two weeks and beyond, the risk/reward was horrid.
A curious wrinkle is the relationship between miners' returns over the next two months and the next twelve. If they showed a positive, or very slightly negative, return over the next couple of months, they invariably showed positive returns over the next year. Part of that is tautological since a positive two-month return automatically helps to generate a positive twelve-month return. But in every case, the returns increased, usually substantially.
Notably, the last signal from February of this year shows a positive two-month return, but miners turned down immediately afterward and showed a terrible six-month loss. That throws some cold water on the correlation.
What the research tells us...
Gold miners are a sector that investors either ignore or become passionate about. When the sector works, returns can be phenomenal. But those are the glaring exceptions. The last recovery signal in February has been a miserable failure, a red flag. As is the general tendency to see weak returns following a recovery in long-term trends like we've seen recently. But if the Gold Bugs index can hold investors' interest in the next couple of months, it would bode well for the stocks into the fall of 2023.
Indicators at Extremes
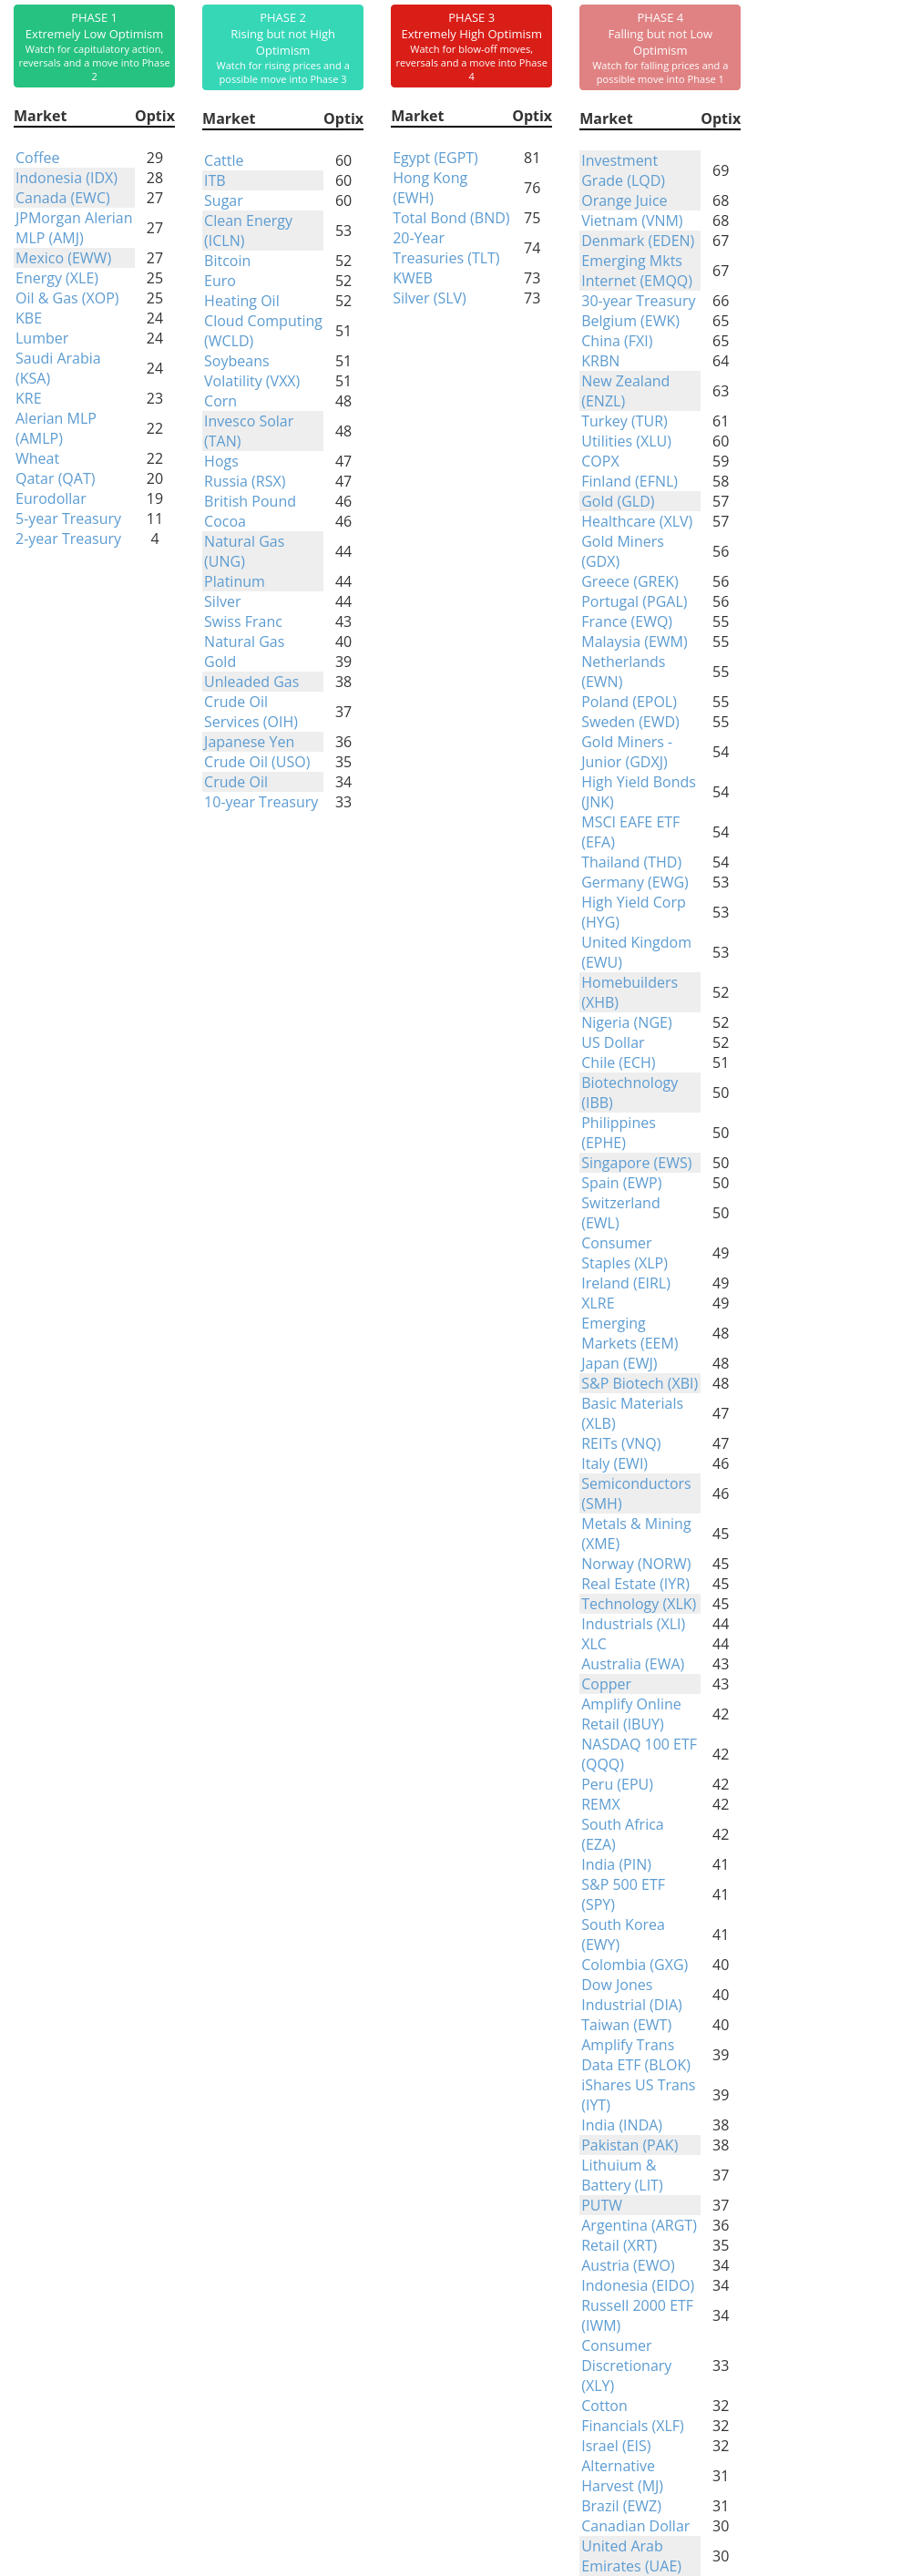
Phase Table
Ranks
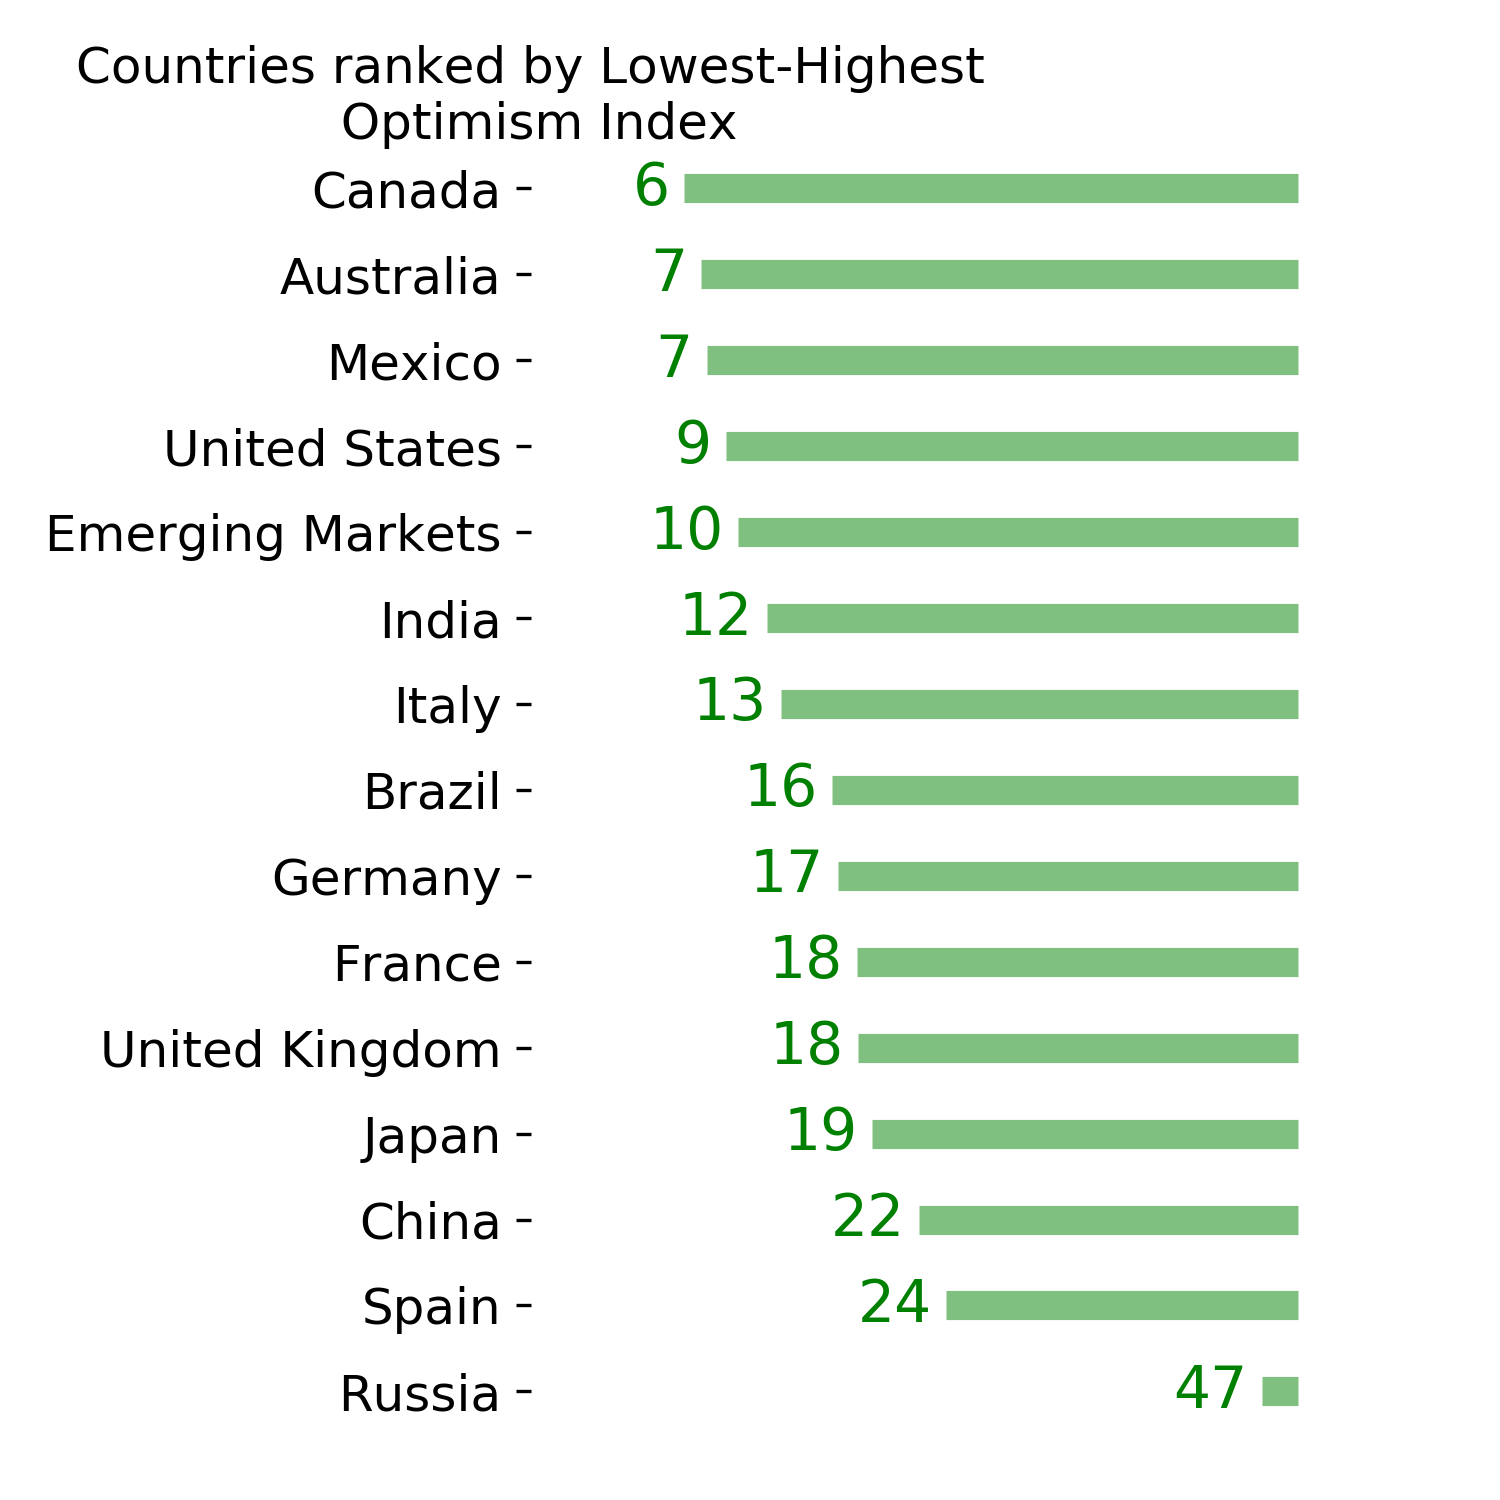
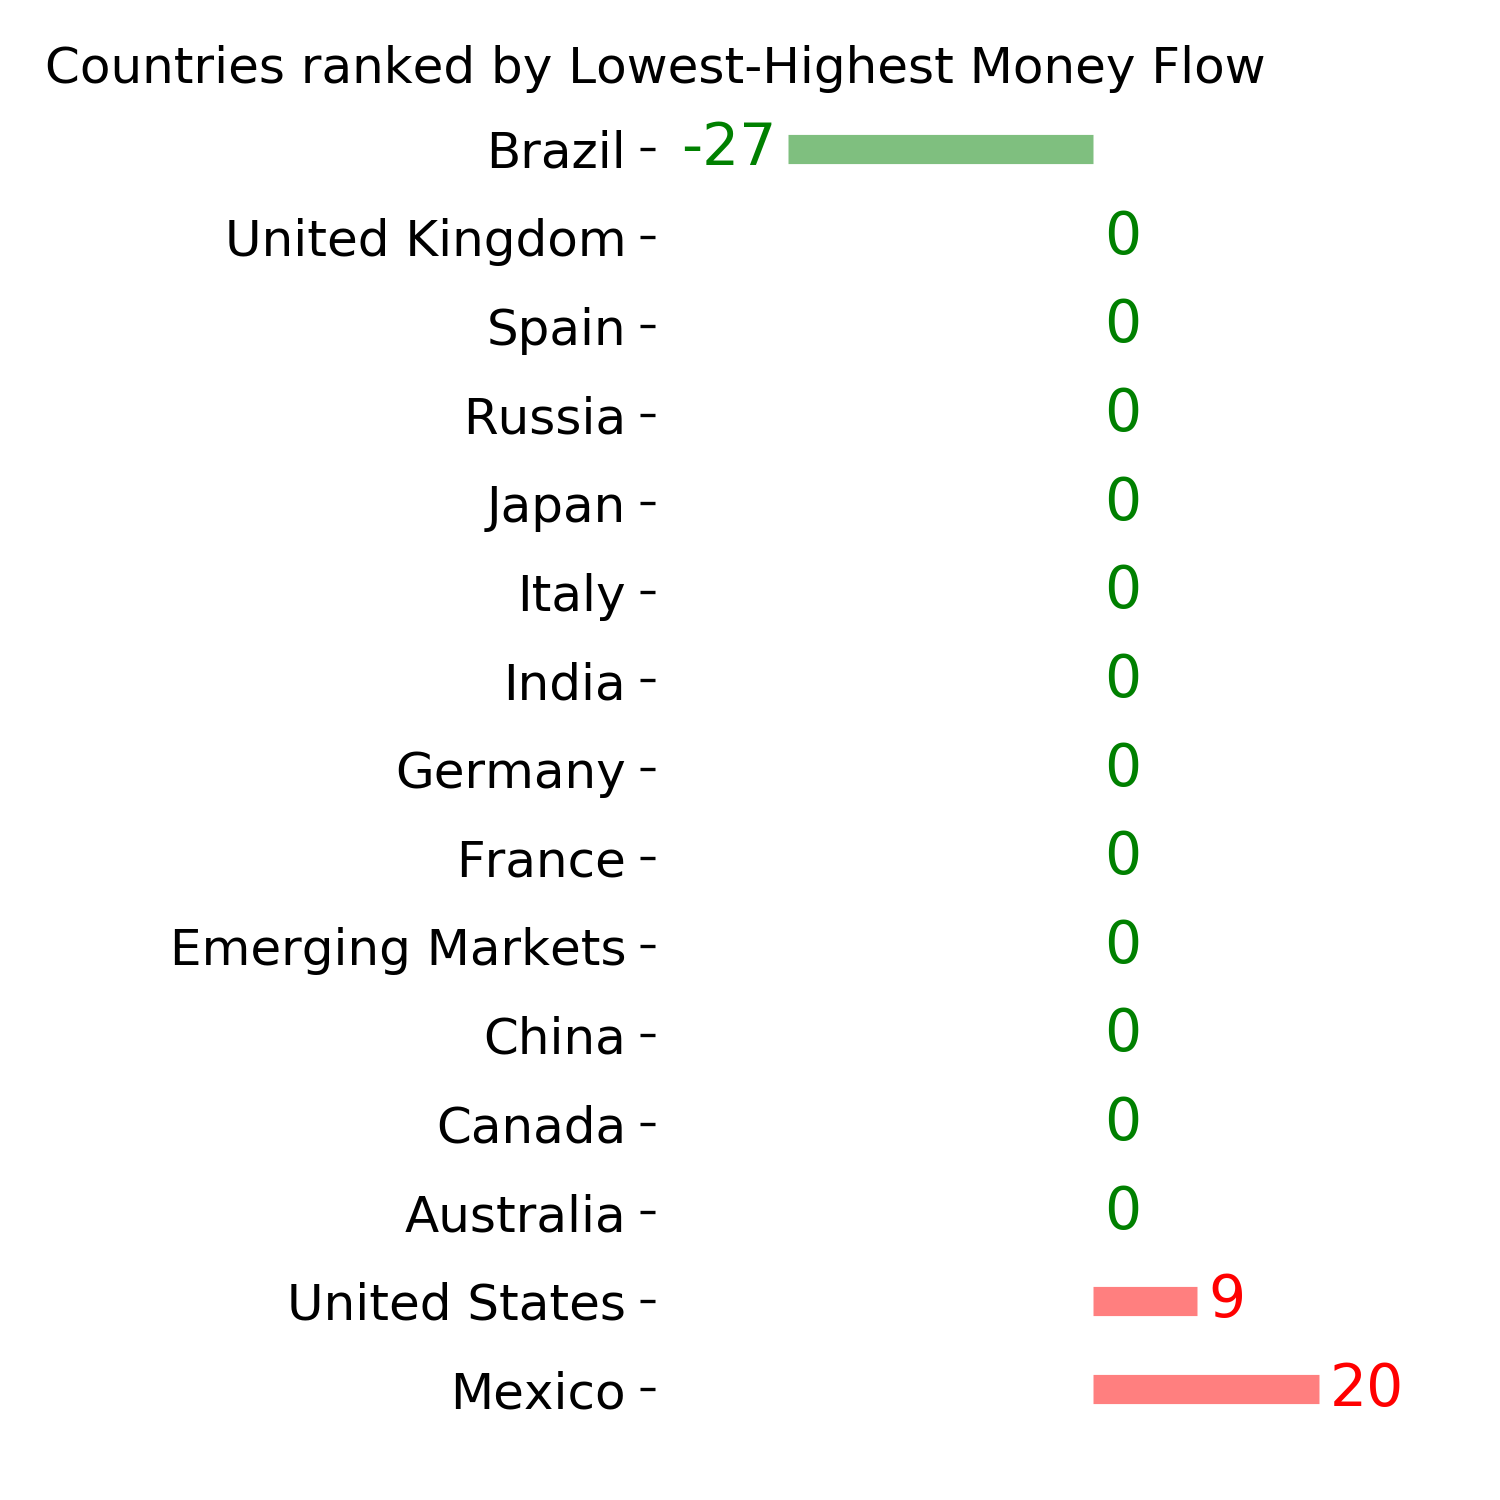
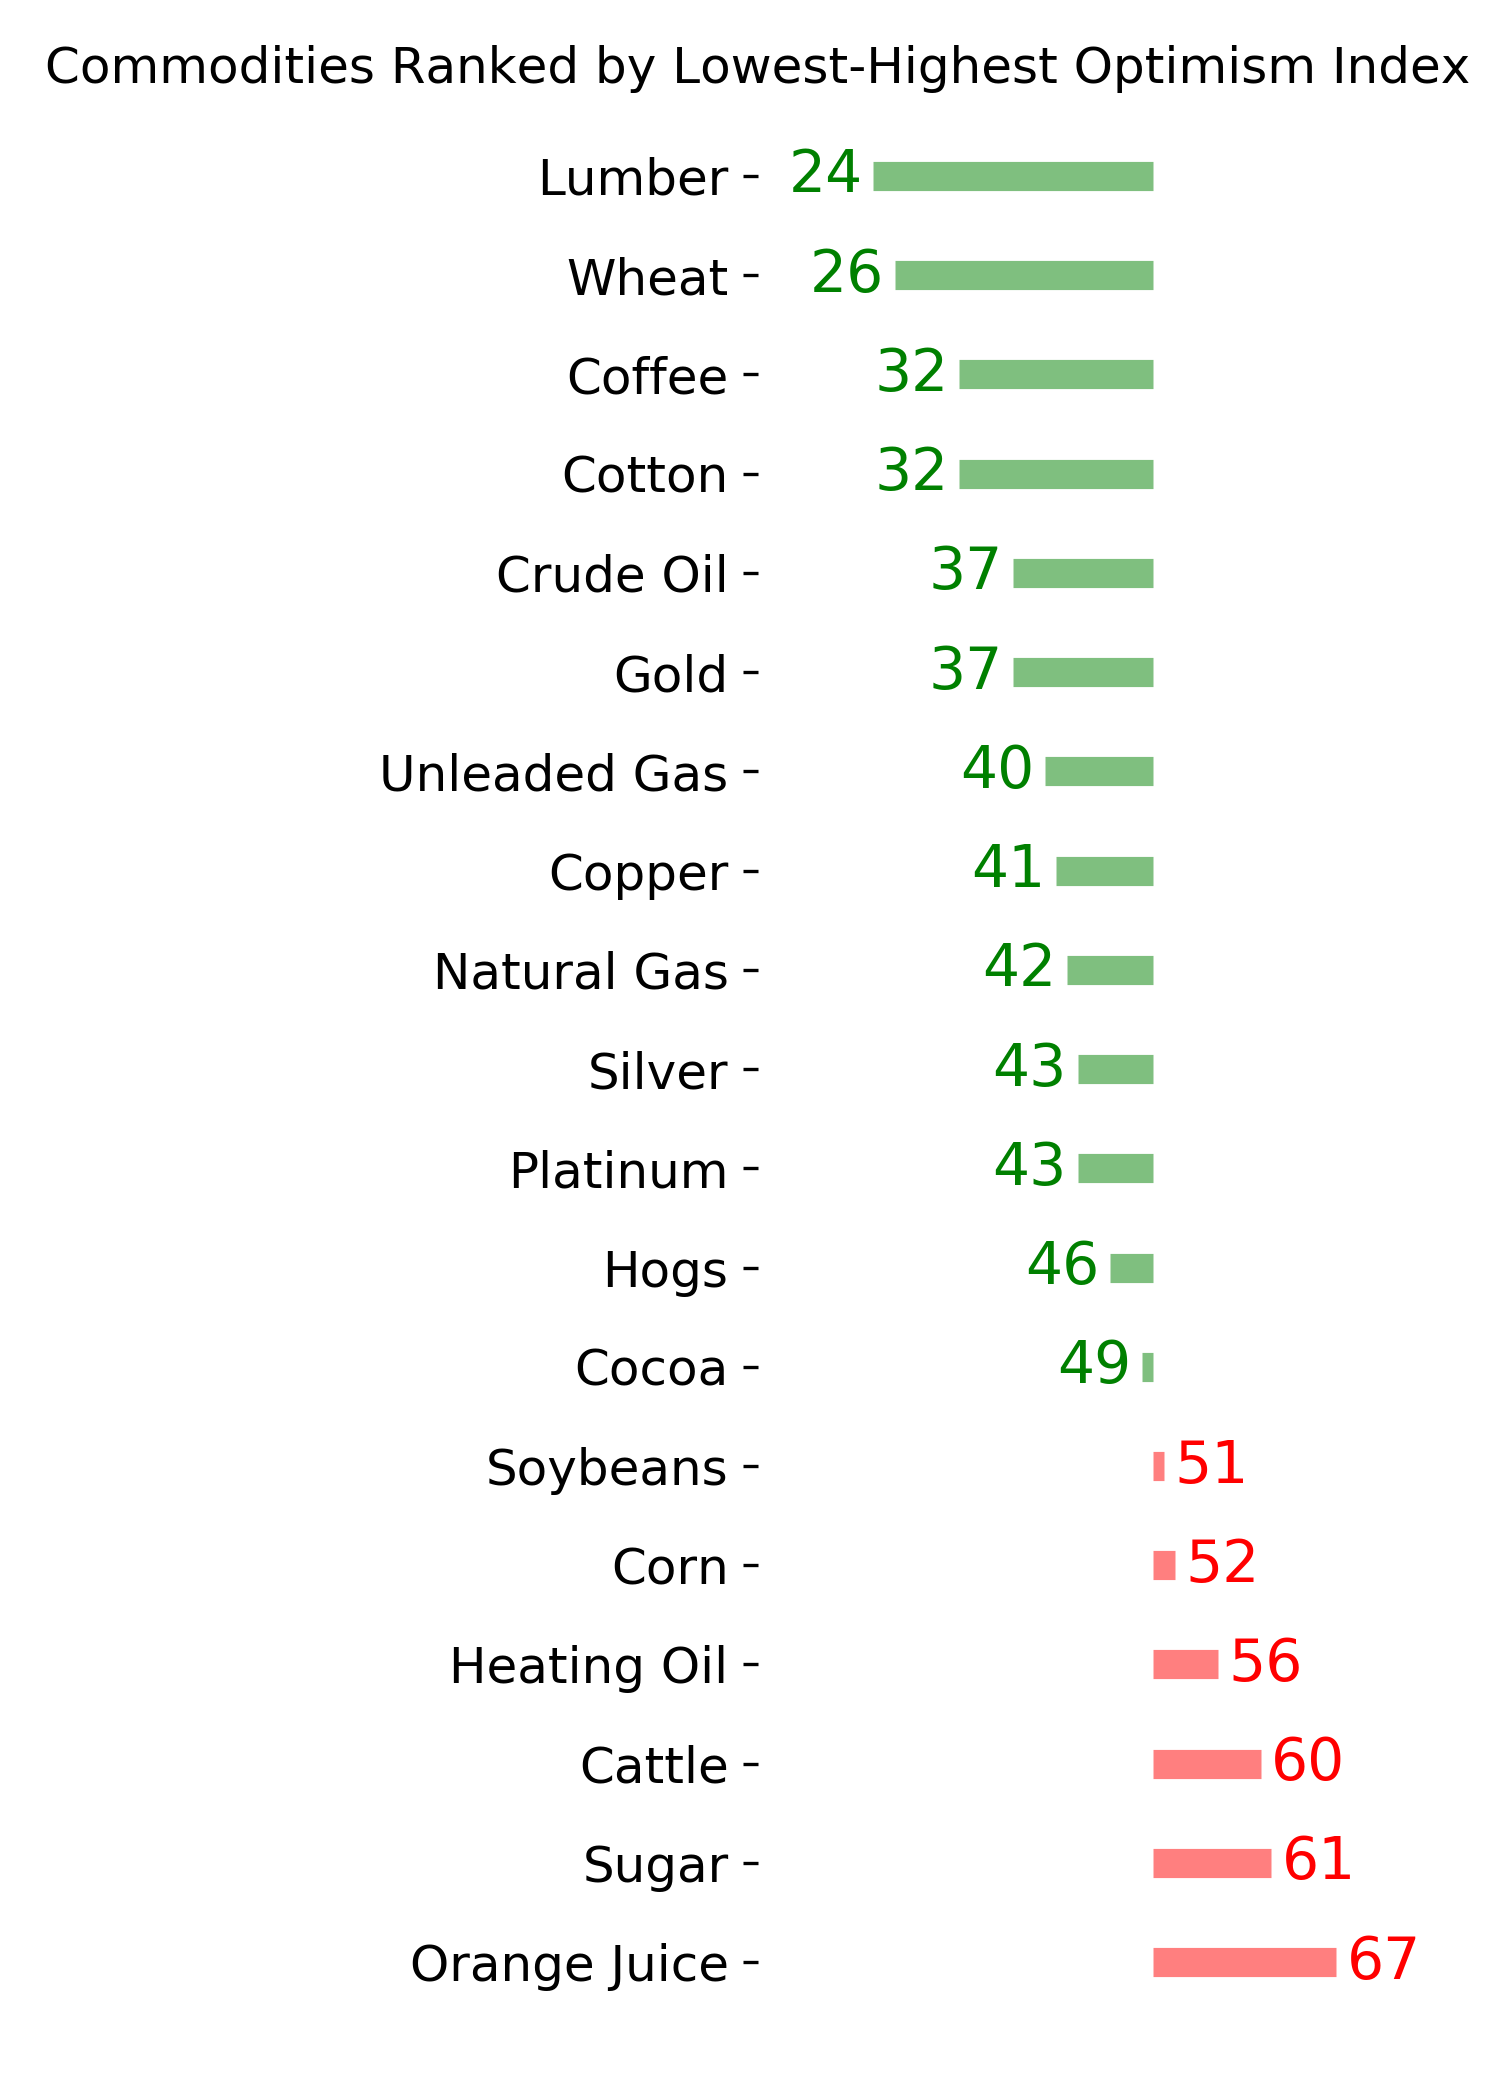
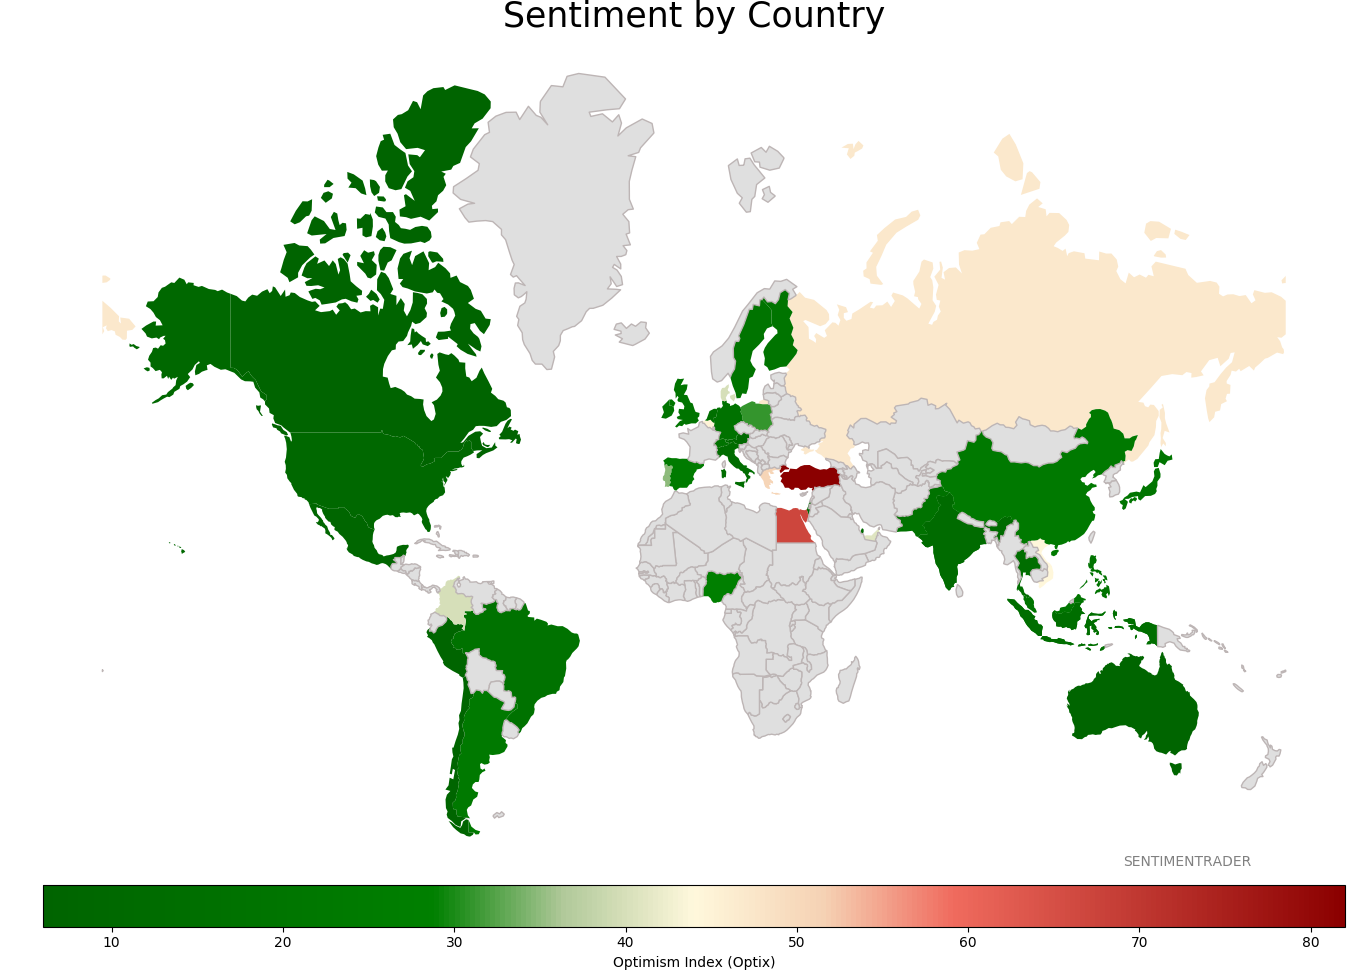
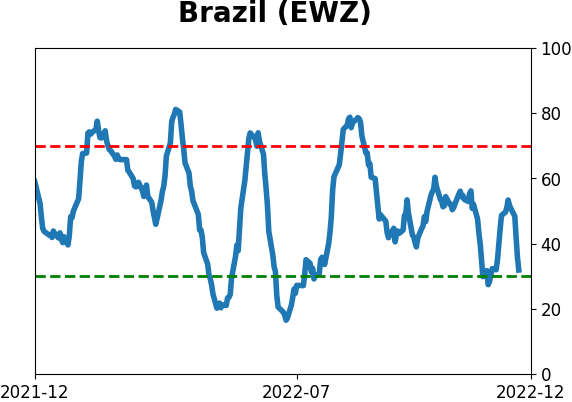
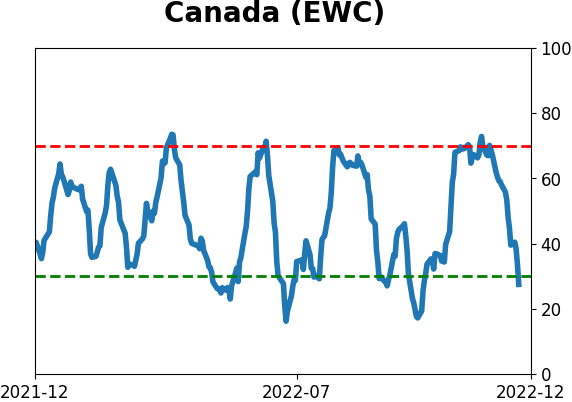
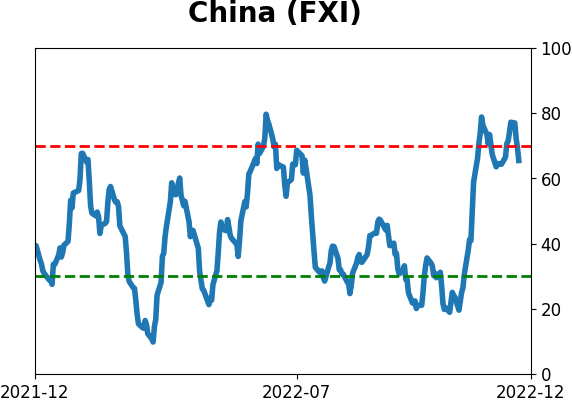
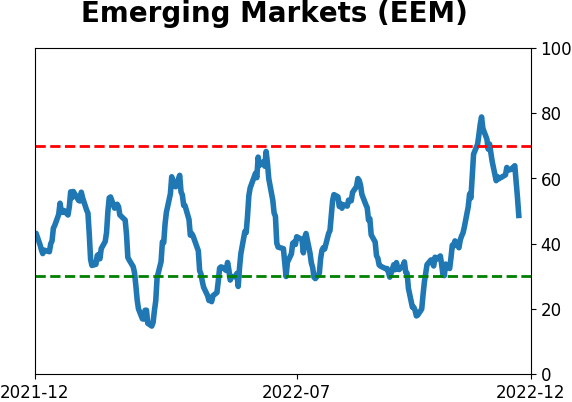
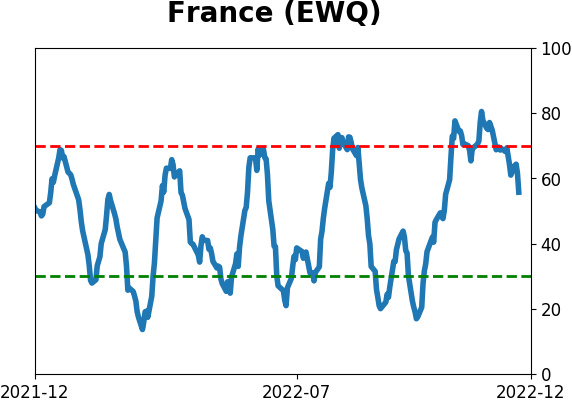
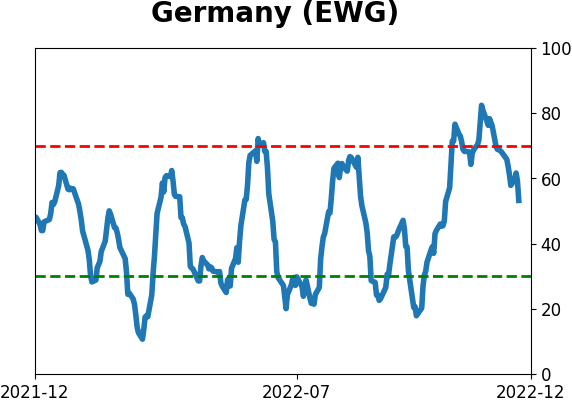
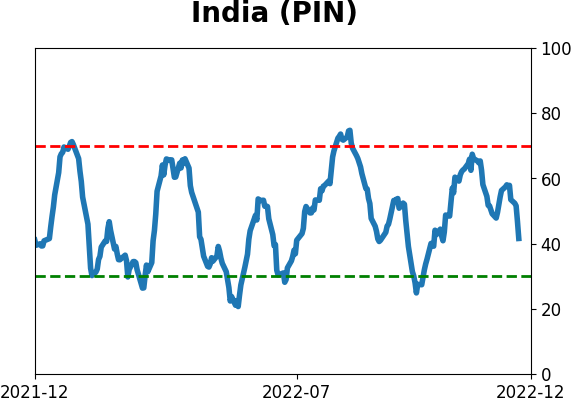
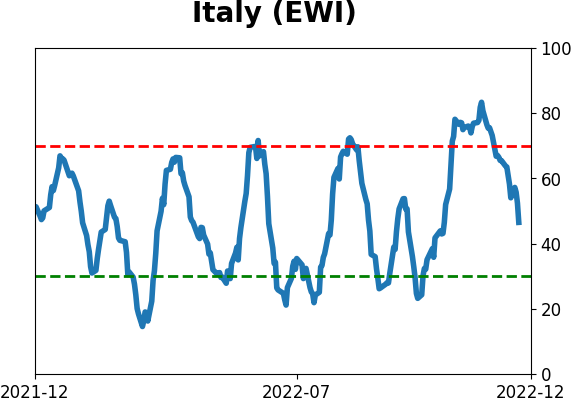
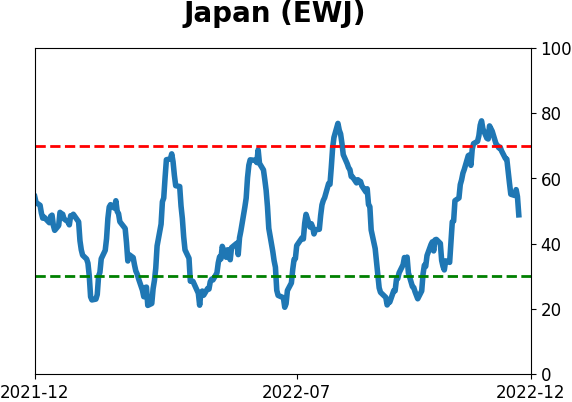
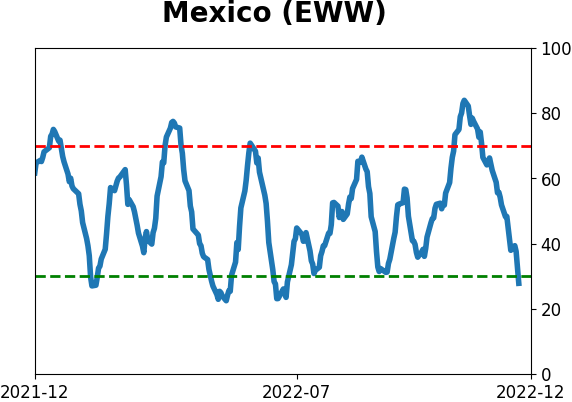
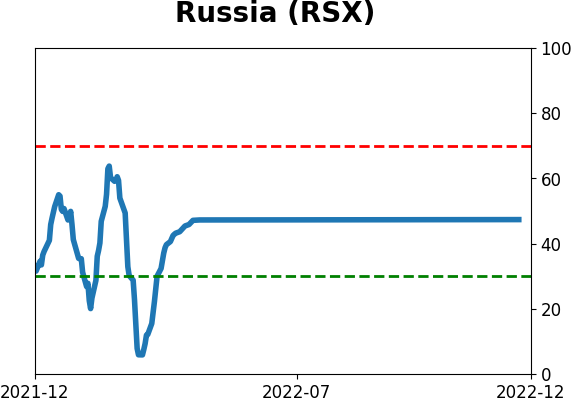
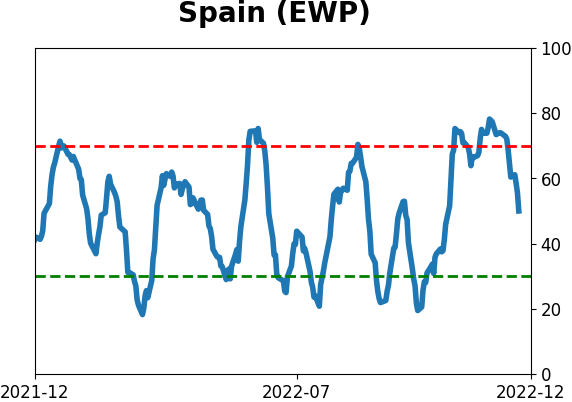
Sentiment Around The World
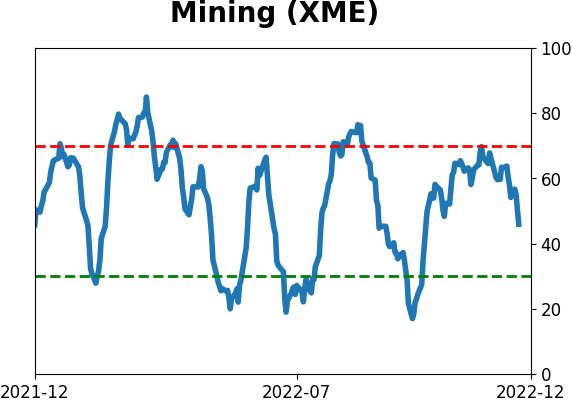
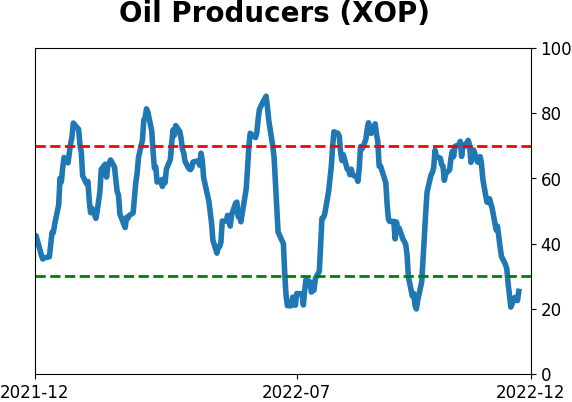
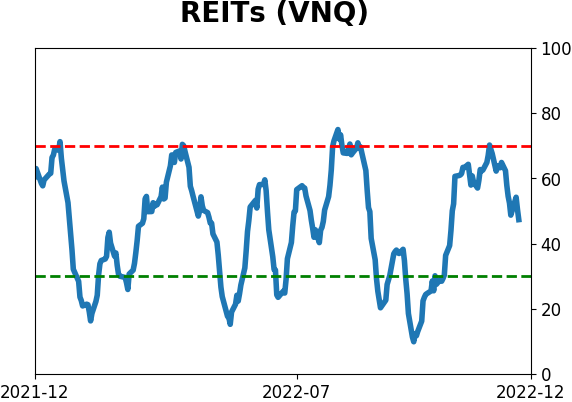
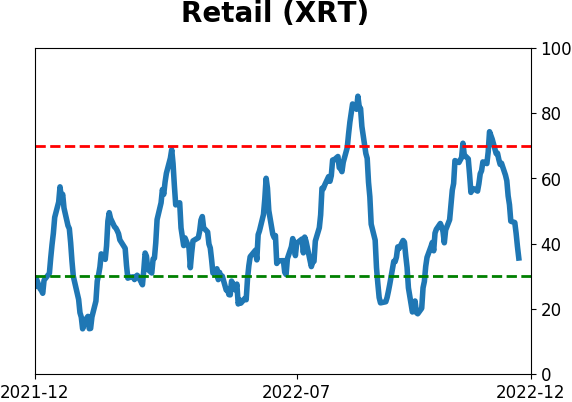
Optimism Index Thumbnails
|
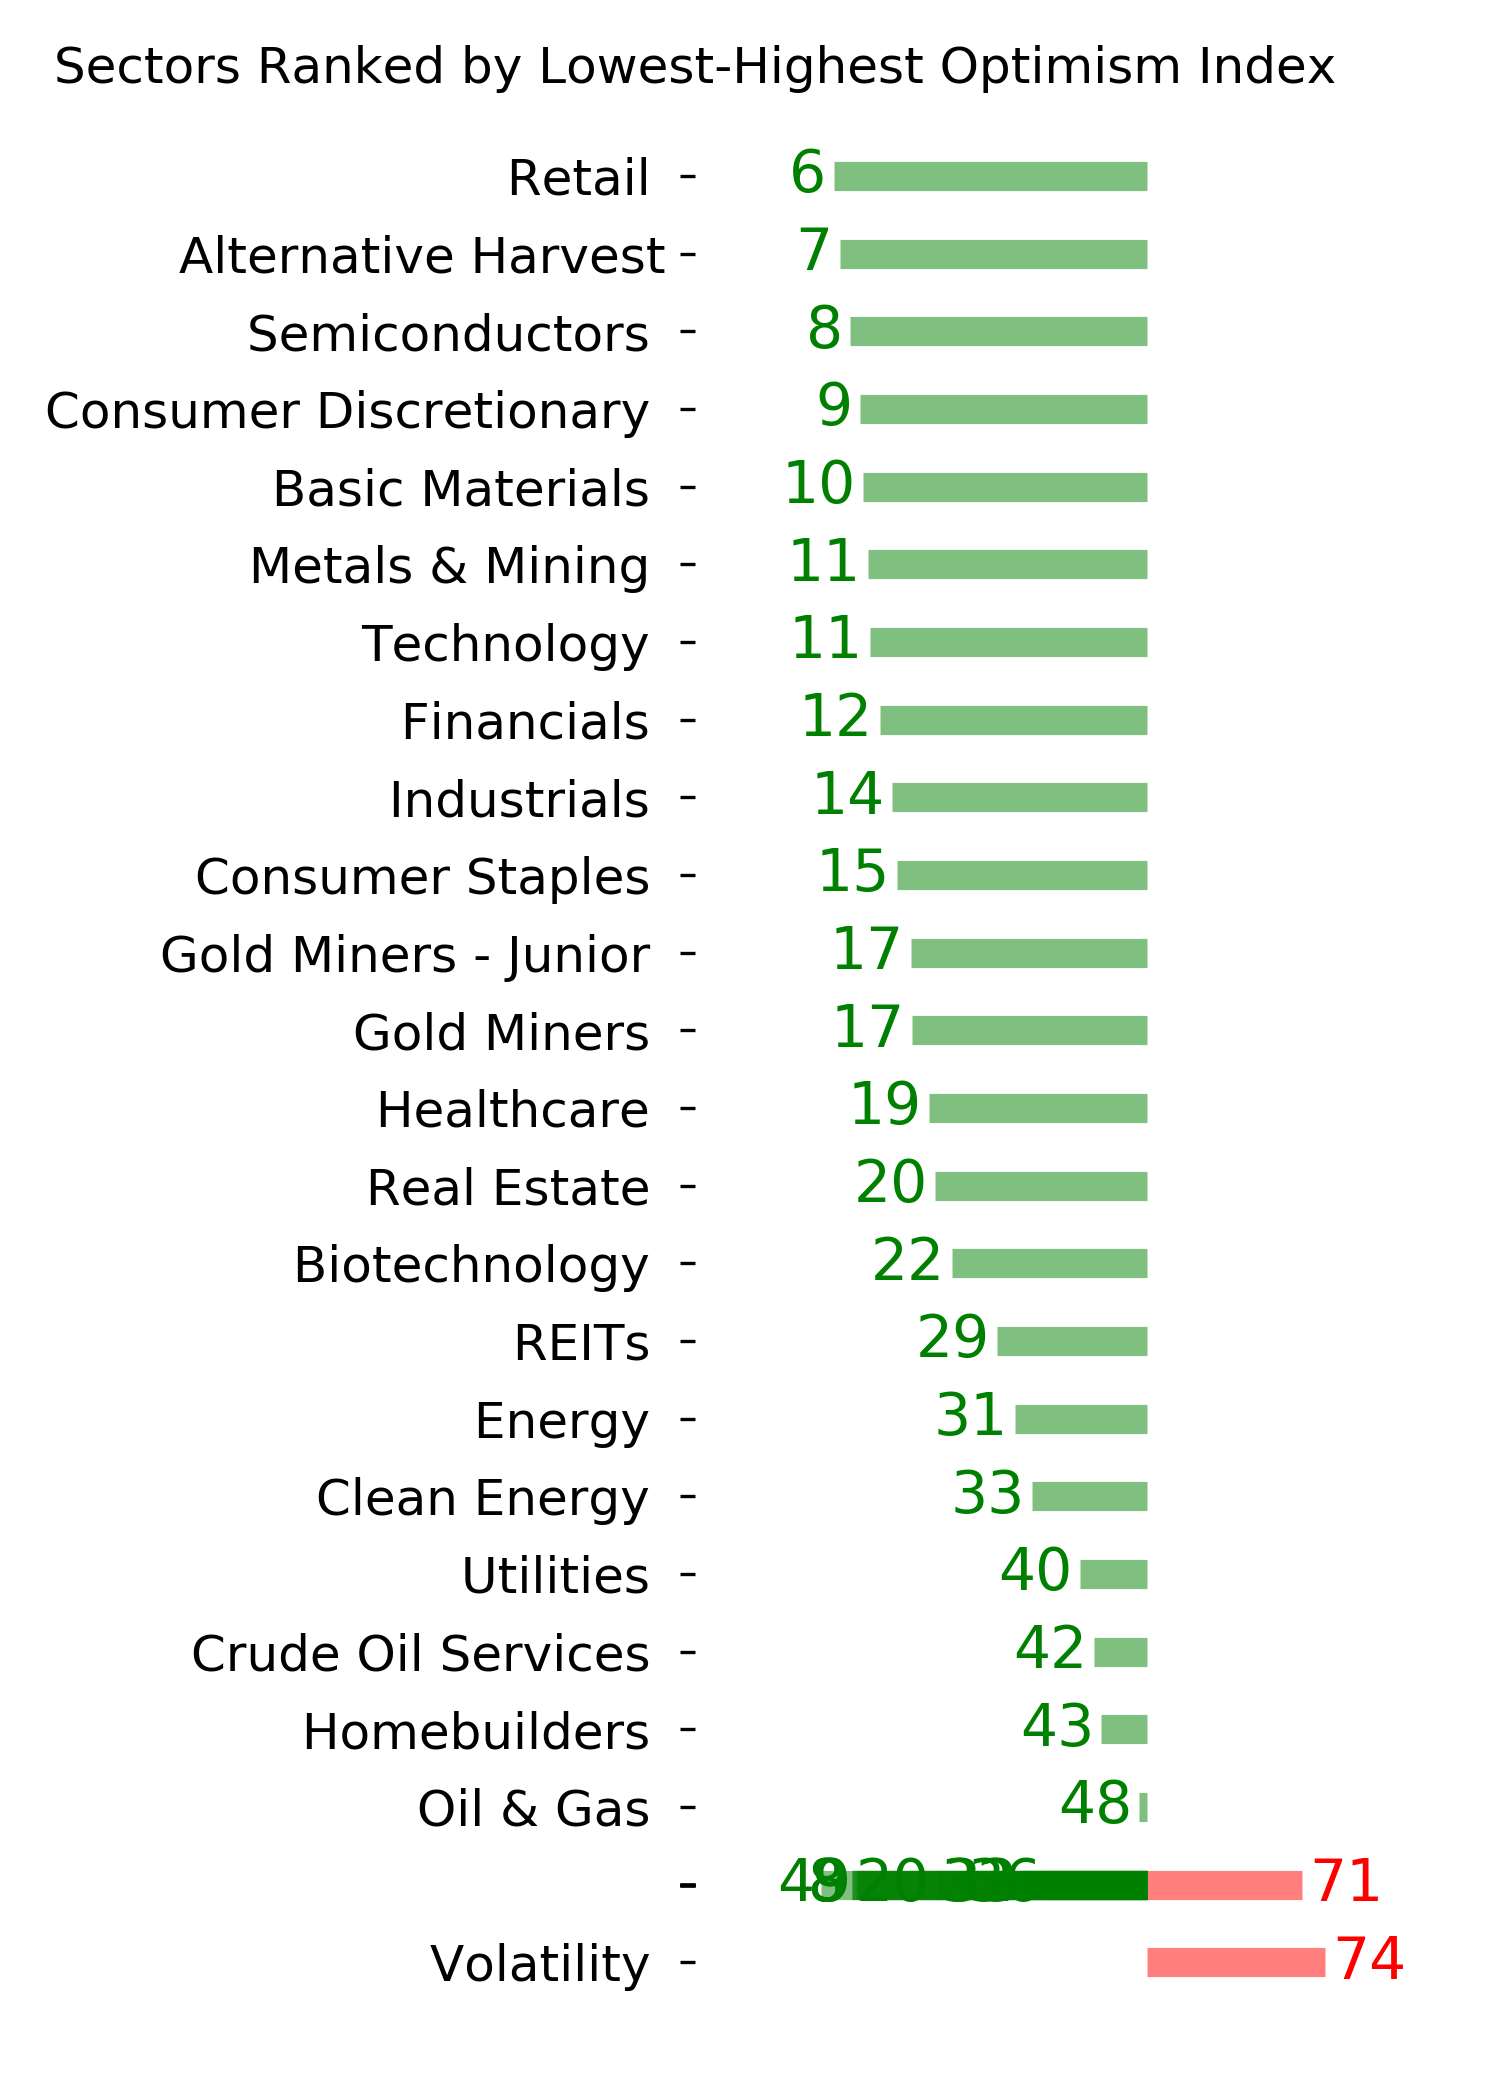
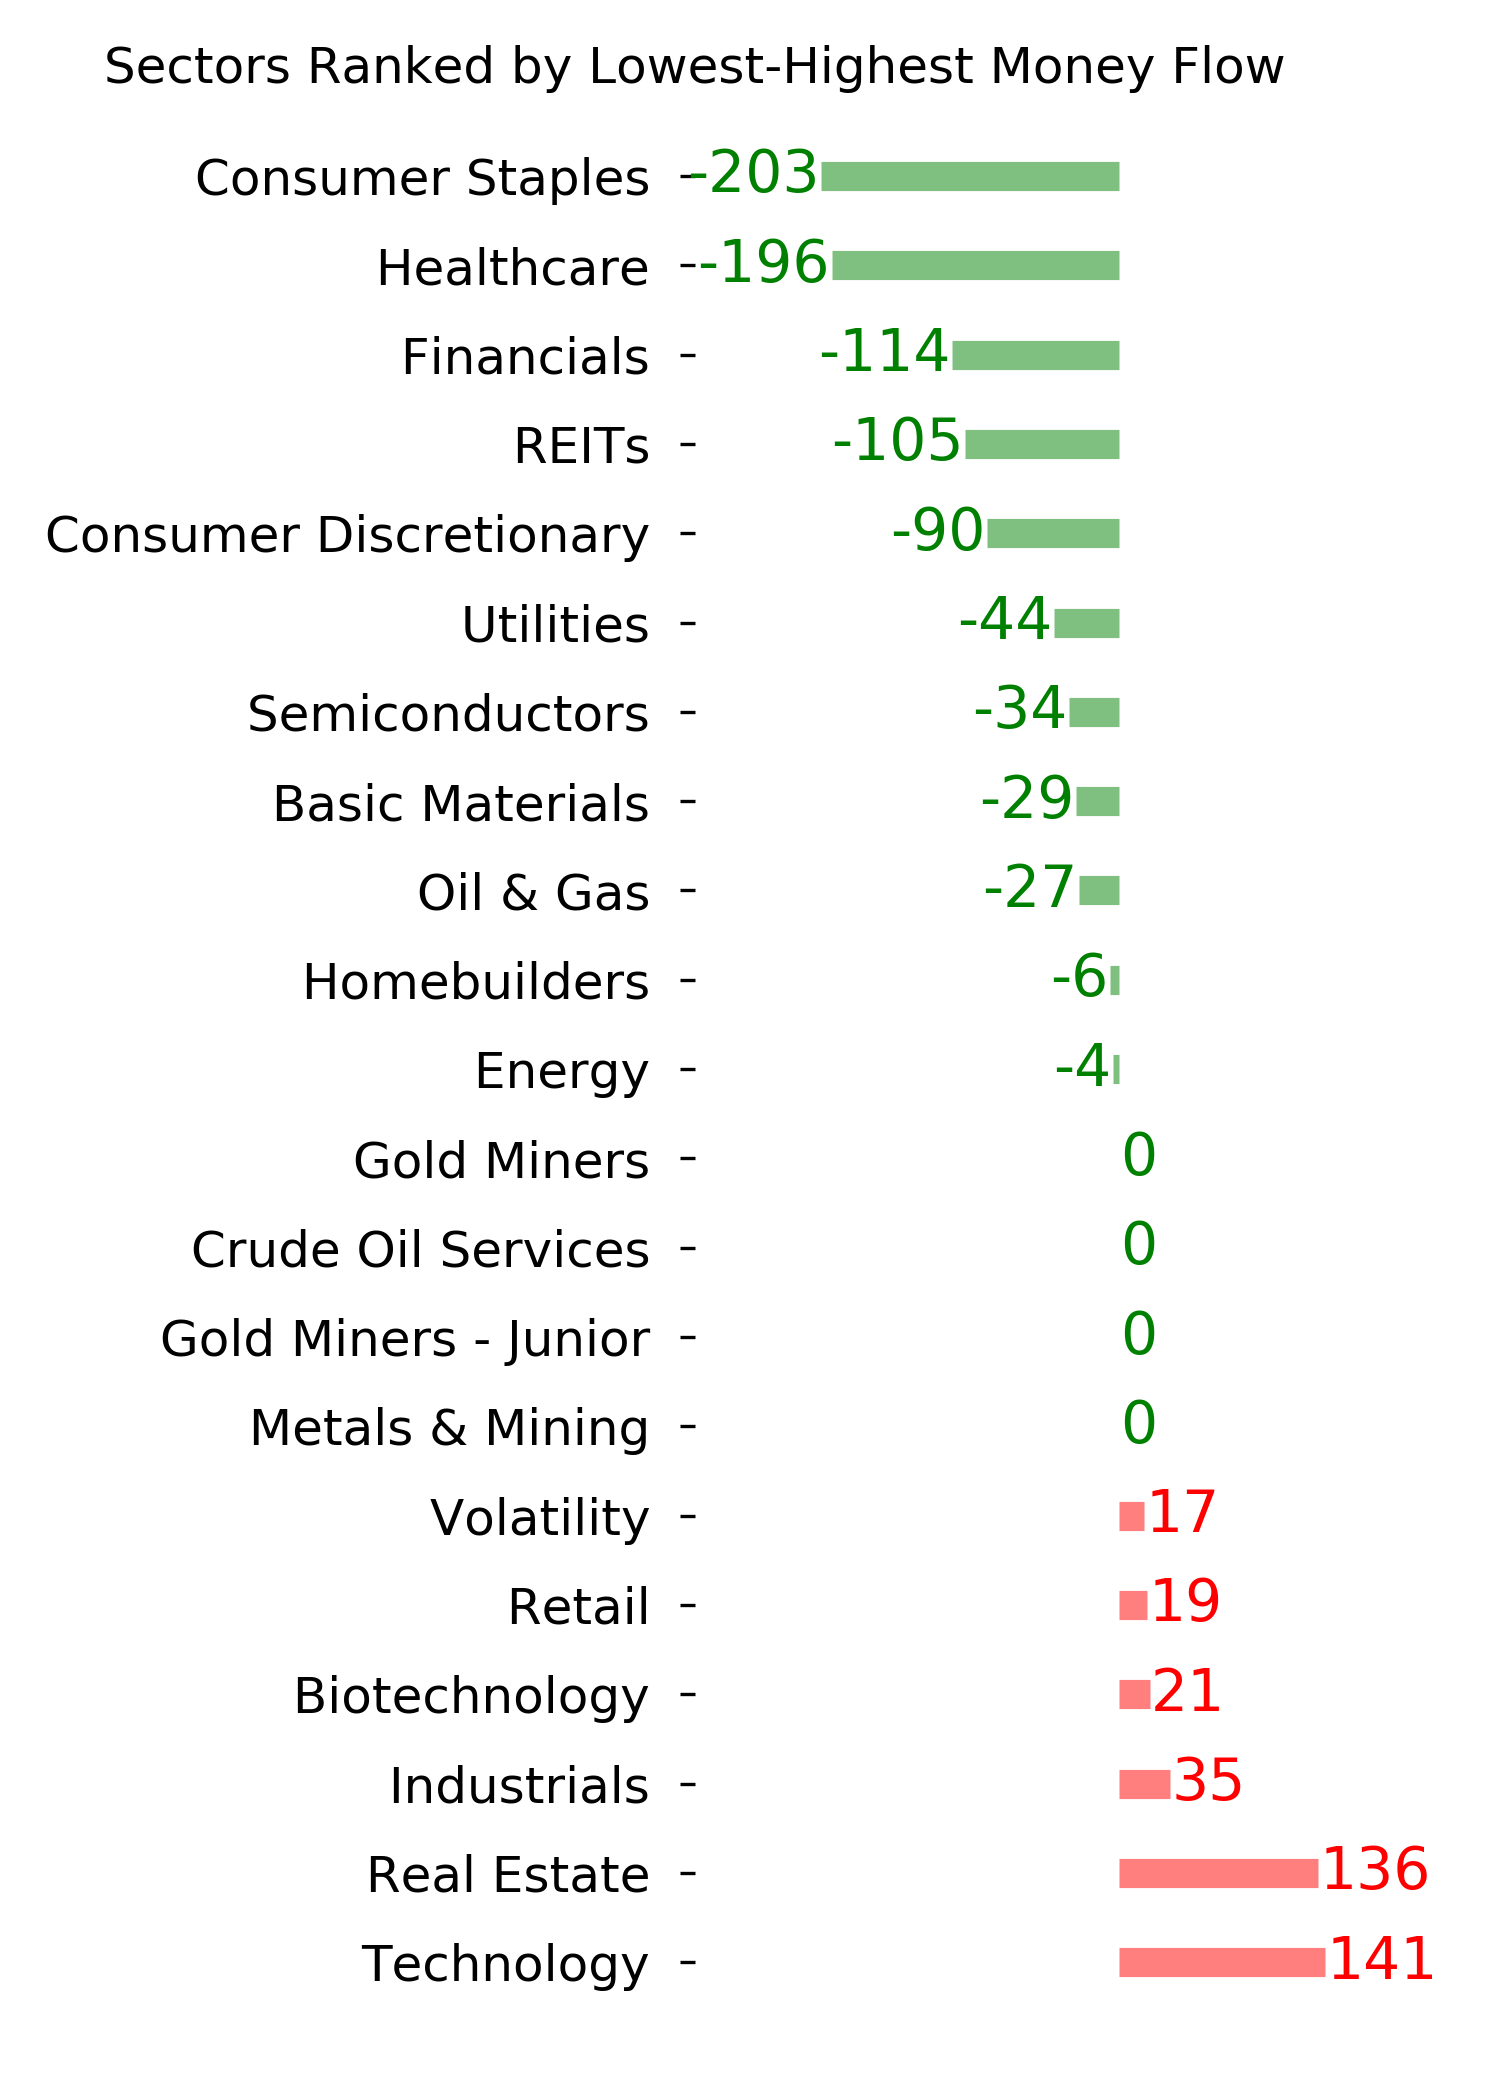
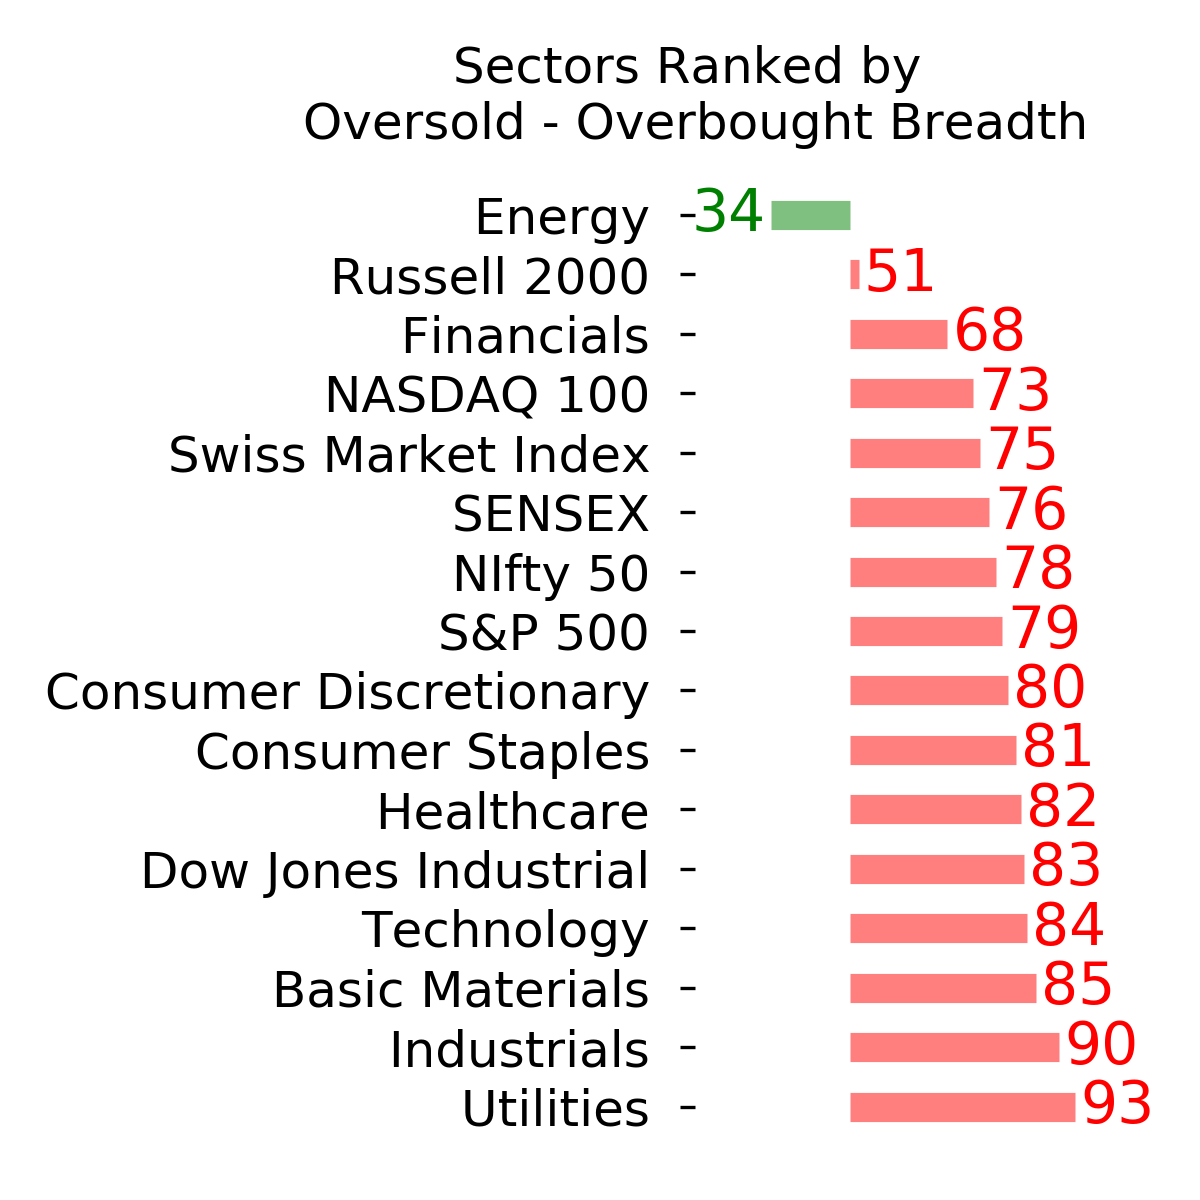
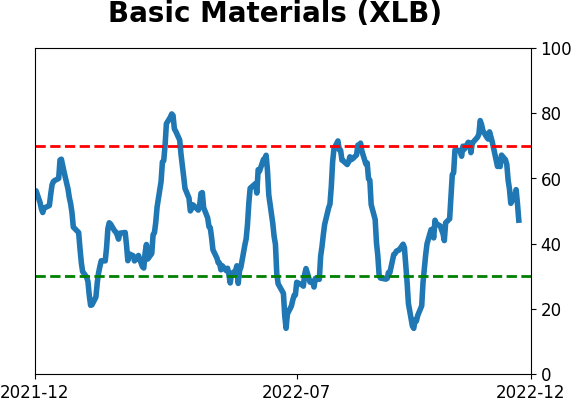
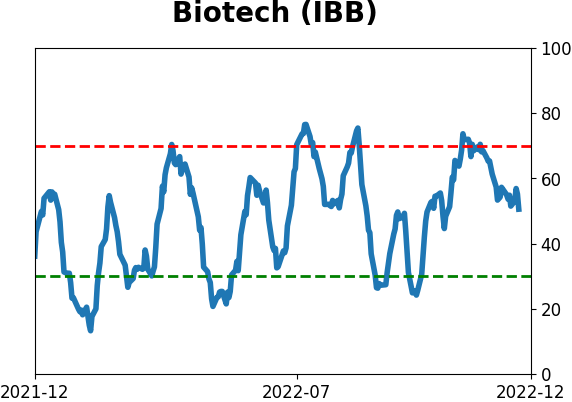
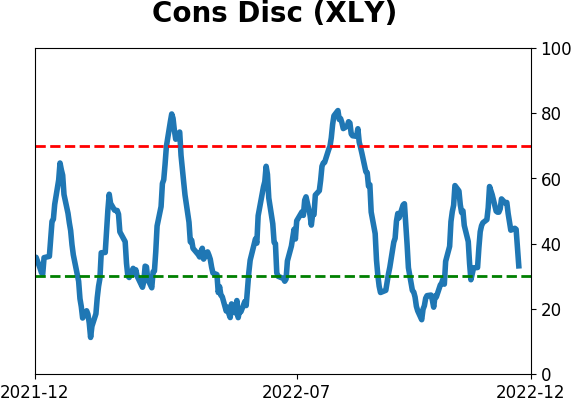
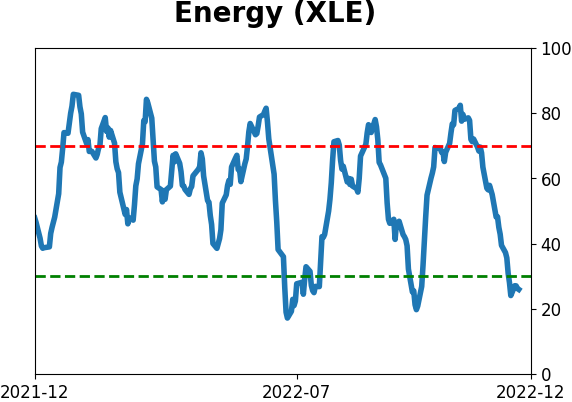
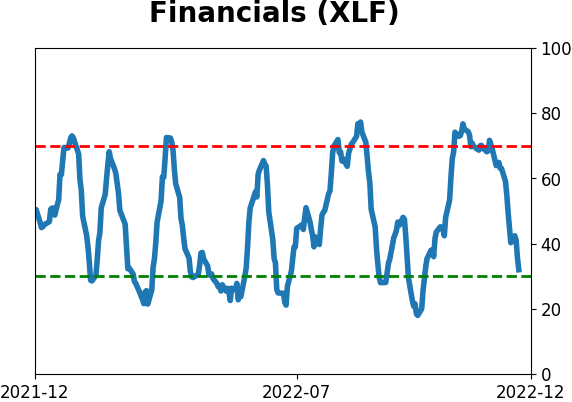
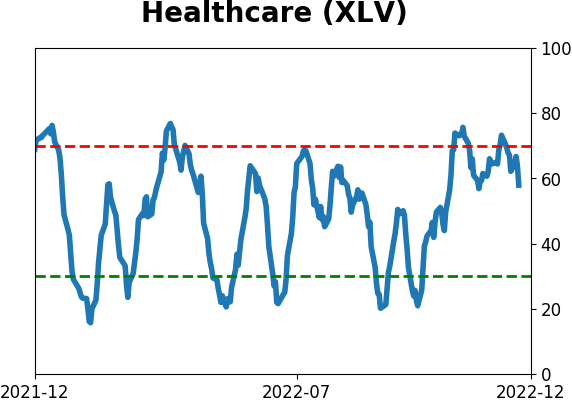
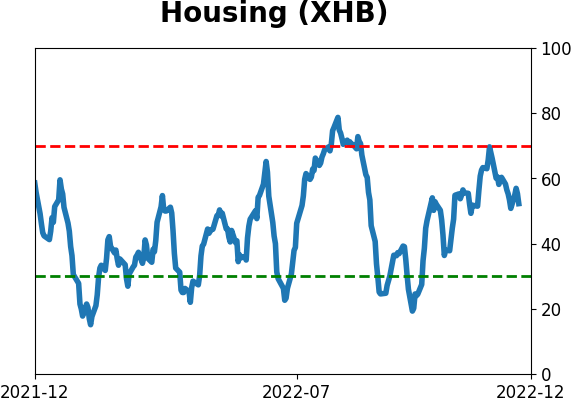
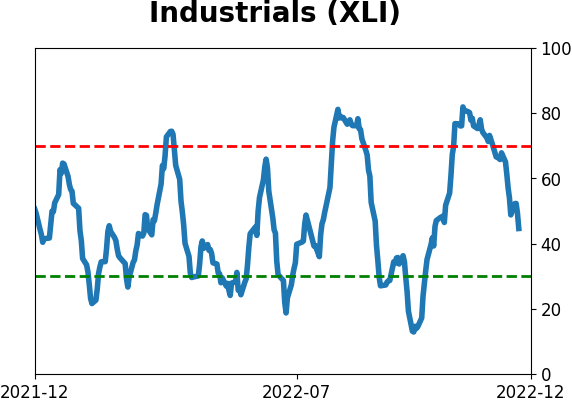
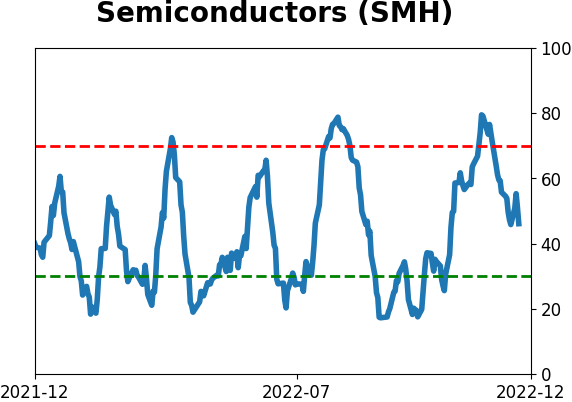
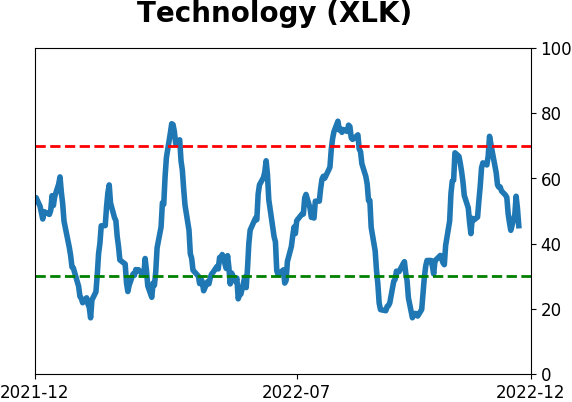
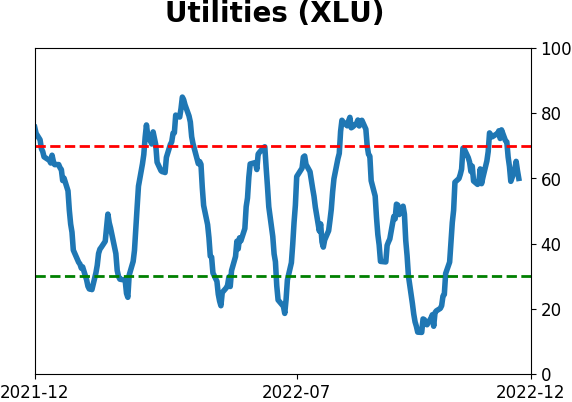
Sector ETF's - 10-Day Moving Average
|
|
|
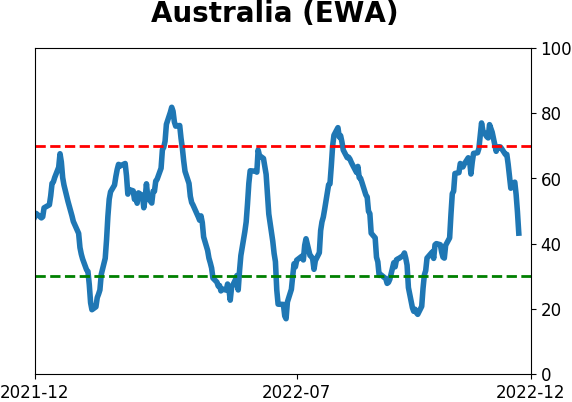
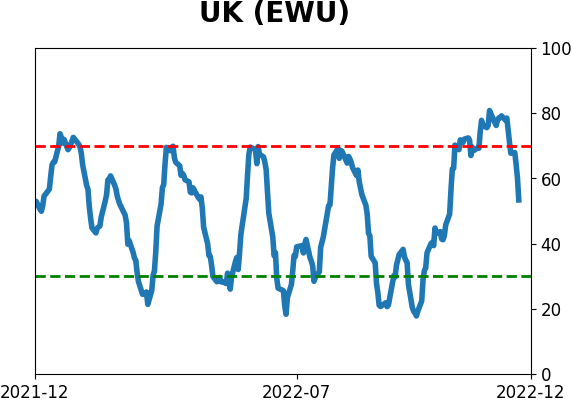
Country ETF's - 10-Day Moving Average
|
|
|
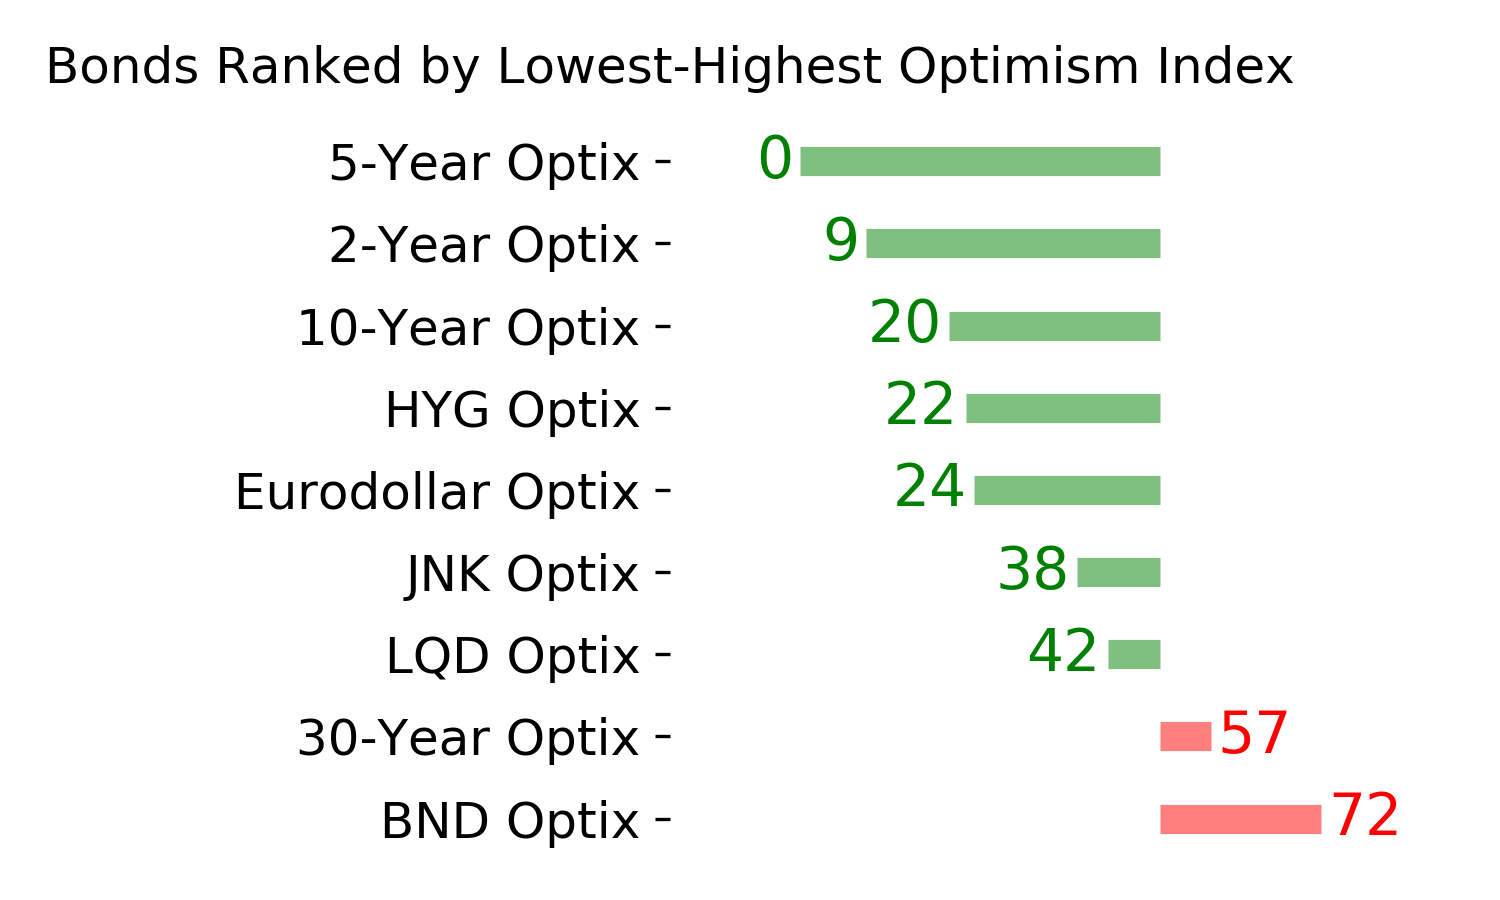
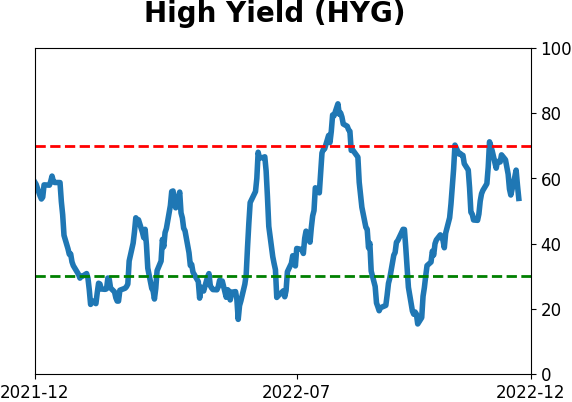
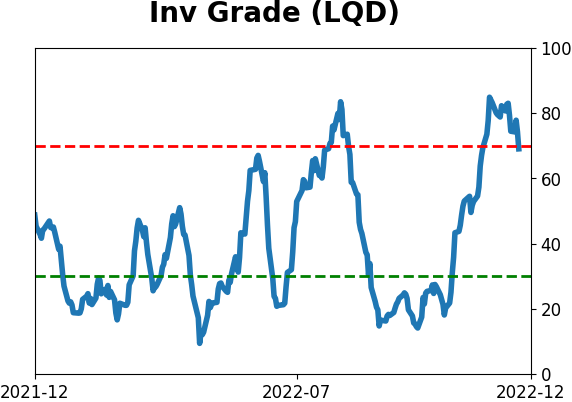
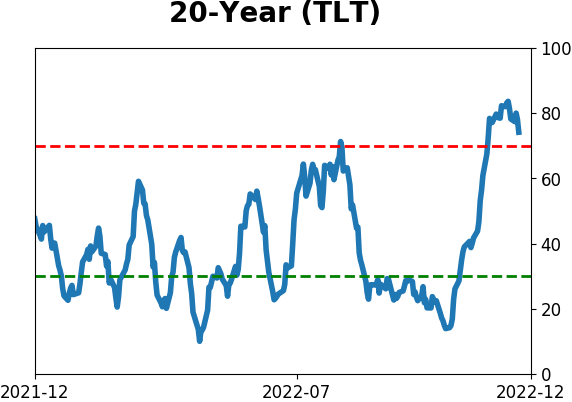
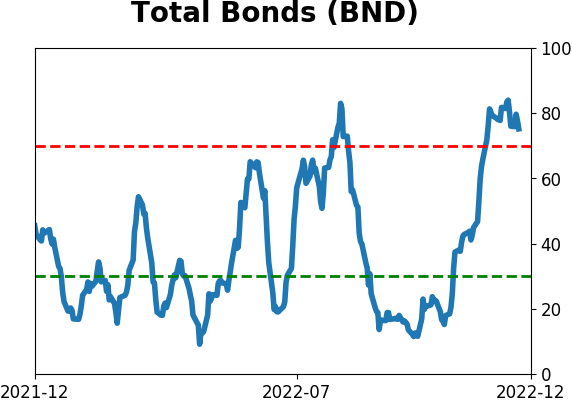
Bond ETF's - 10-Day Moving Average
|
|
|
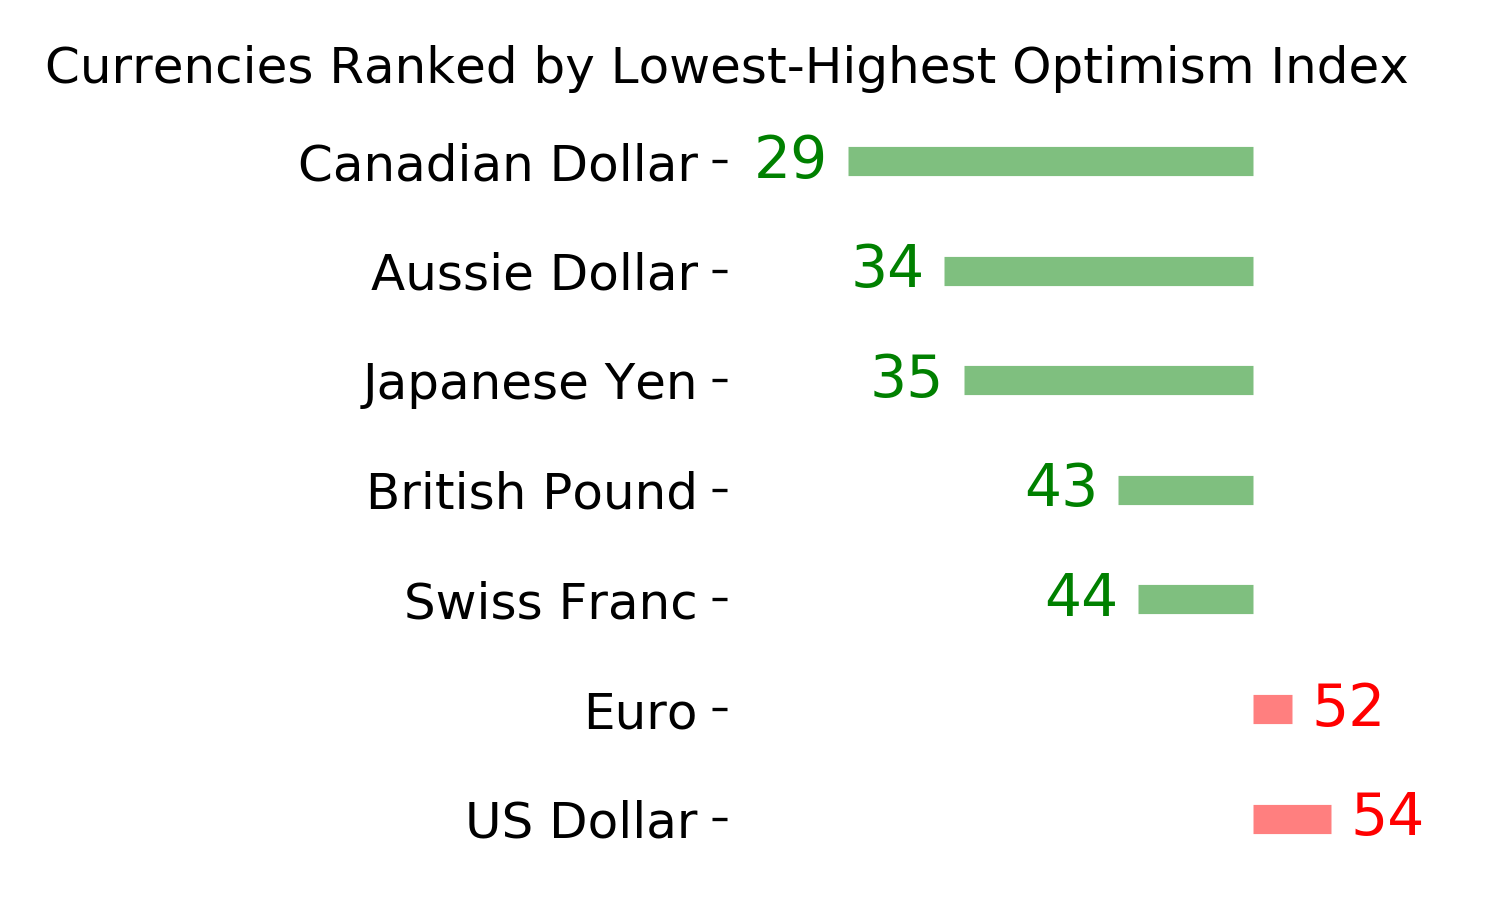
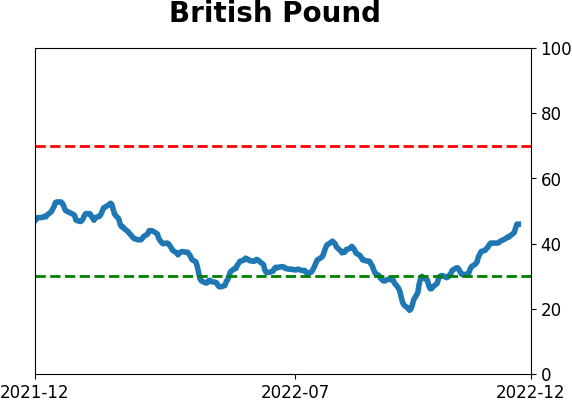
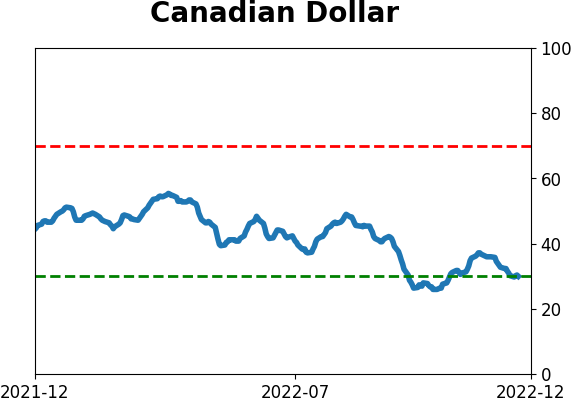
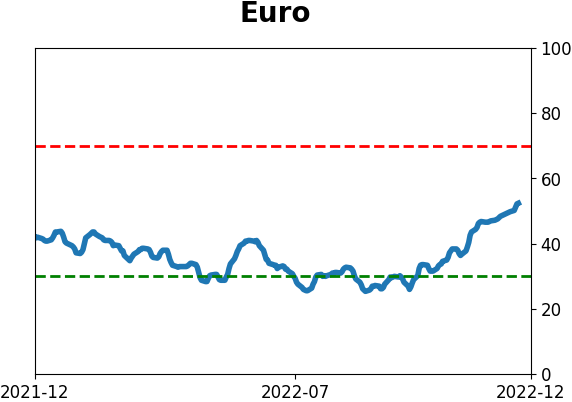
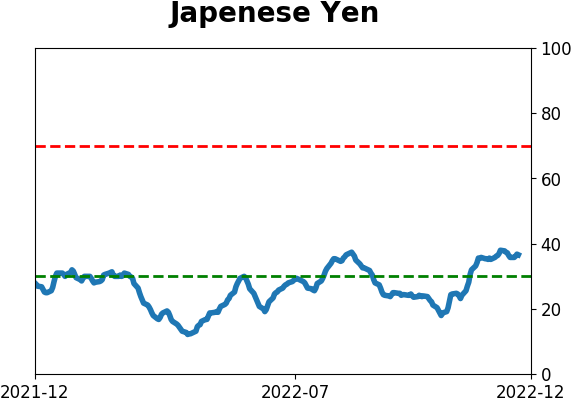
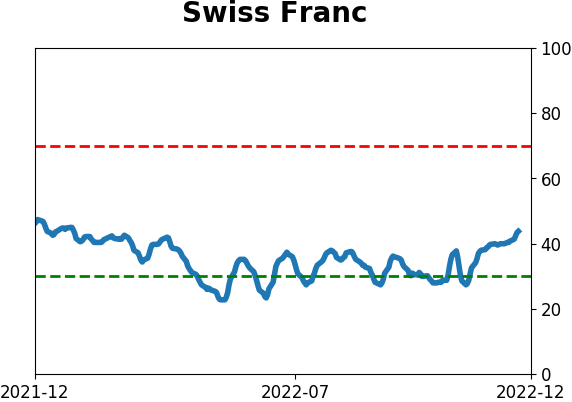
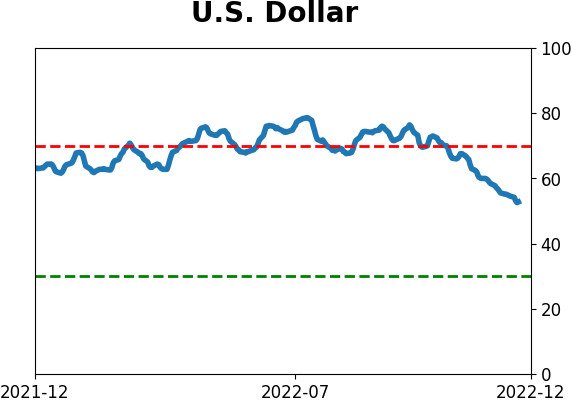
Currency ETF's - 5-Day Moving Average
|
|
|
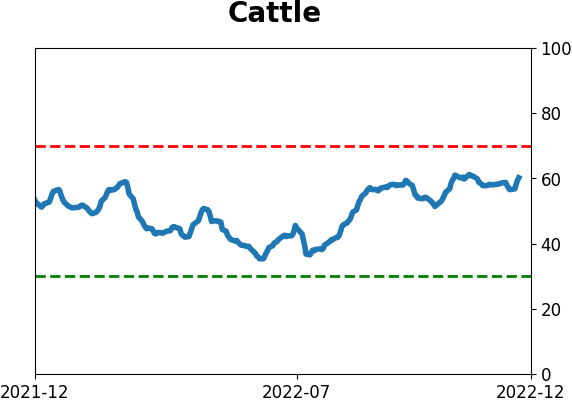
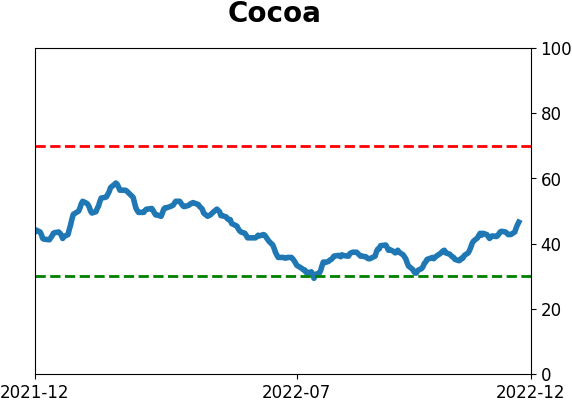
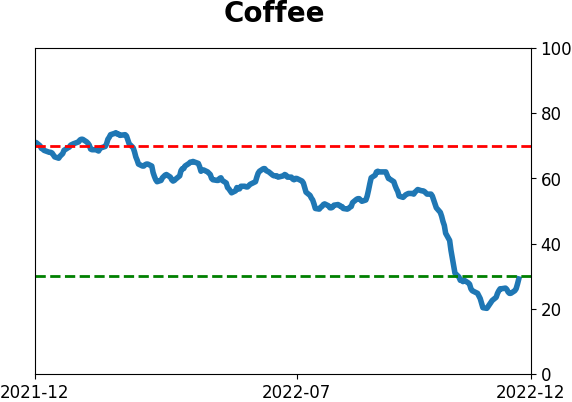
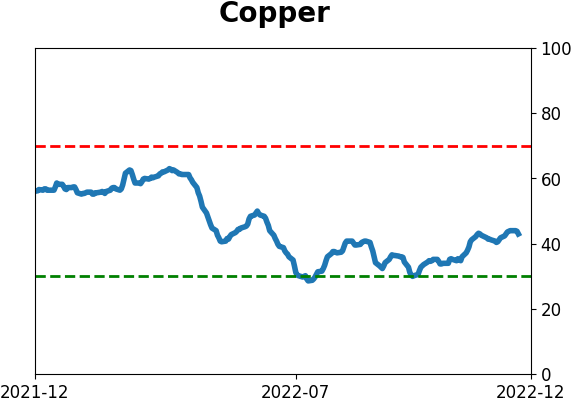
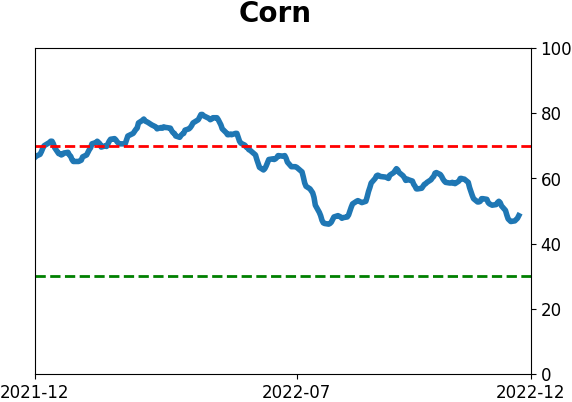
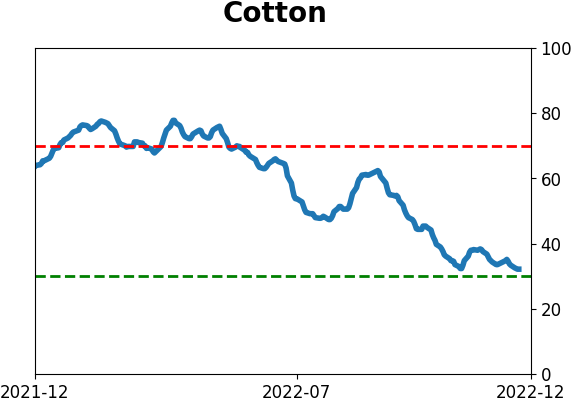
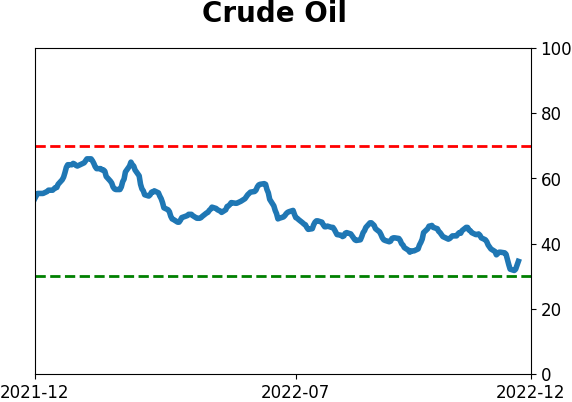
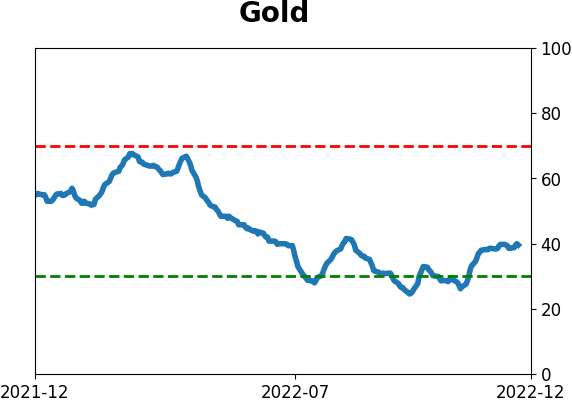
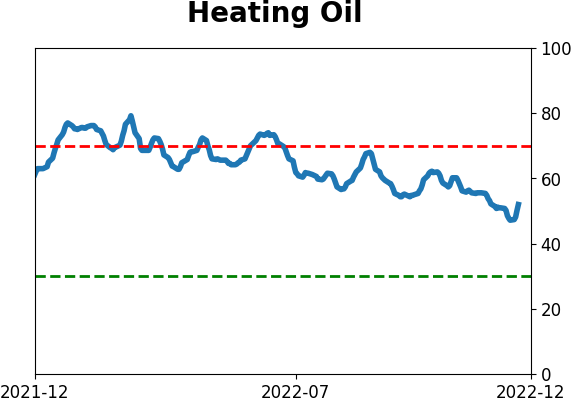
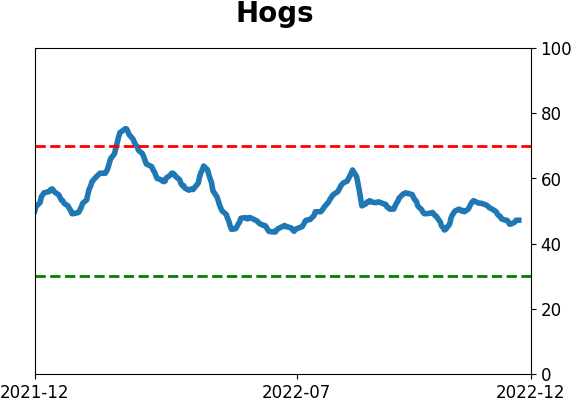
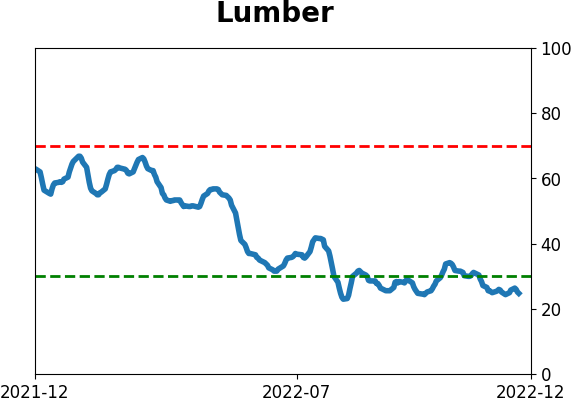
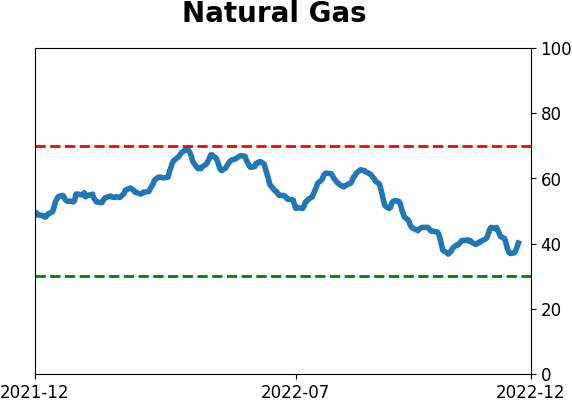
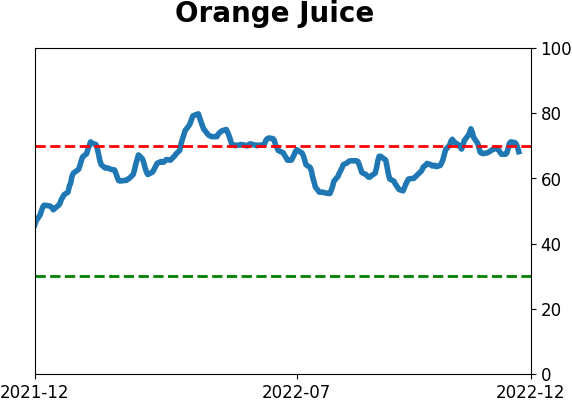
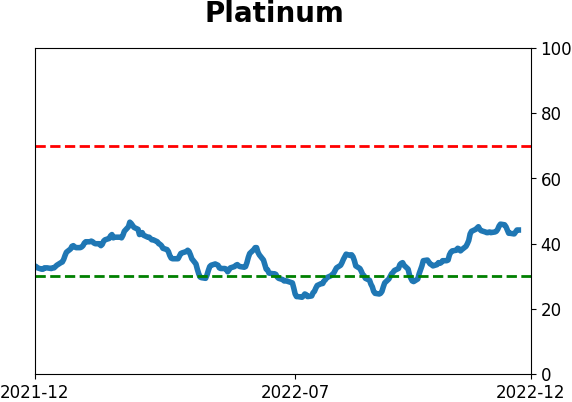
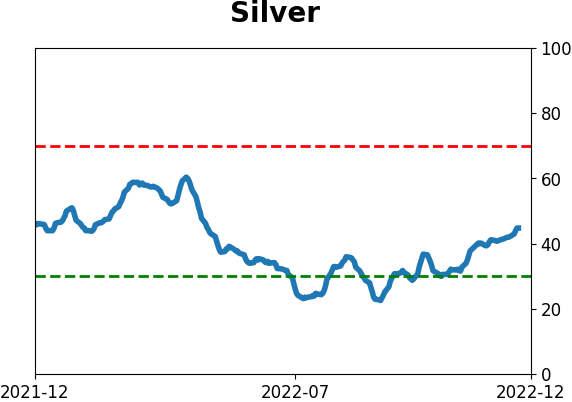
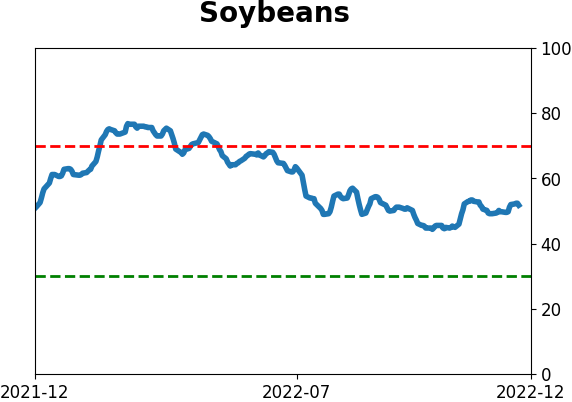
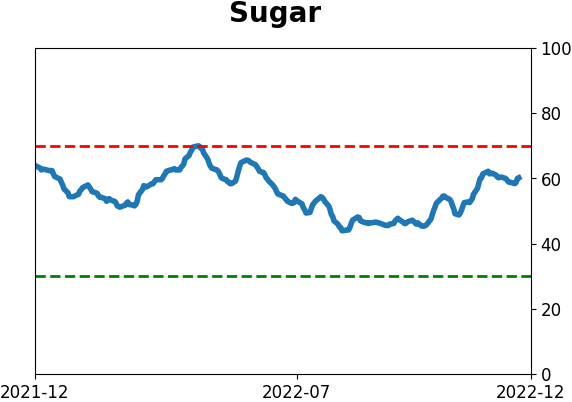
Commodity ETF's - 5-Day Moving Average
|
|