Headlines
|
|
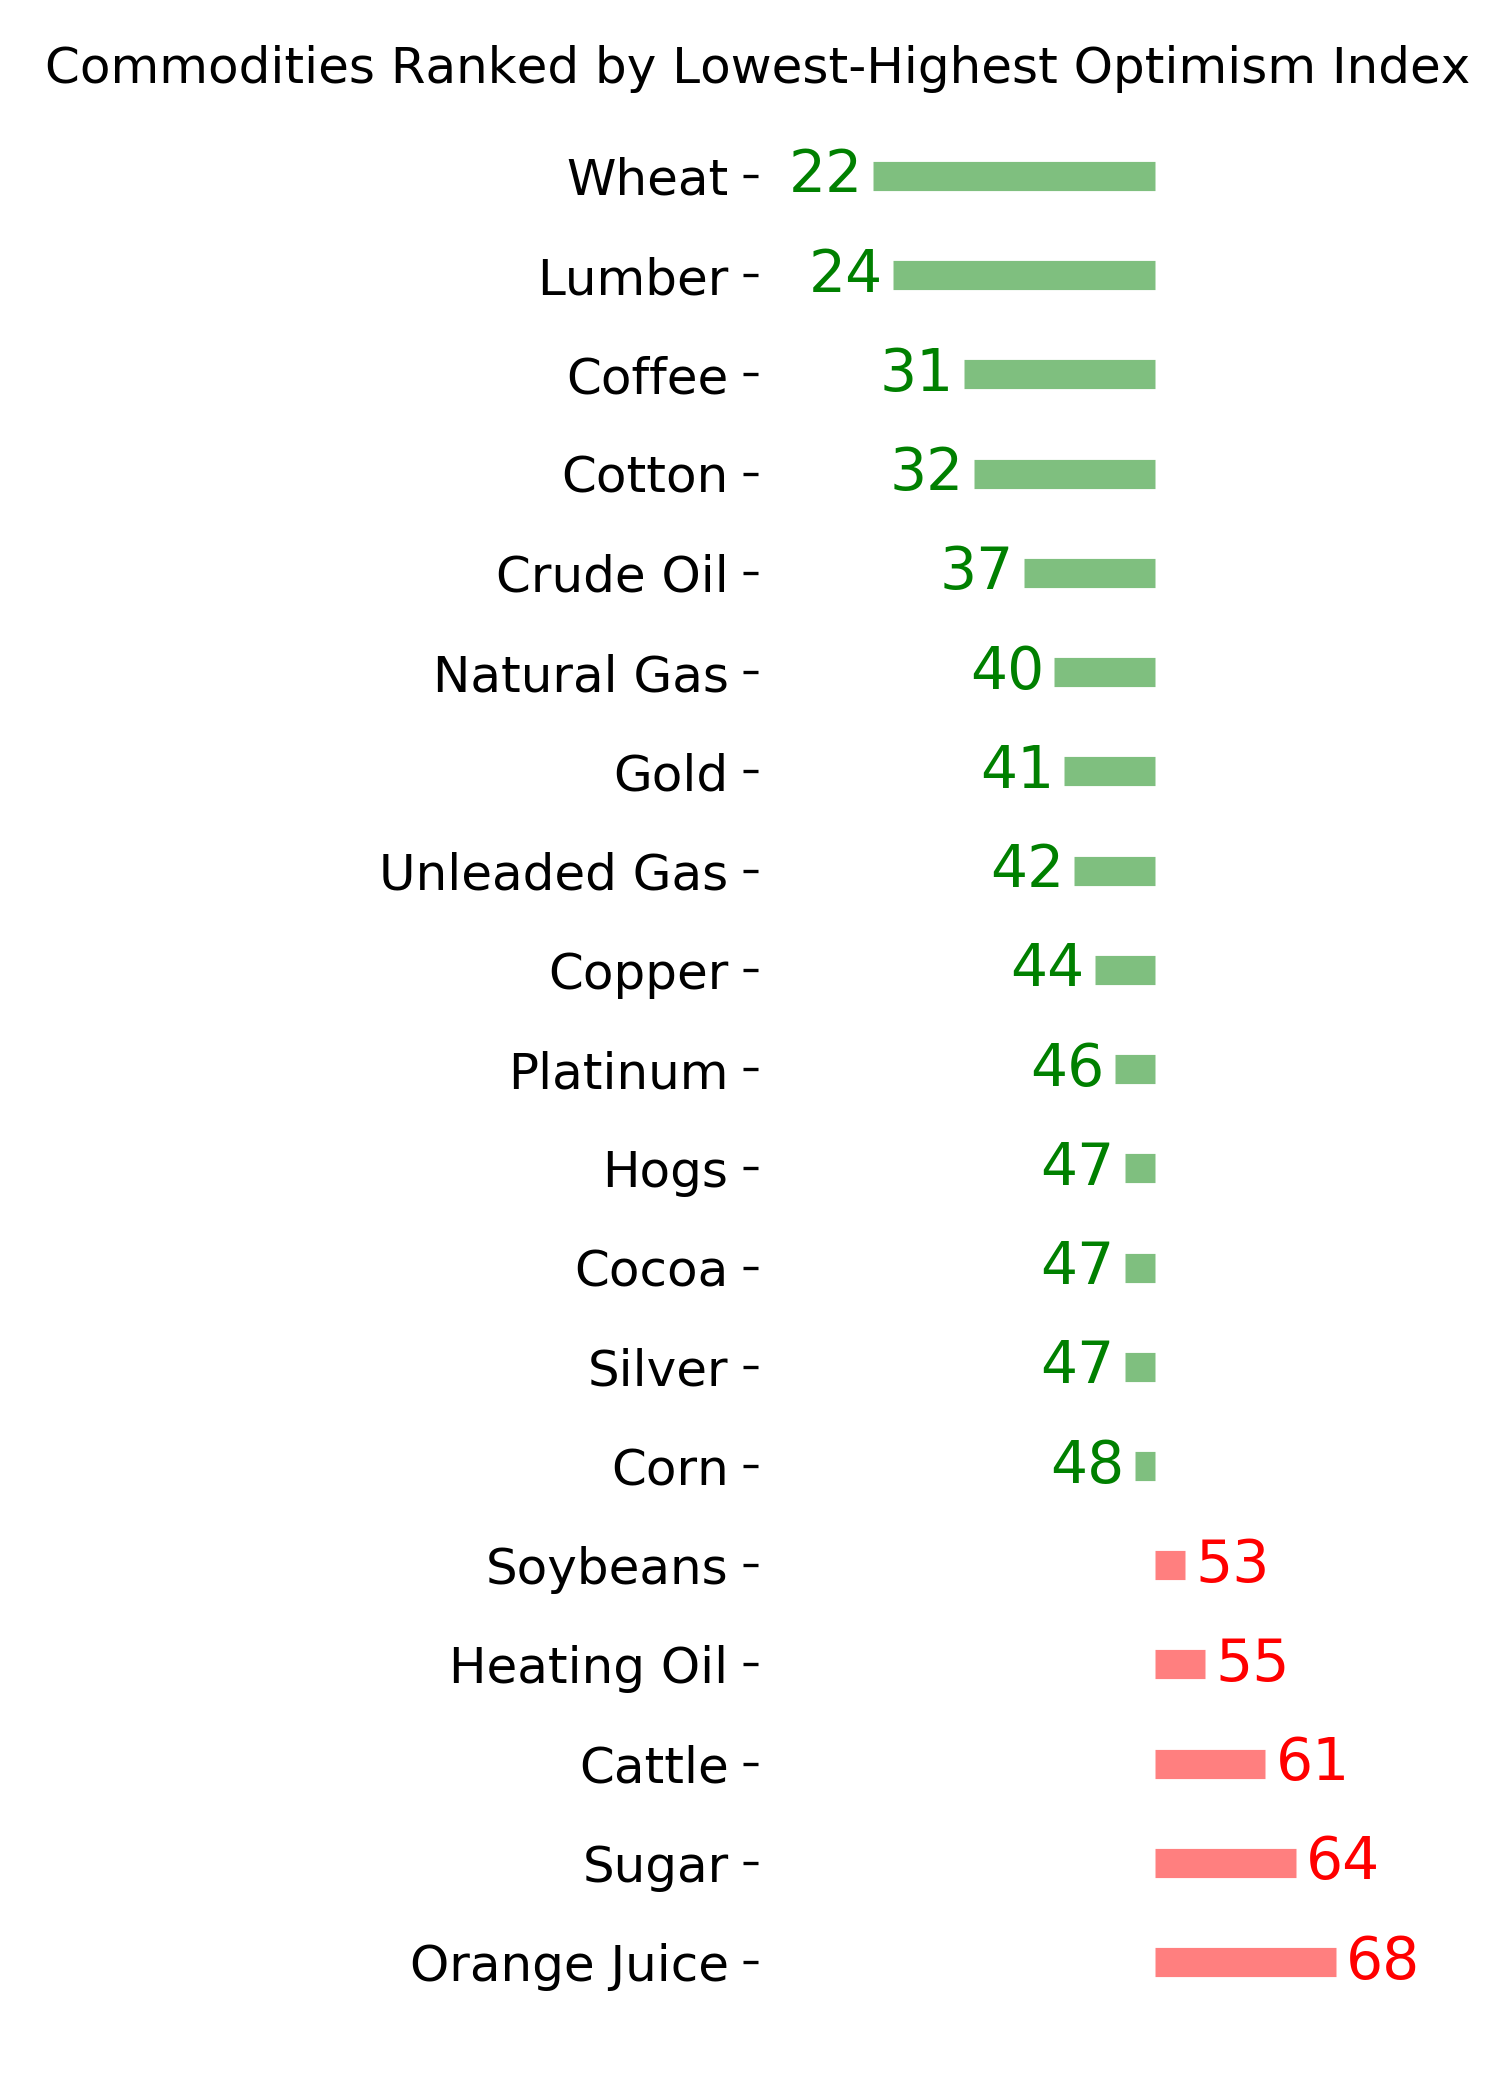
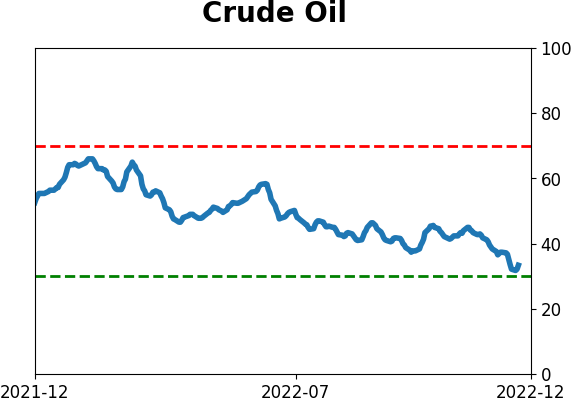
Oil sentiment is the most pessimistic in years:
Sentiment toward oil has cratered. For the first time since the pandemic, the Optimism Index on crude oil dropped to 30%, after being above 60% near its highs. Similar cycles tended to be negative for oil prices, but that didn't necessarily translate to energy stocks.
|
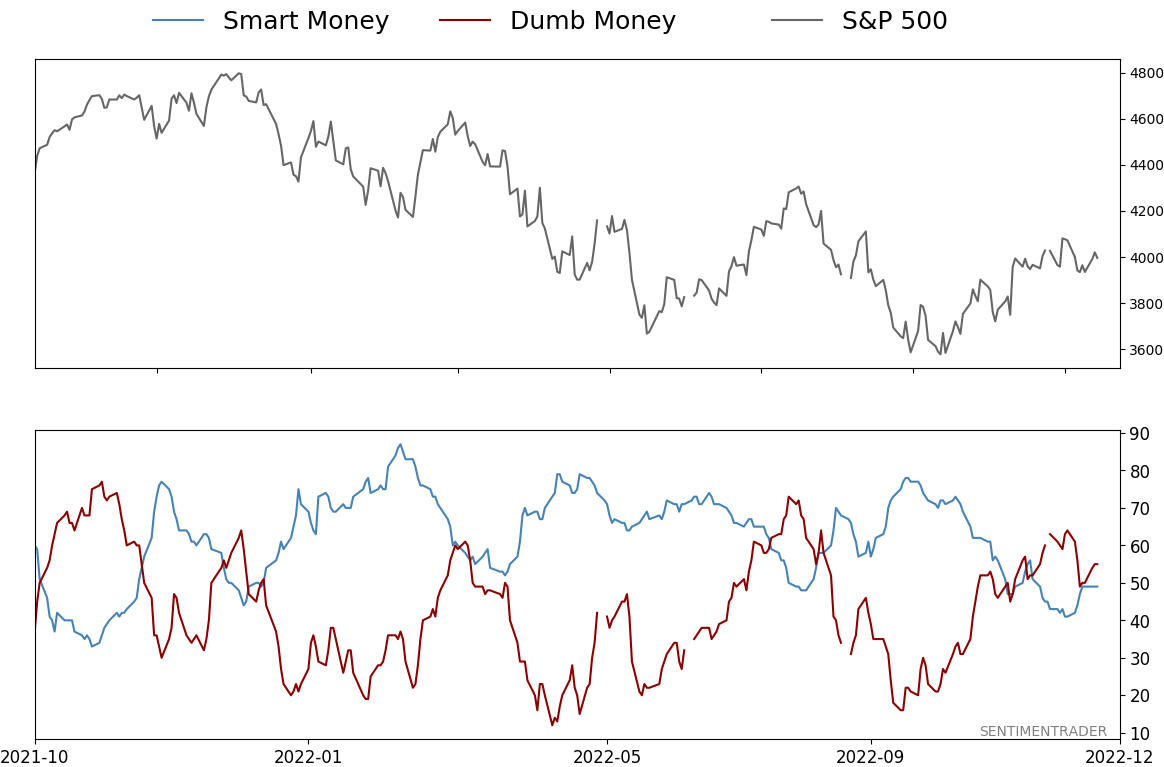
Smart / Dumb Money Confidence
|
Smart Money Confidence: 49%
Dumb Money Confidence: 55%
|
|
Risk Levels
Stocks Short-Term
|
Stocks Medium-Term

|
|
Bonds

|
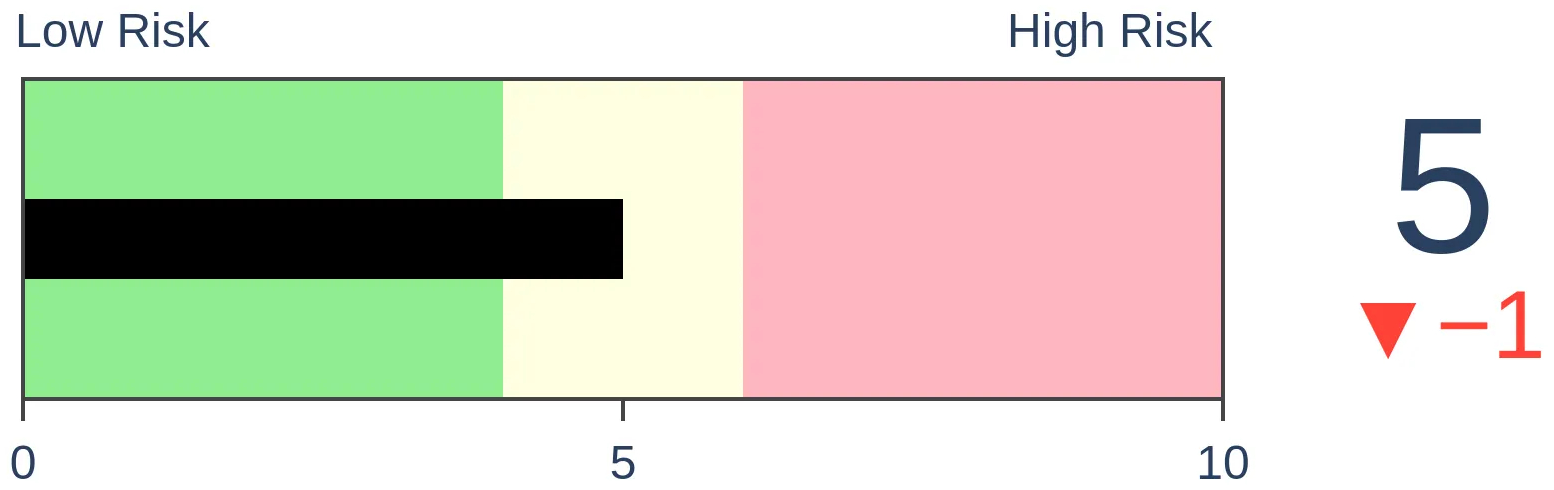
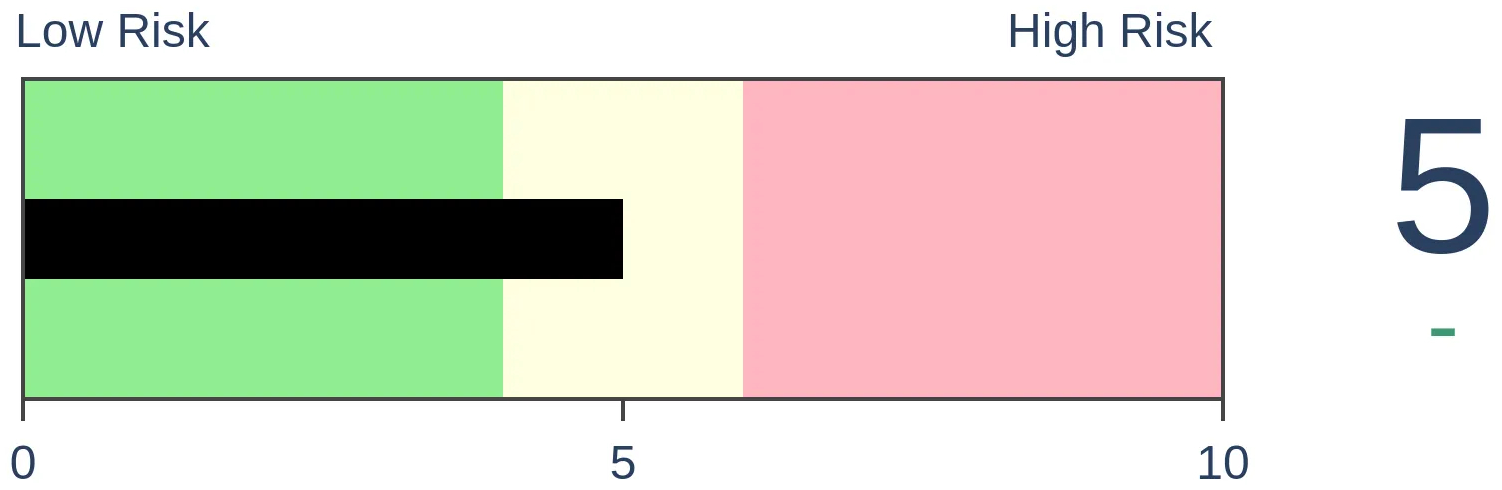
Crude Oil
|
|
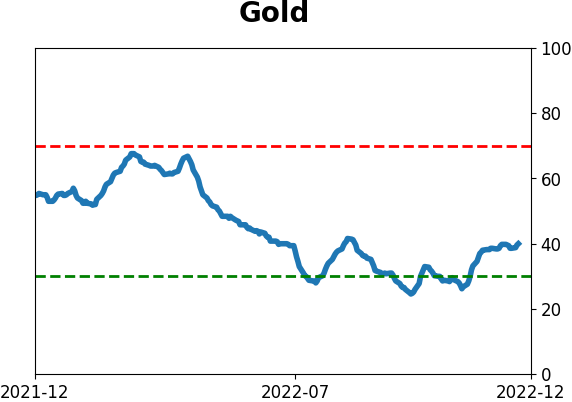
Gold
|
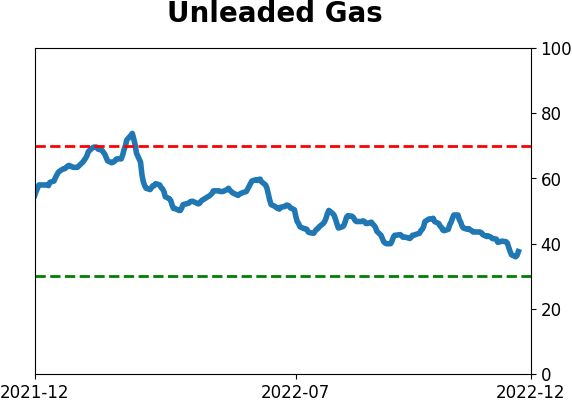
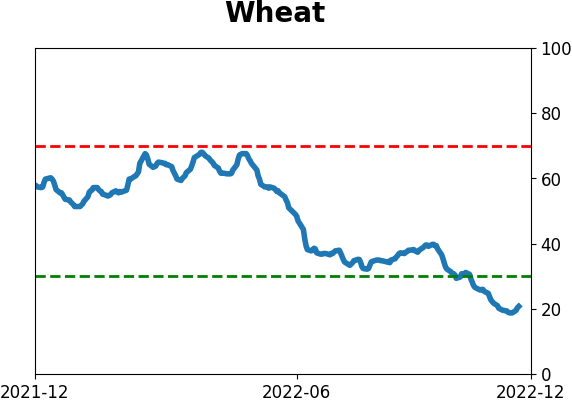
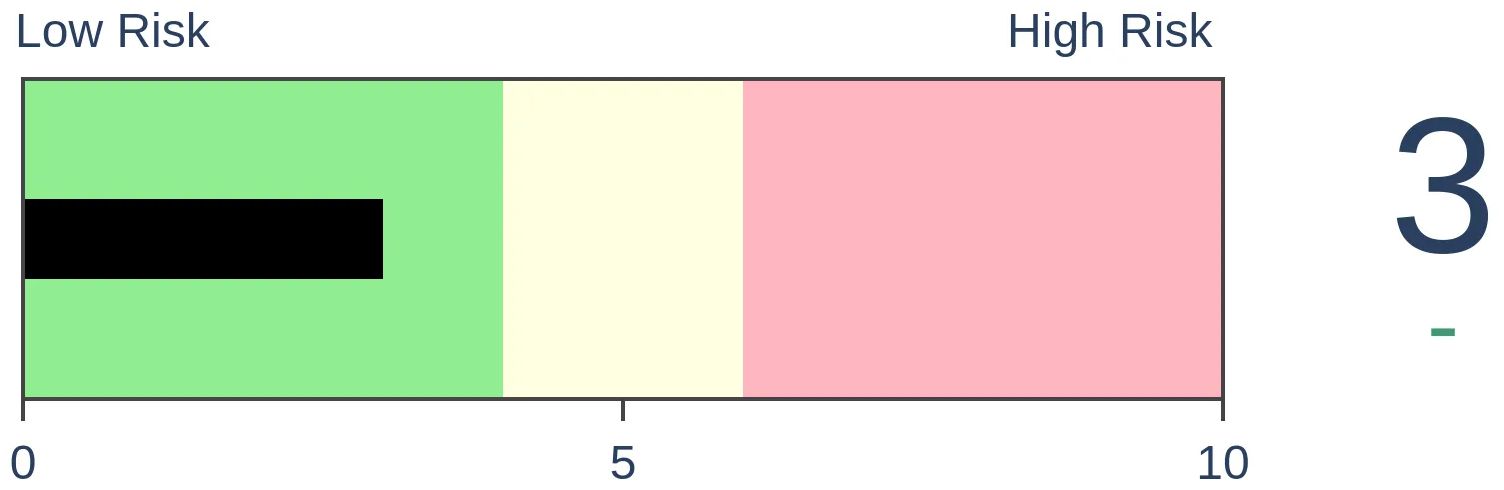
Agriculture
|
|
Research
By Jason Goepfert
BOTTOM LINE
Sentiment toward oil has cratered. For the first time since the pandemic, the Optimism Index on crude oil dropped to 30%, after being above 60% near its highs. Similar cycles tended to be negative for oil prices, but that didn't necessarily translate to energy stocks.
FORECAST / TIMEFRAME
None
|
Key points:
- Optimism on oil has dripped lower in recent months and just hit its lowest level since the pandemic
- Other times when crude oil optimism cycled from a high to a low level, crude prices struggled in the months ahead
- It didn't have much impact on energy stocks, however, and the S&P 500 typically rallied
Investors have soured on the oil patch
Crude oil has been taking it on the chin, a major victory for consumers and a minor one for investors. We should see consumer sentiment surveys improving as oil struggles.
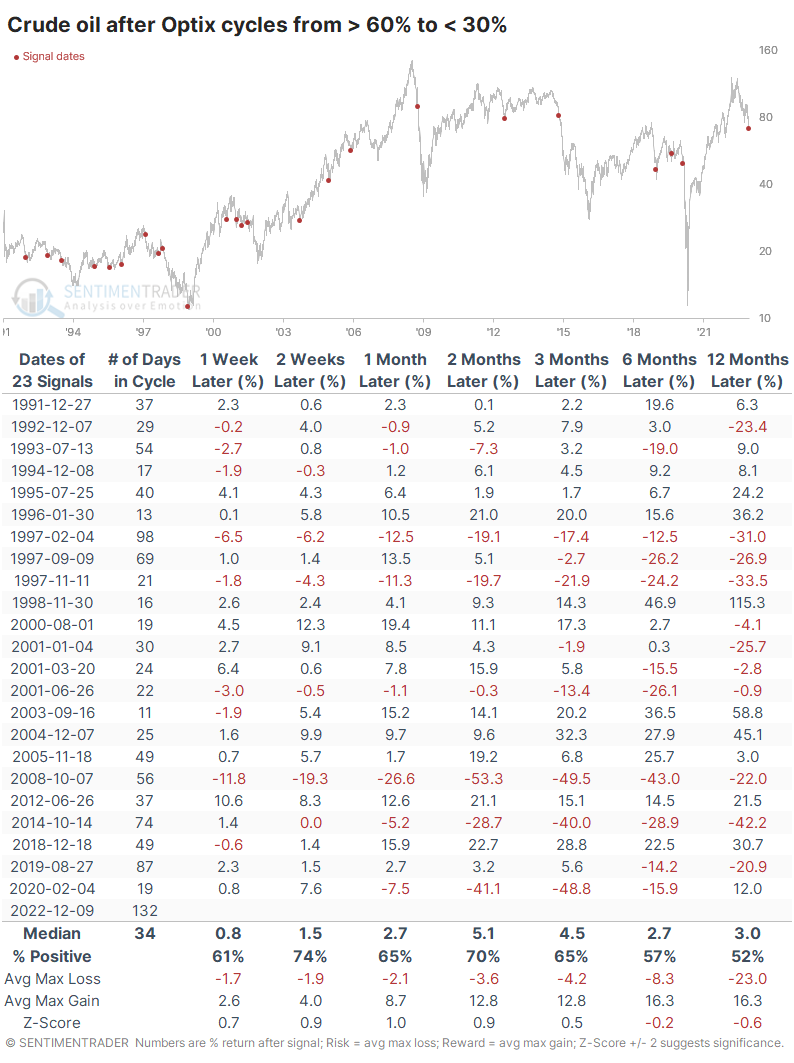
The decline in recent weeks was enough to push the Crude Oil Optimism Index (Optix) to 30% for the first time in years.
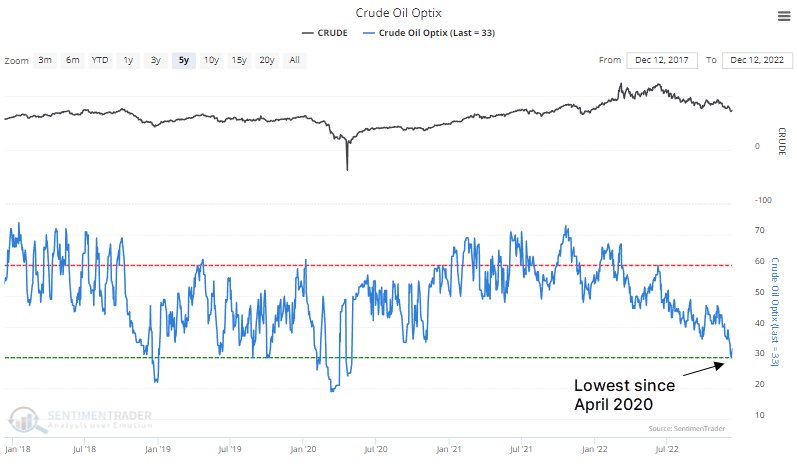
The Backtest Engine shows that a reading of 30% or below leads to below-average returns for crude oil. While a low reading occurred at most major lows, when it first reached this level, trend followers got the benefit of the doubt.
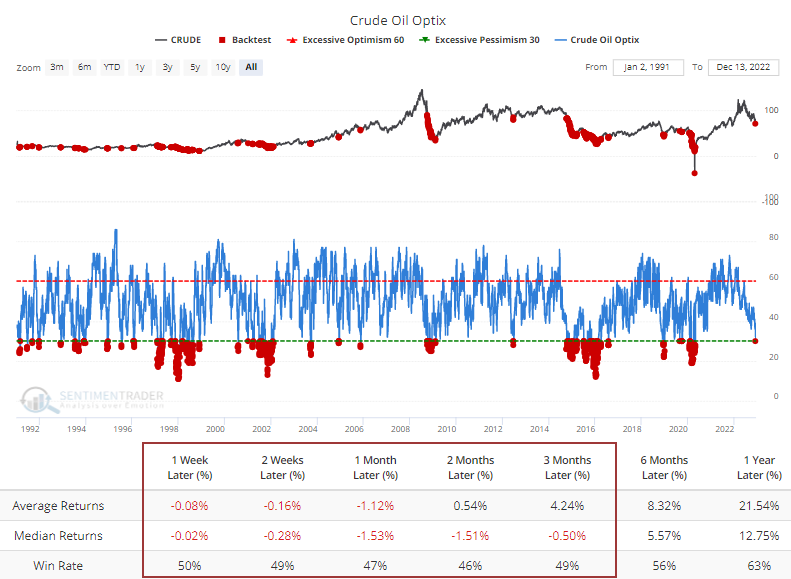
The table below shows every time over the past 30 years when oil's Optix cycled from 60% or above to 30% or below. This has been the most extended cycle.
When the cycle took 30 or more days, crude's median 6-month return was -12.5%, and it was higher 45% of the time. When it was under 30 days, the return was +2.8%, with a 67% win rate. So, quick panics in sentiment tended to lead to relief rebounds more often than drips lower in sentiment like we've seen over the past nine months.
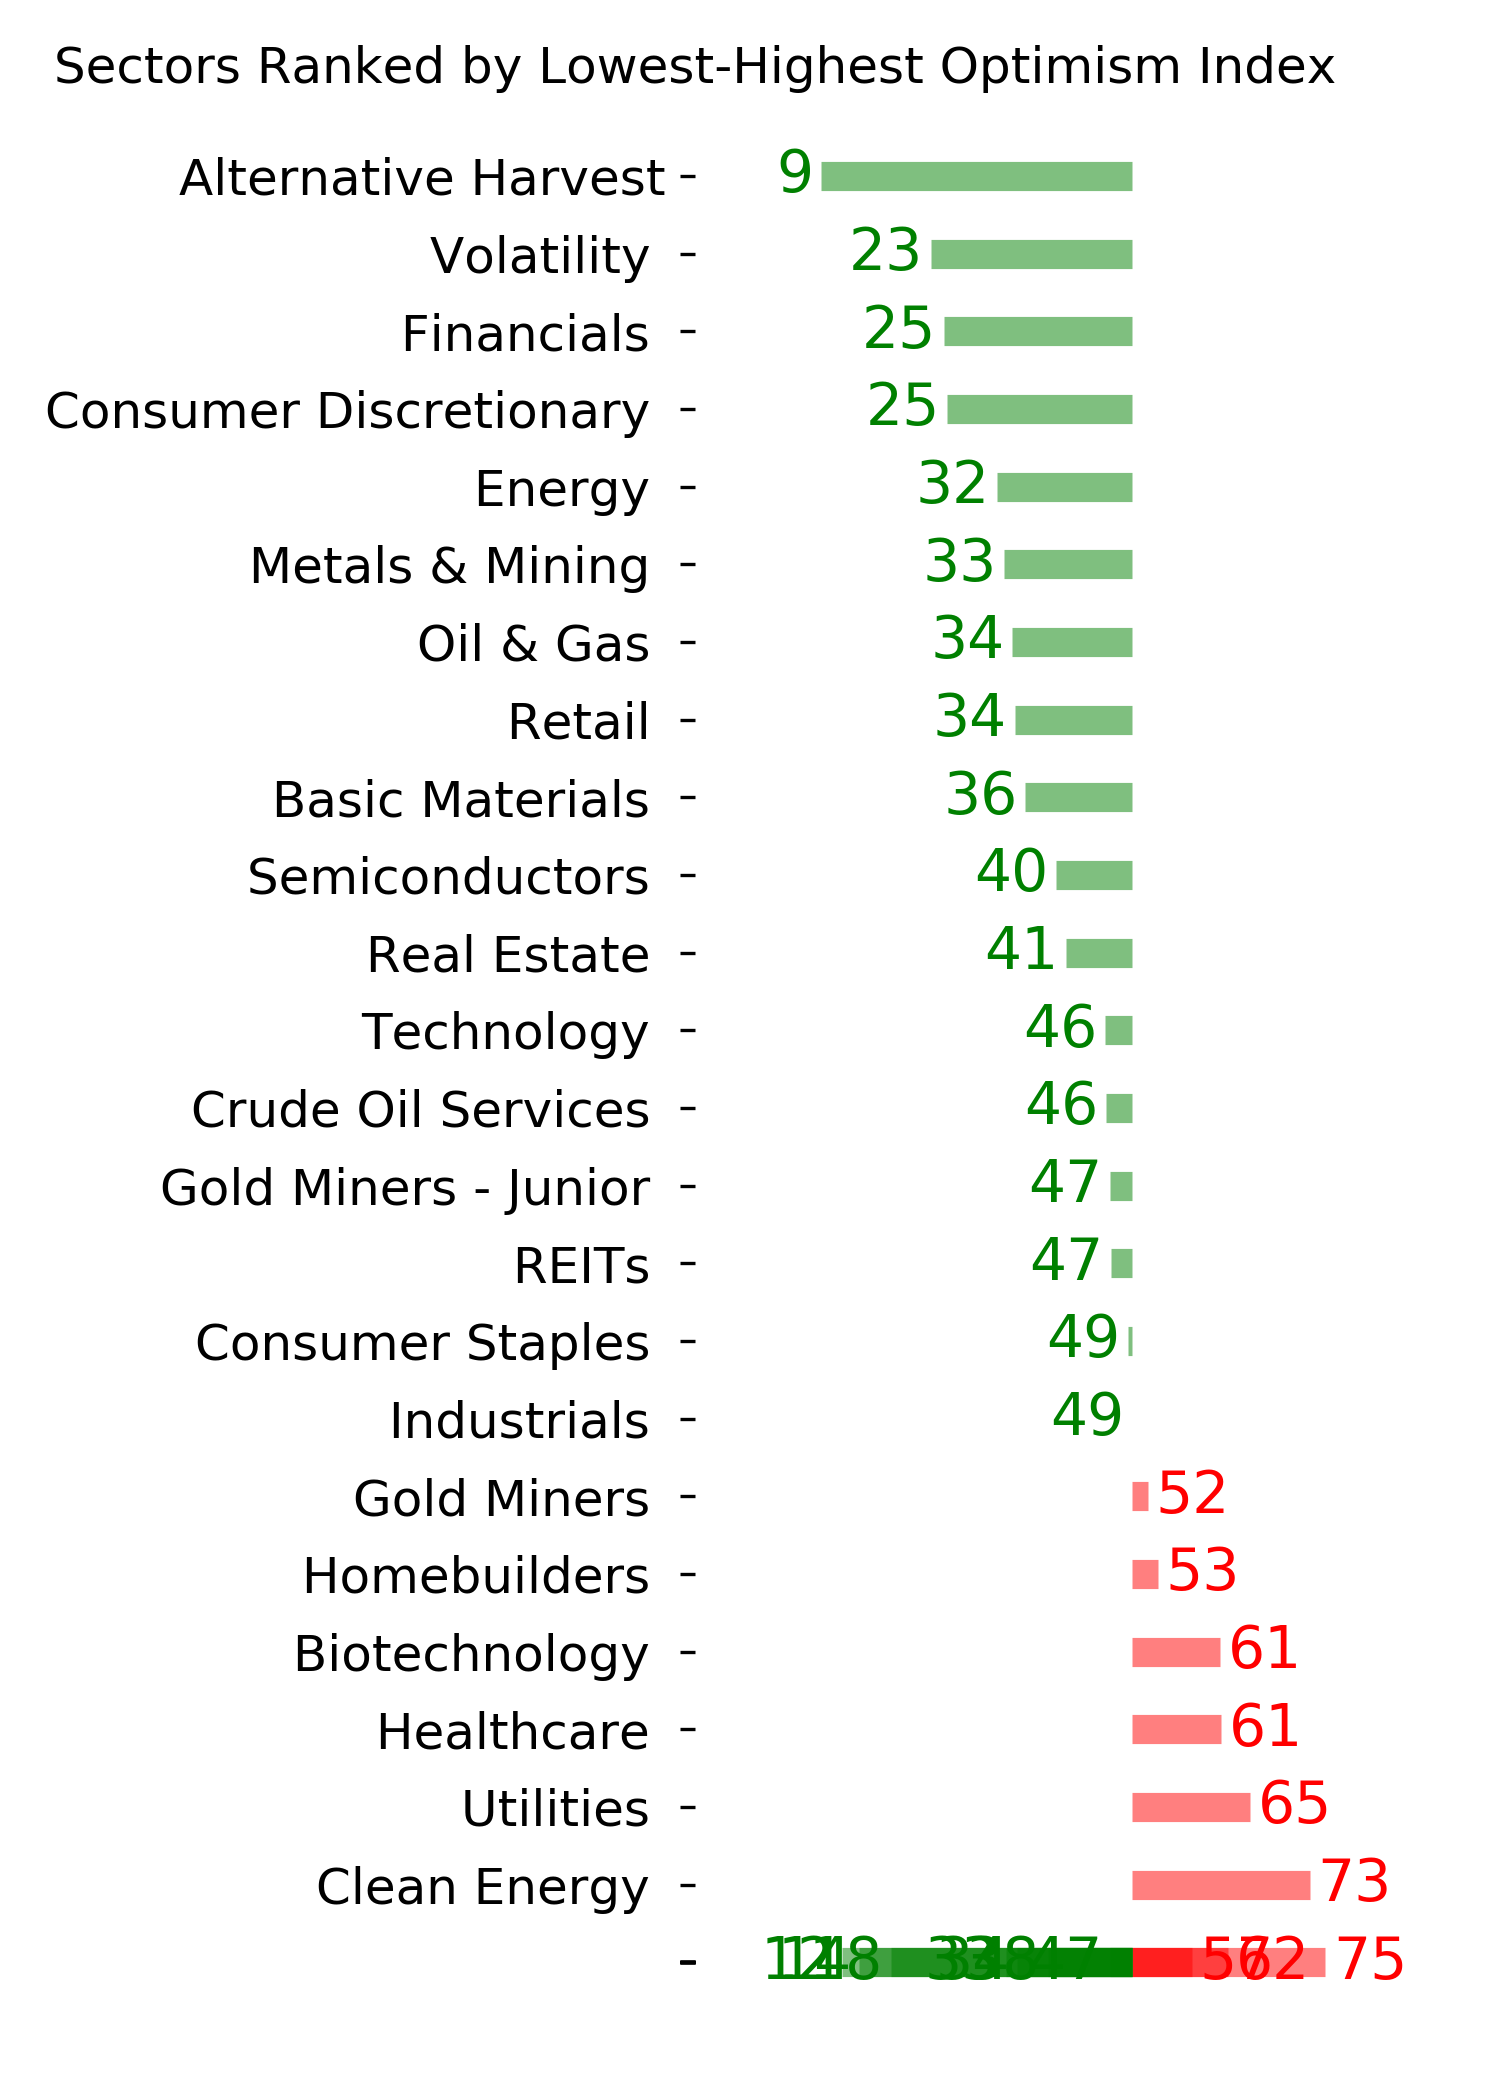
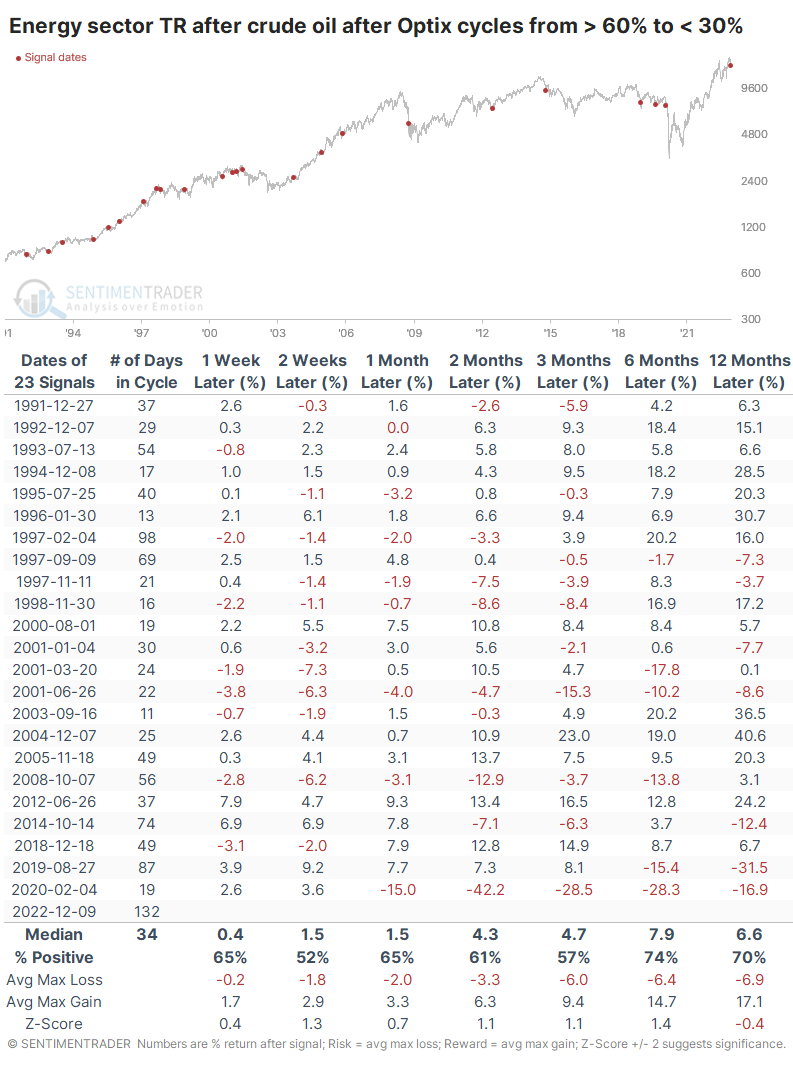
Dean noted the oversold nature of energy stocks on Tuesday. After these cycles in oil sentiment, the total return in the energy sector was decent, above average up to six months later. There were a few hefty losses in there, however, including the most recent signal.
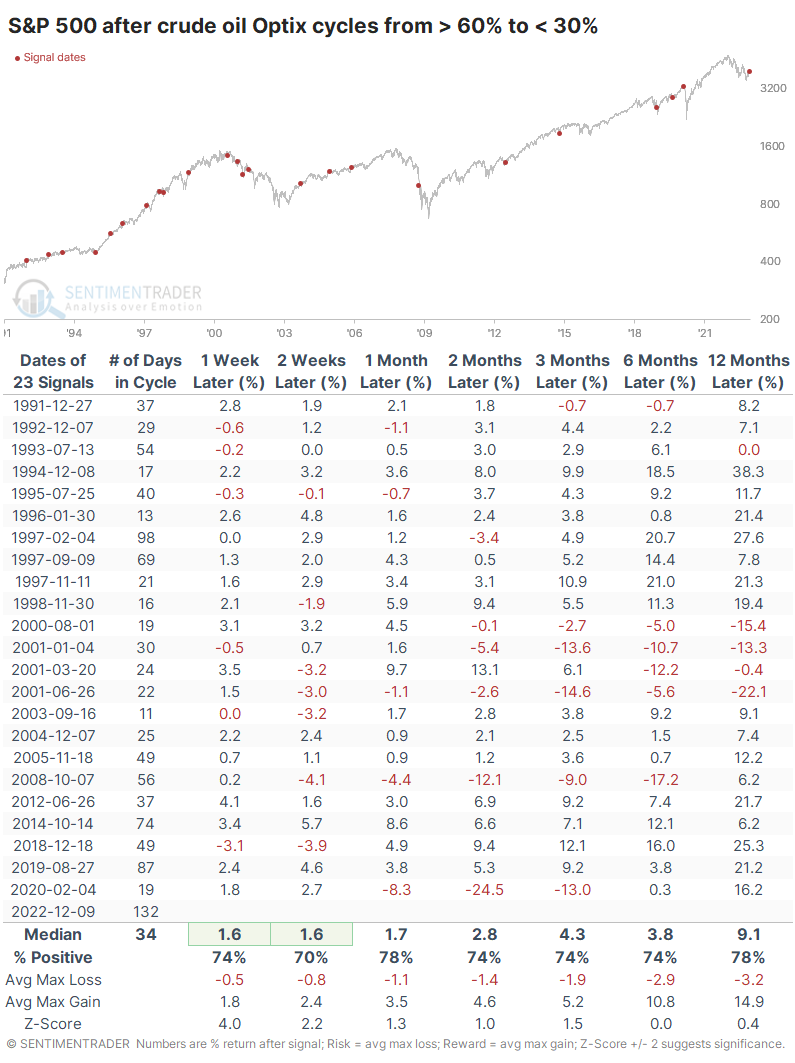
For stocks, these boom-then-bust signals in oil sentiment tended to be a modest positive factor, especially shorter-term. The only losses over the next year occurred during the 2000-01 bear market; all the others preceded 12-month gains (or flat).
What the research tells us...
Oil prices are one of the most curious barometers among macro analysts. Some consider low prices to be a boon for consumers and thus to the stock market, while others think it's a sign of waning demand, looming recession, and certain doom. Whenever sentiment toward oil has swung as it has over the past nine months, the commodity itself has tended to keep dropping, though it wasn't a huge edge. It didn't seem to have much impact on the total return in energy stocks, but it did tend to provide a modest boost to broader stock prices.
Indicators at Extremes
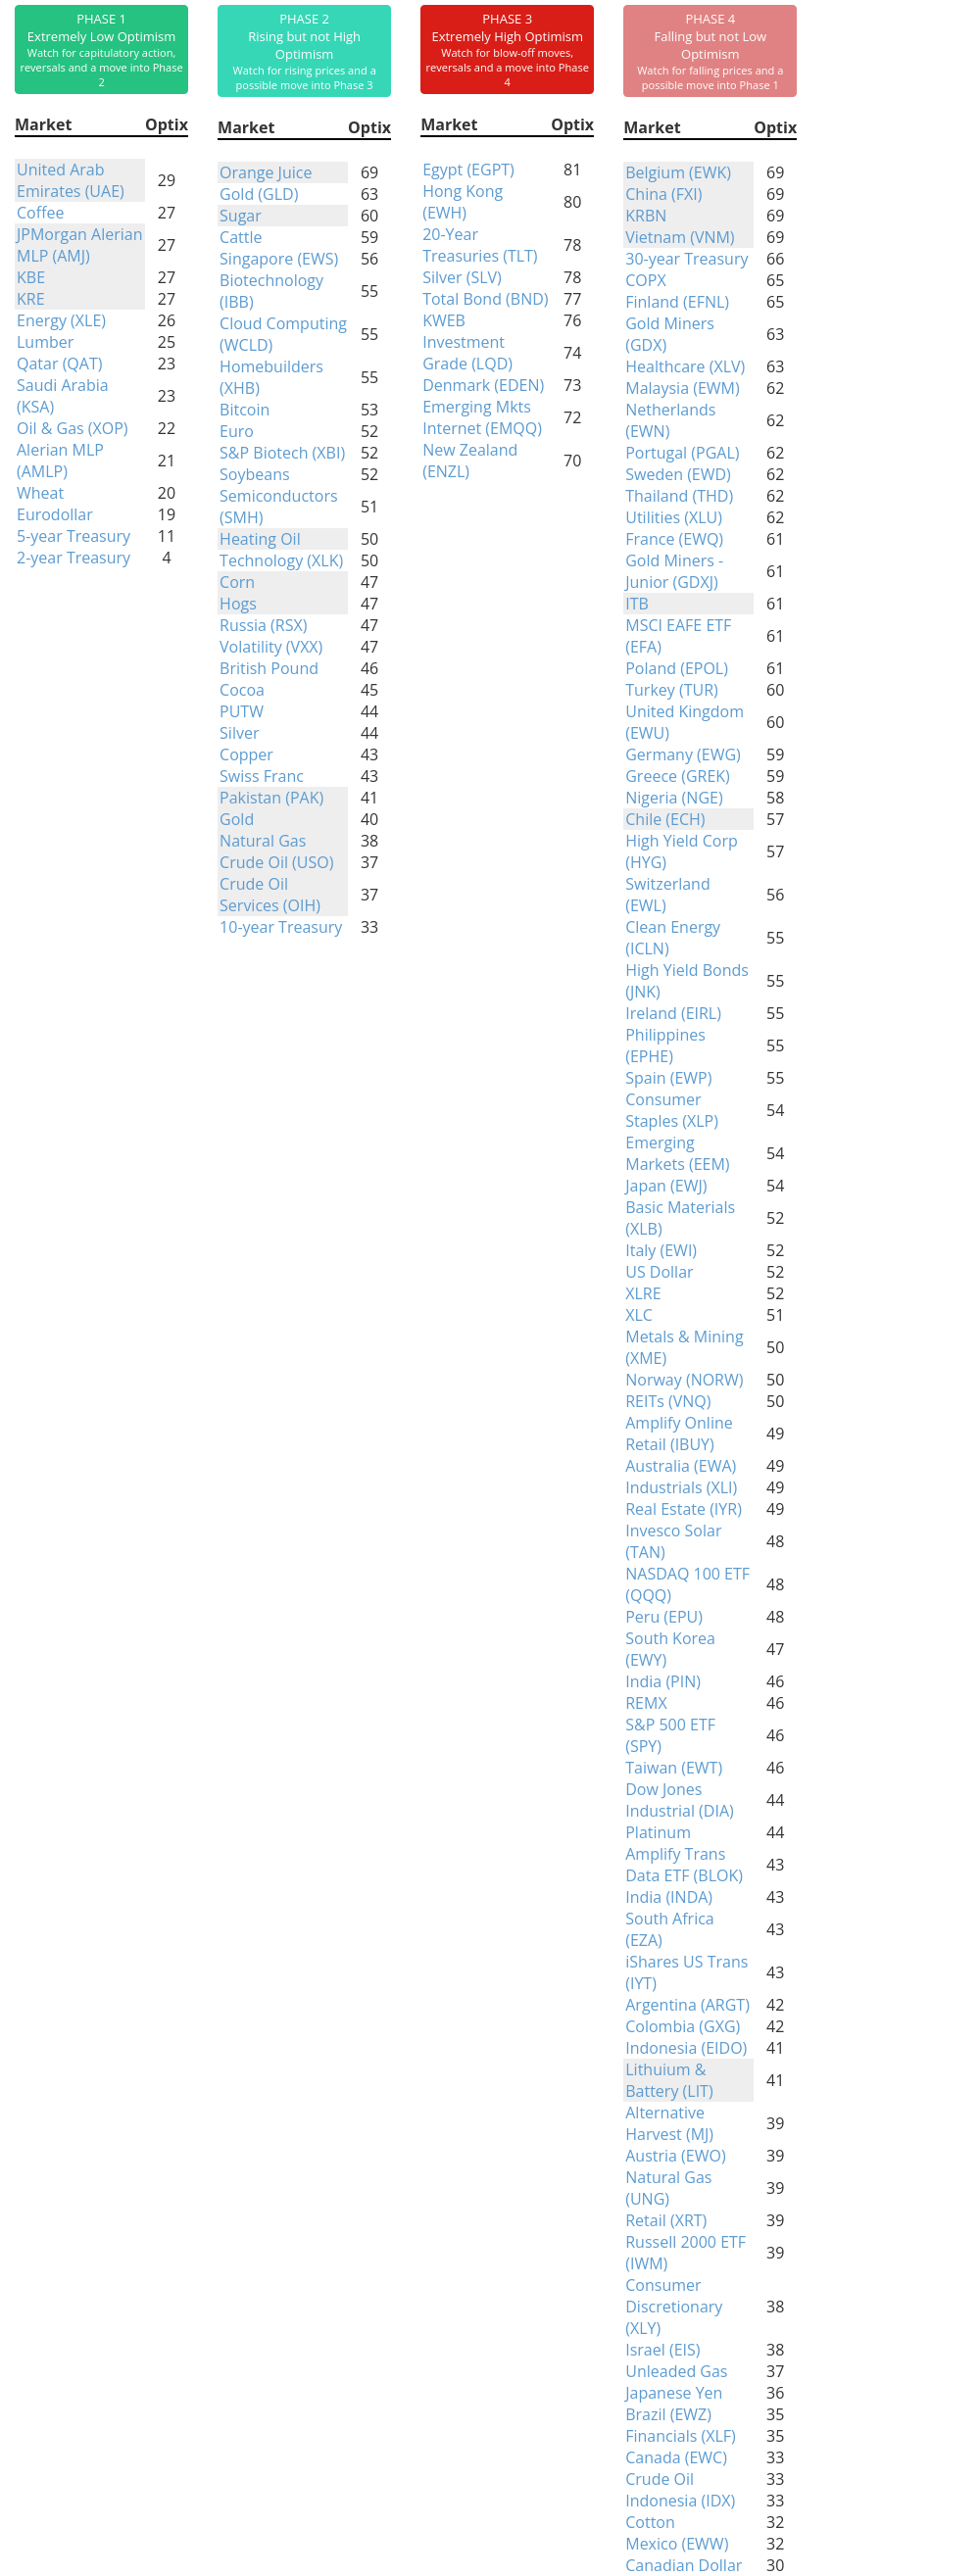
Phase Table
Ranks
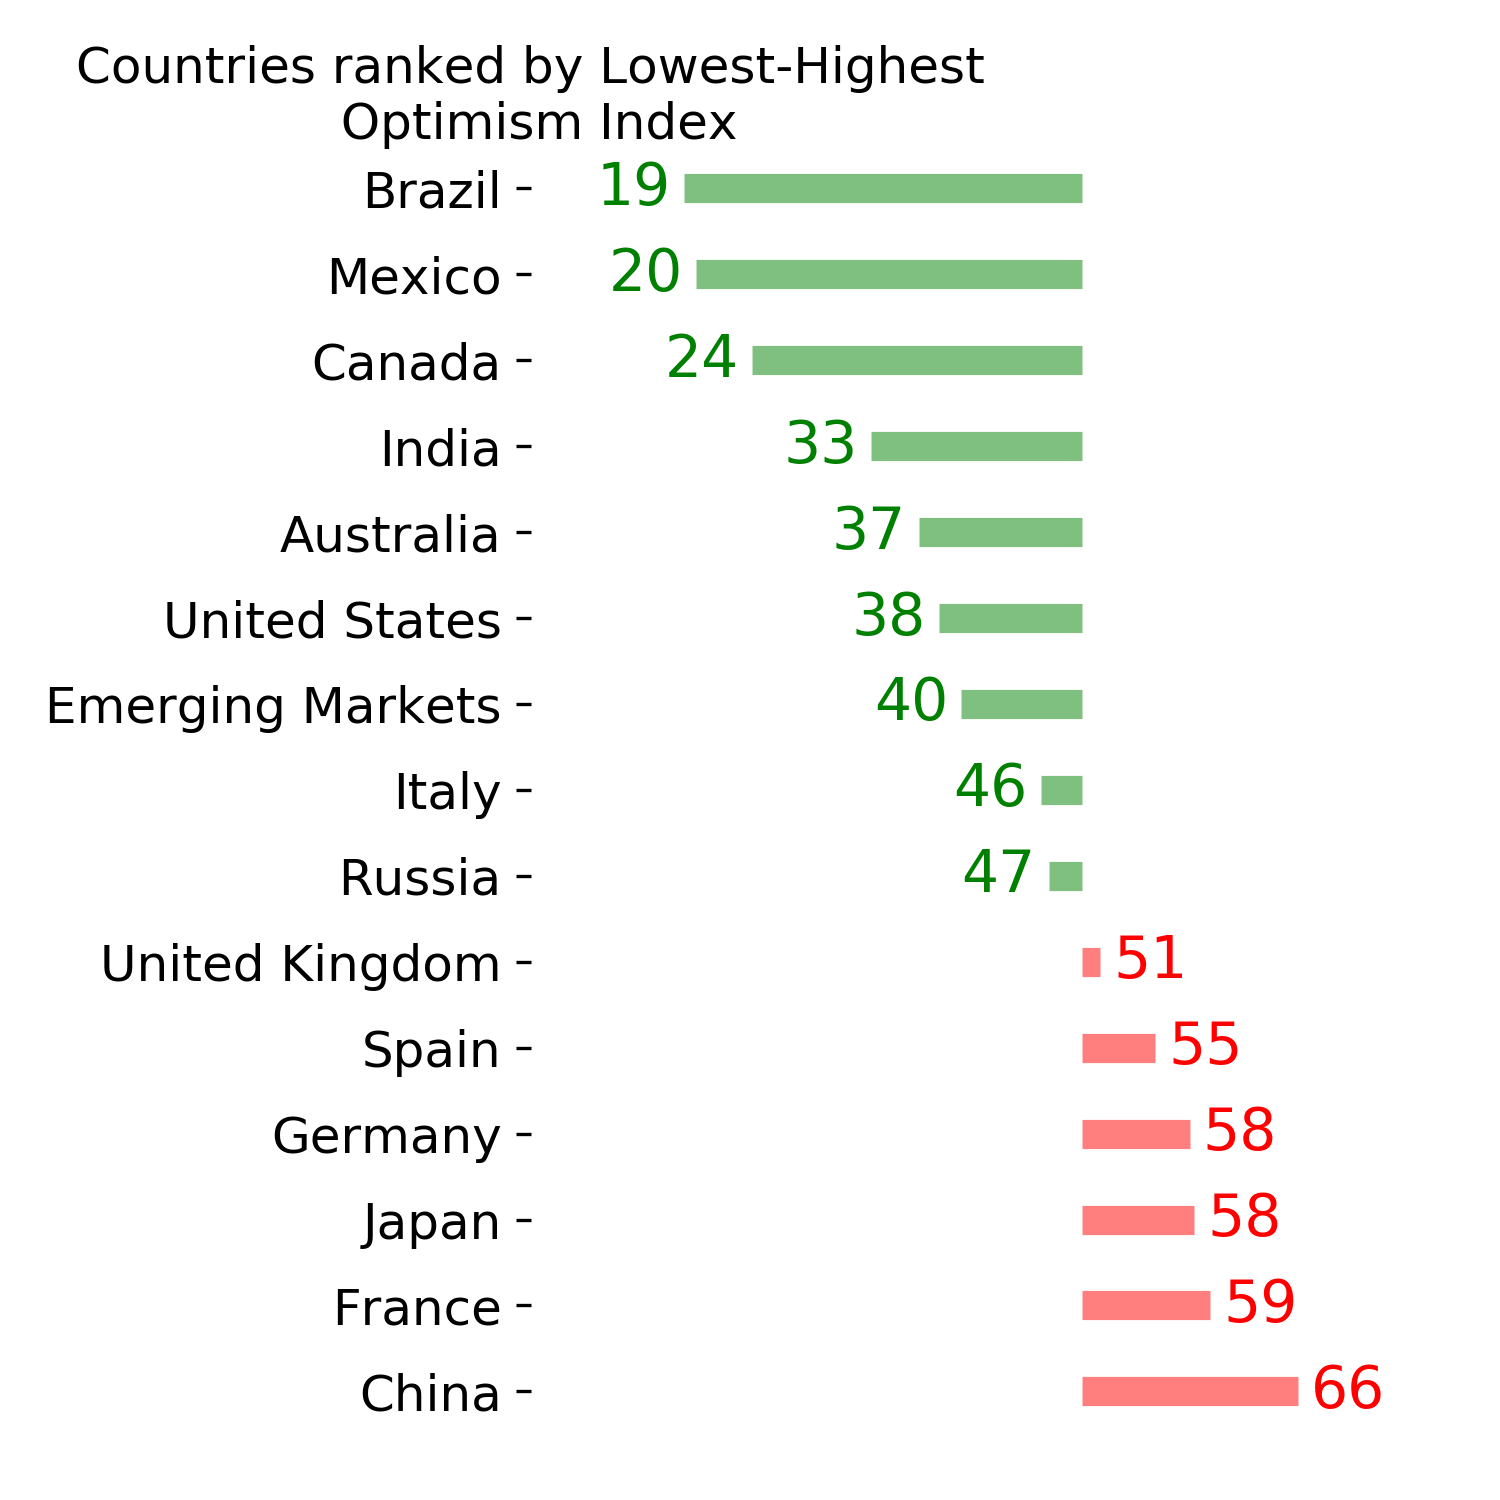
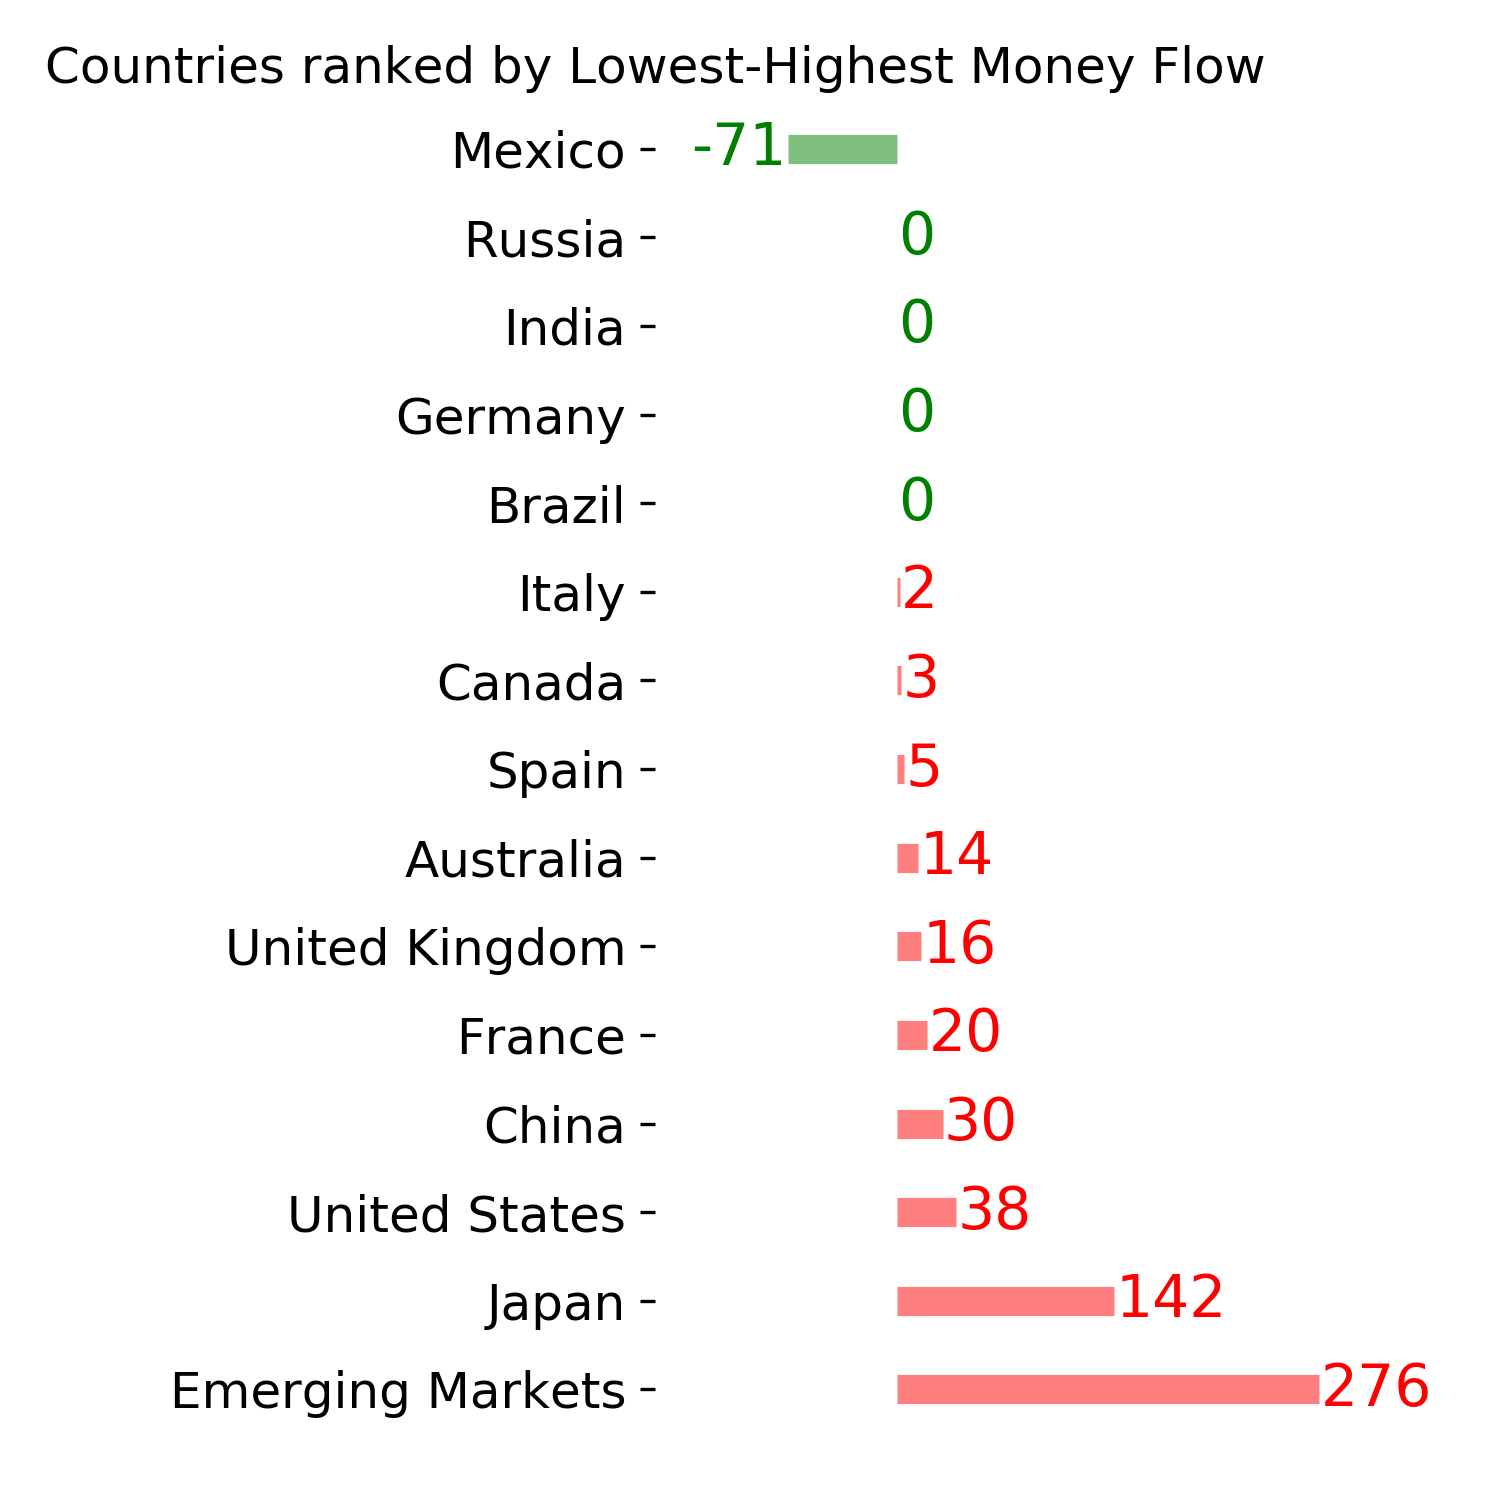
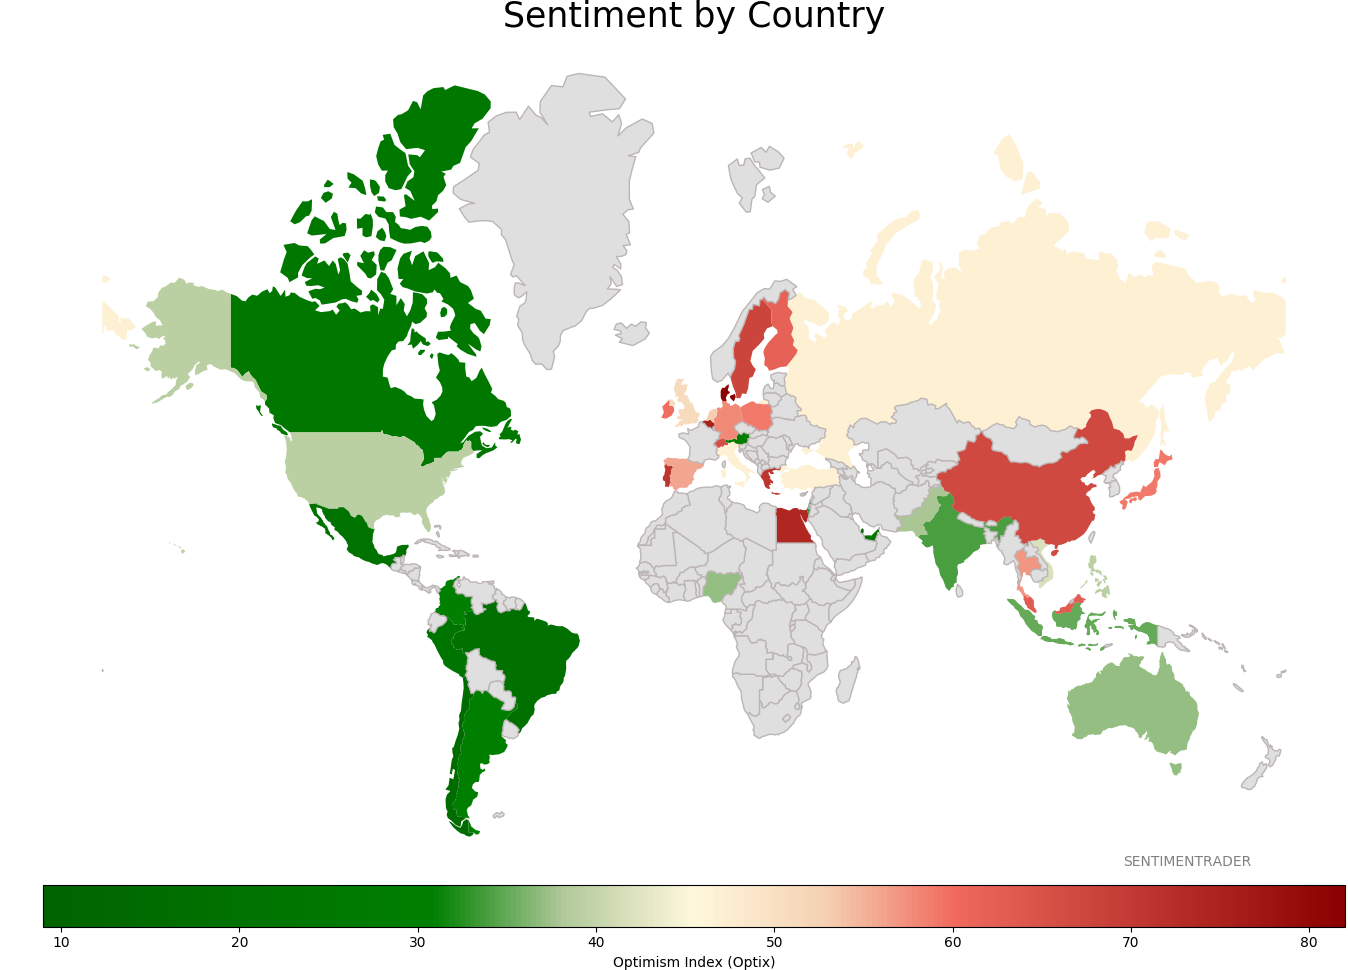
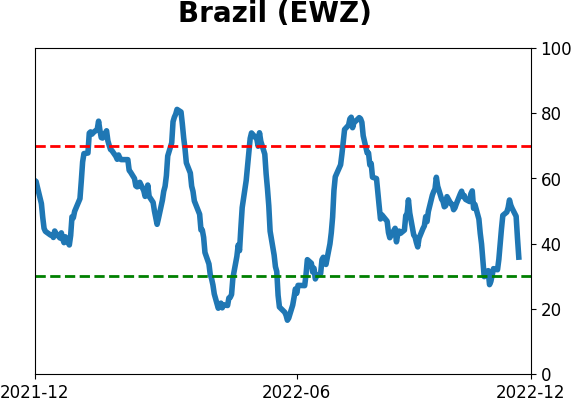
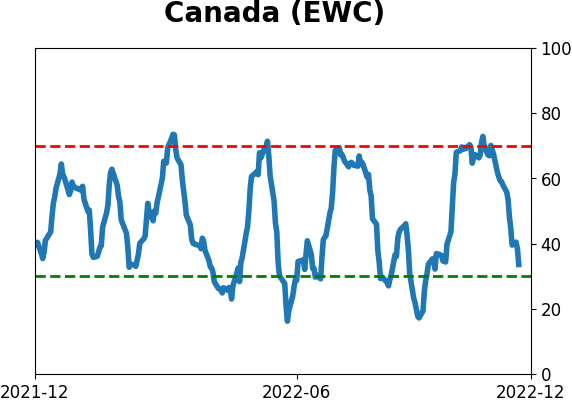
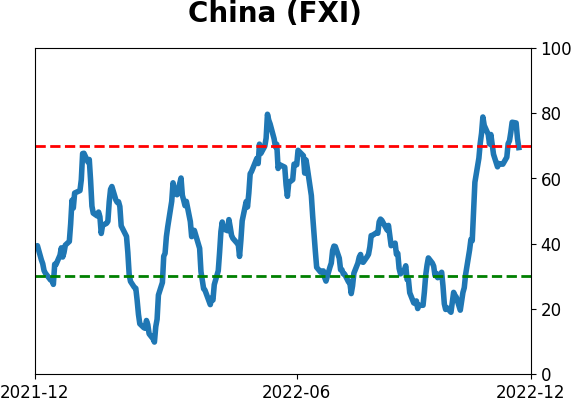
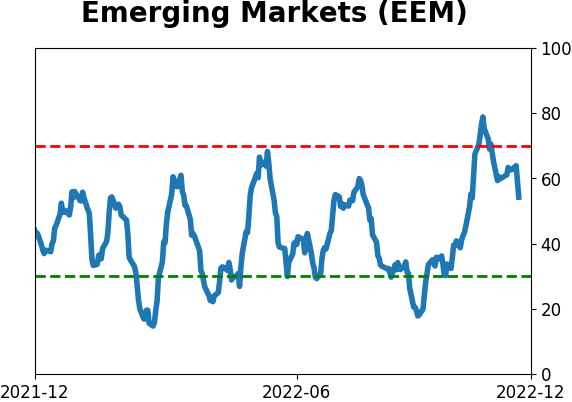
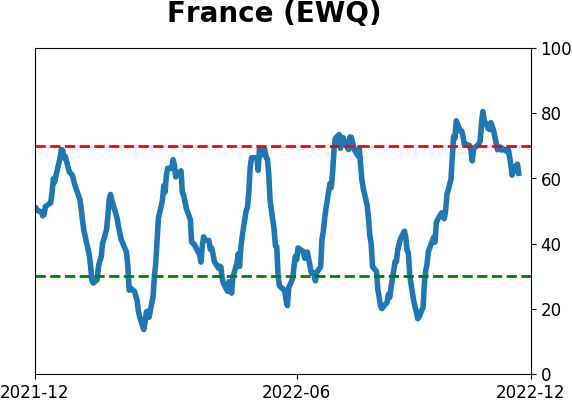
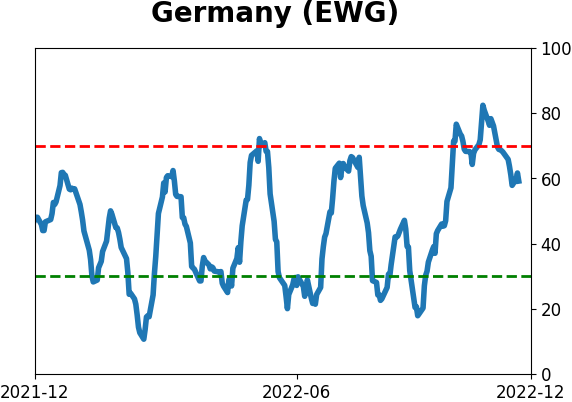
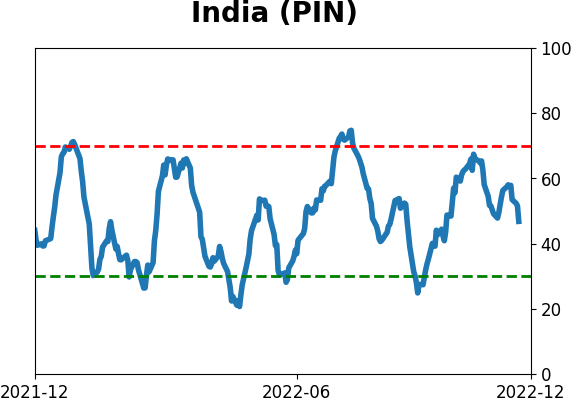
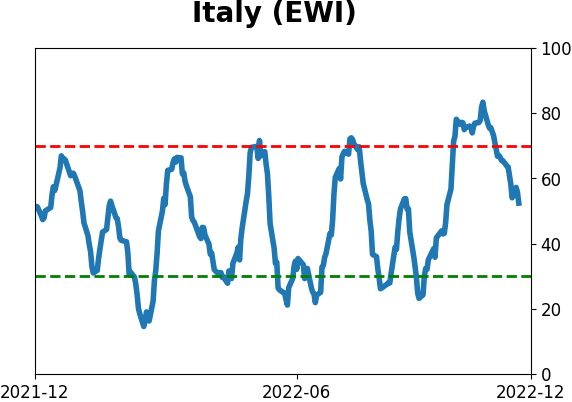
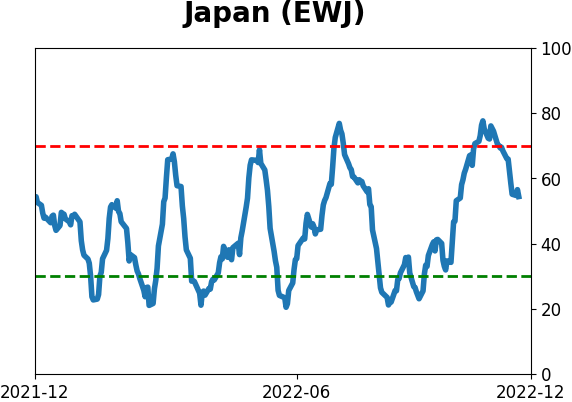
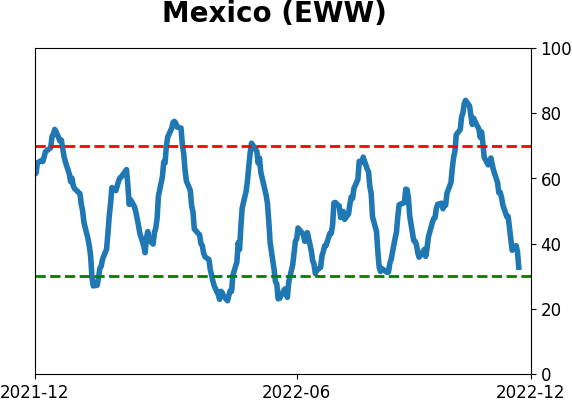
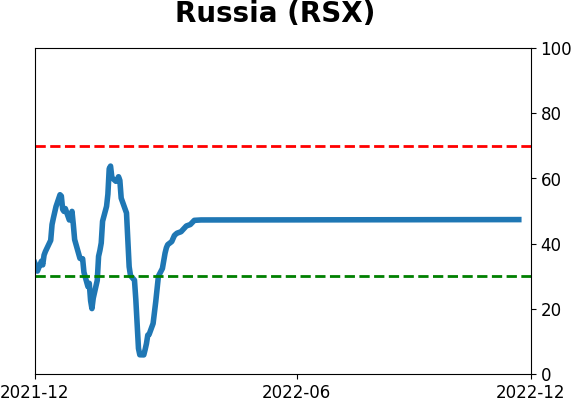
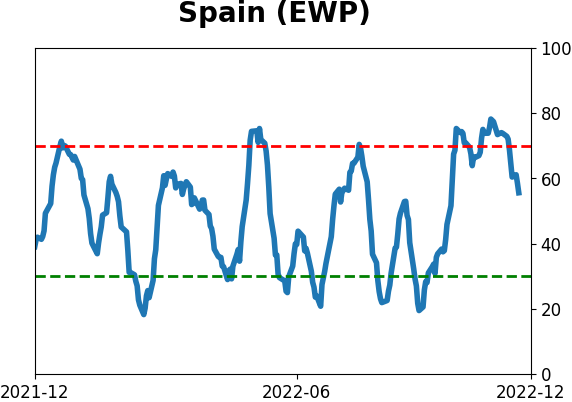
Sentiment Around The World
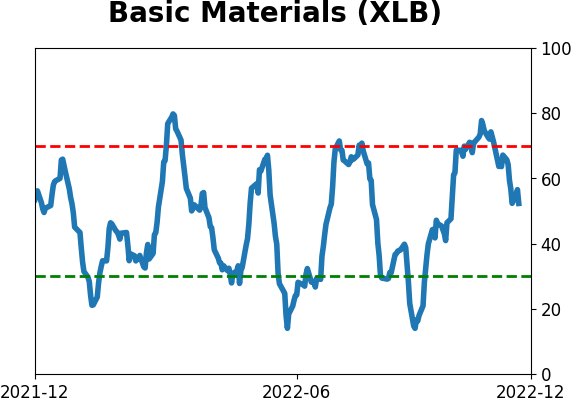
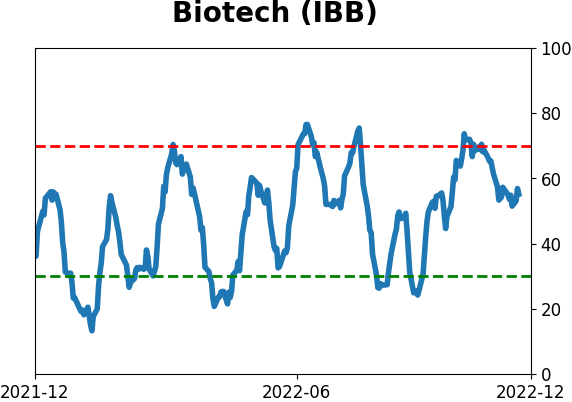
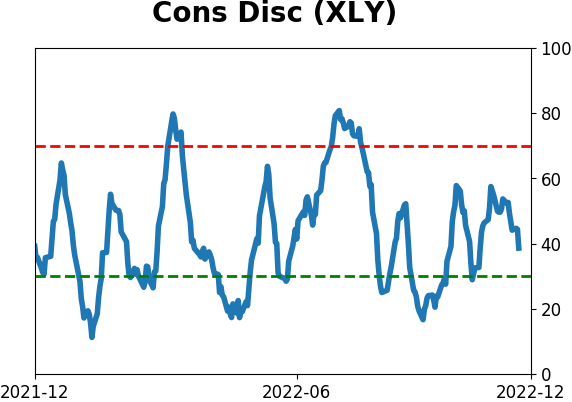
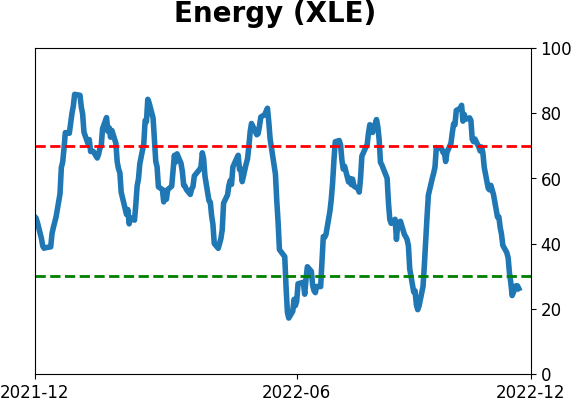
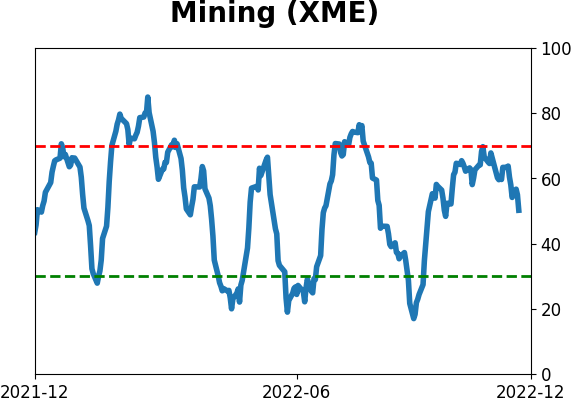
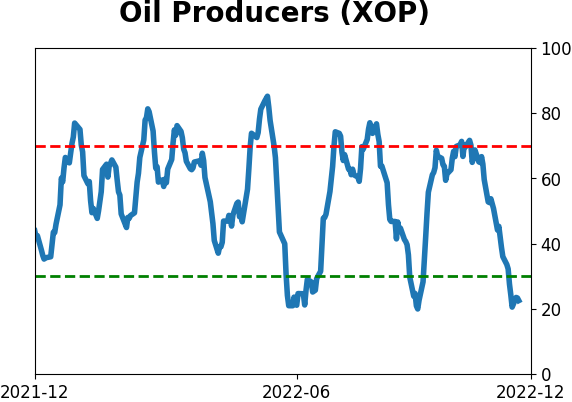
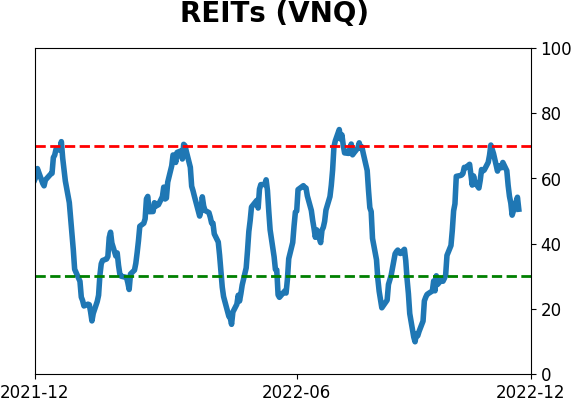
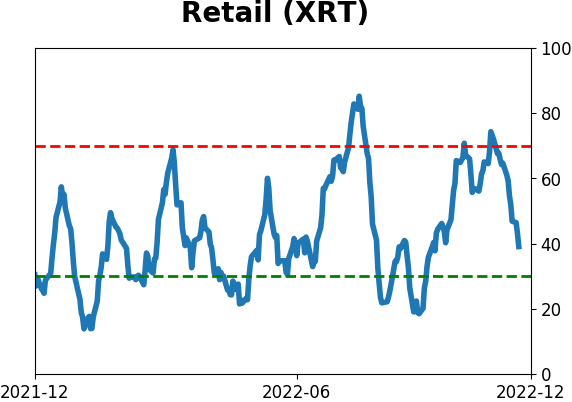
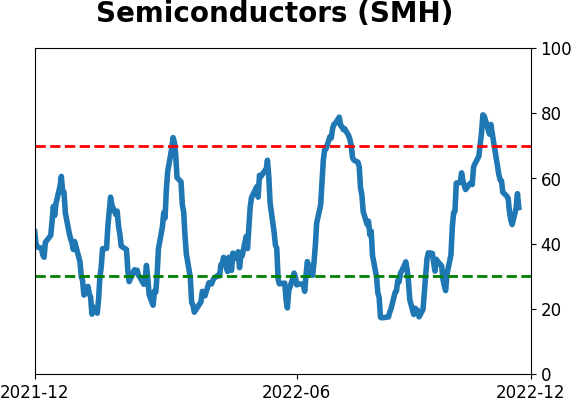
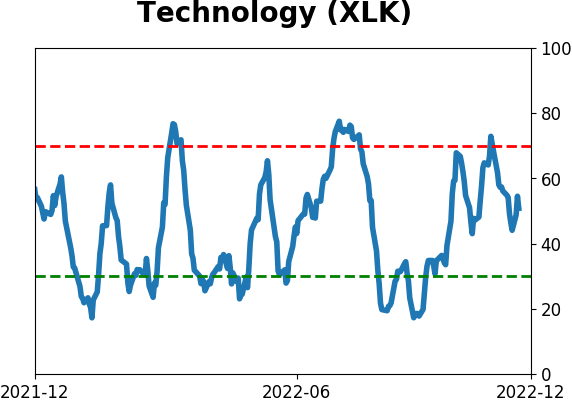
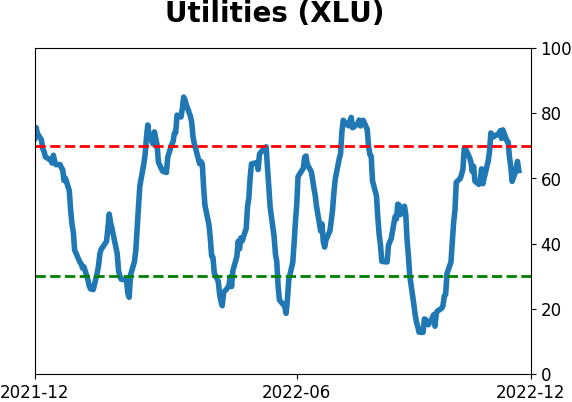
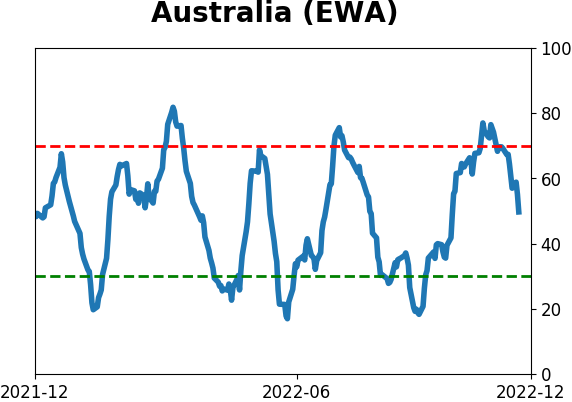
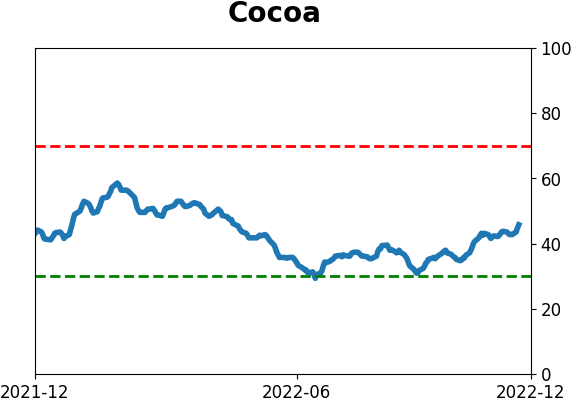
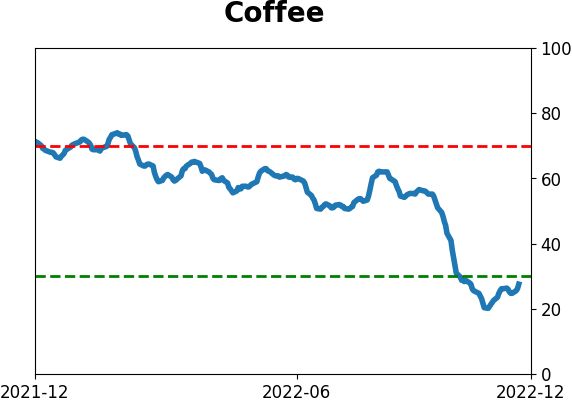
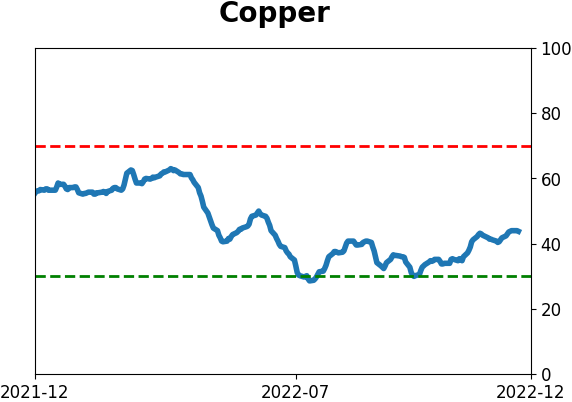
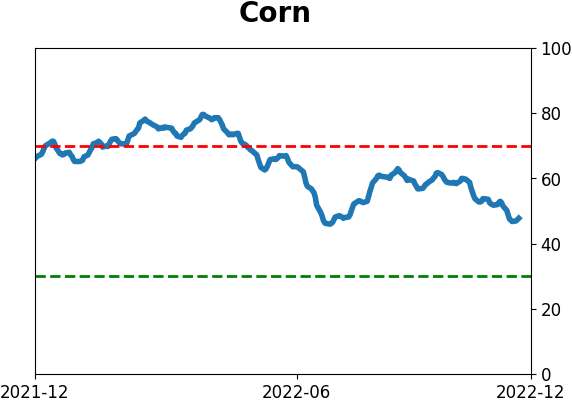
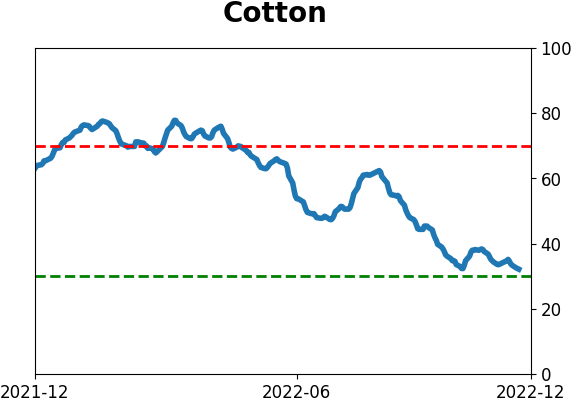
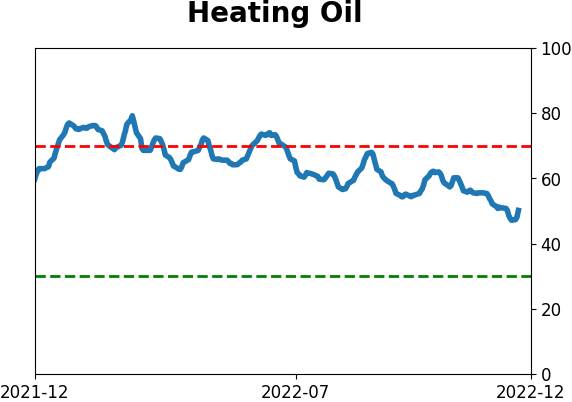
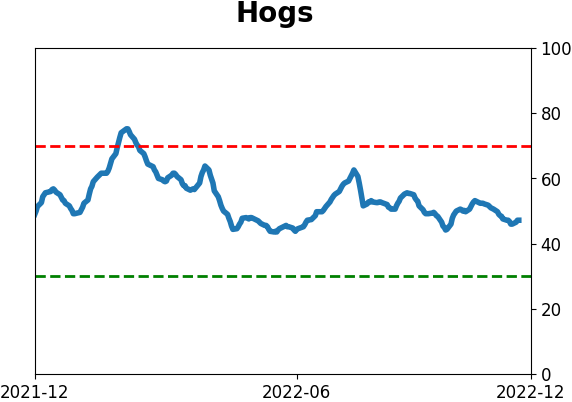
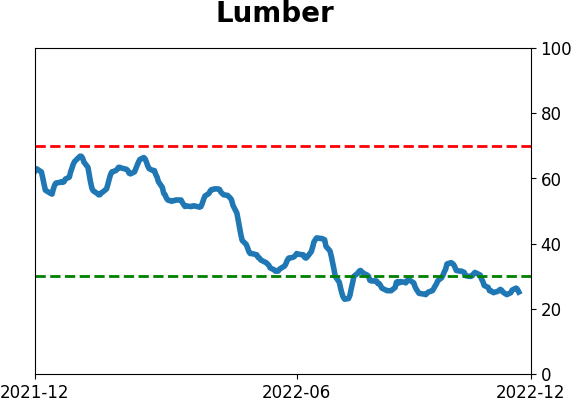
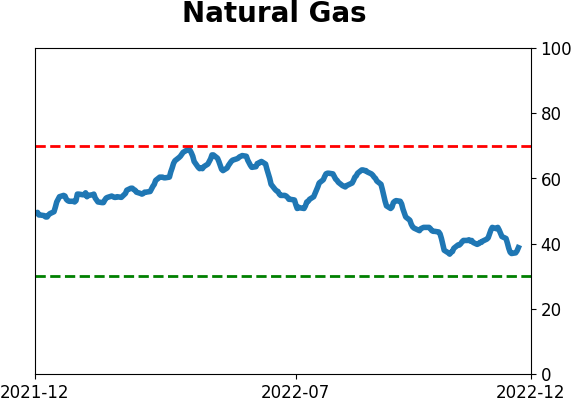
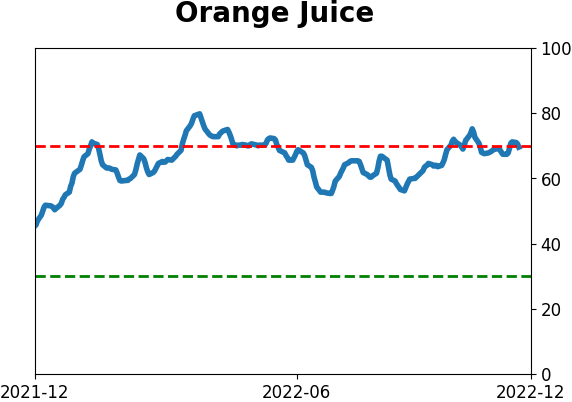
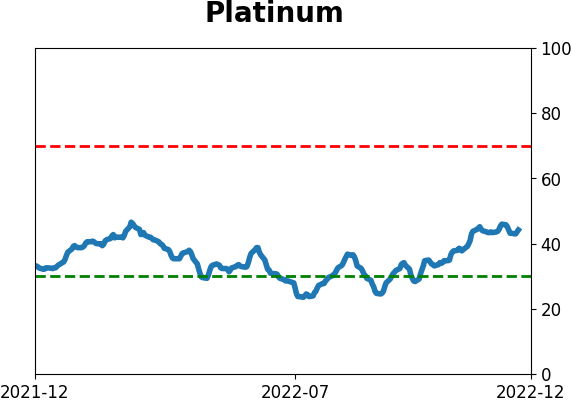
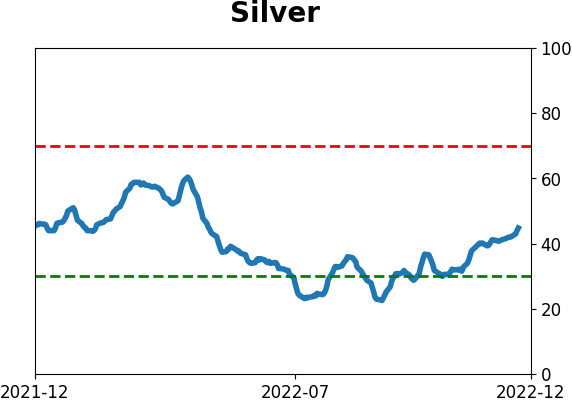
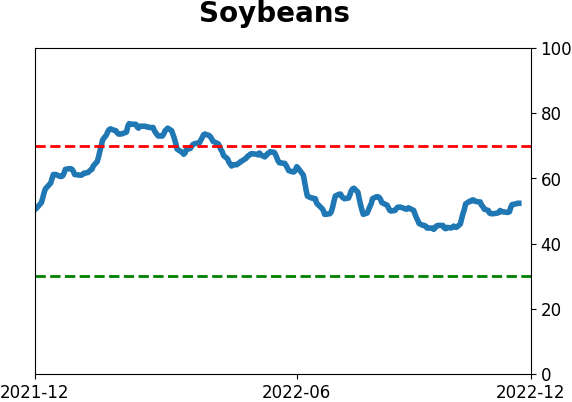
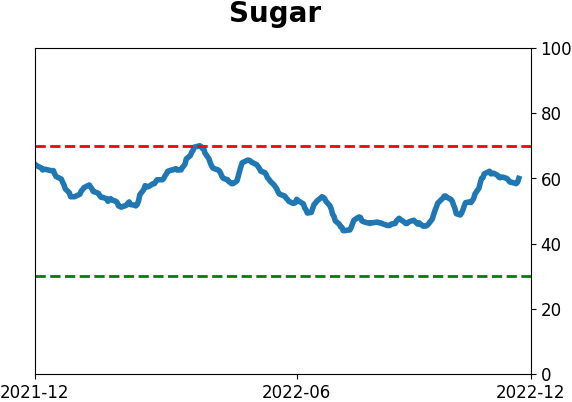
Optimism Index Thumbnails
|
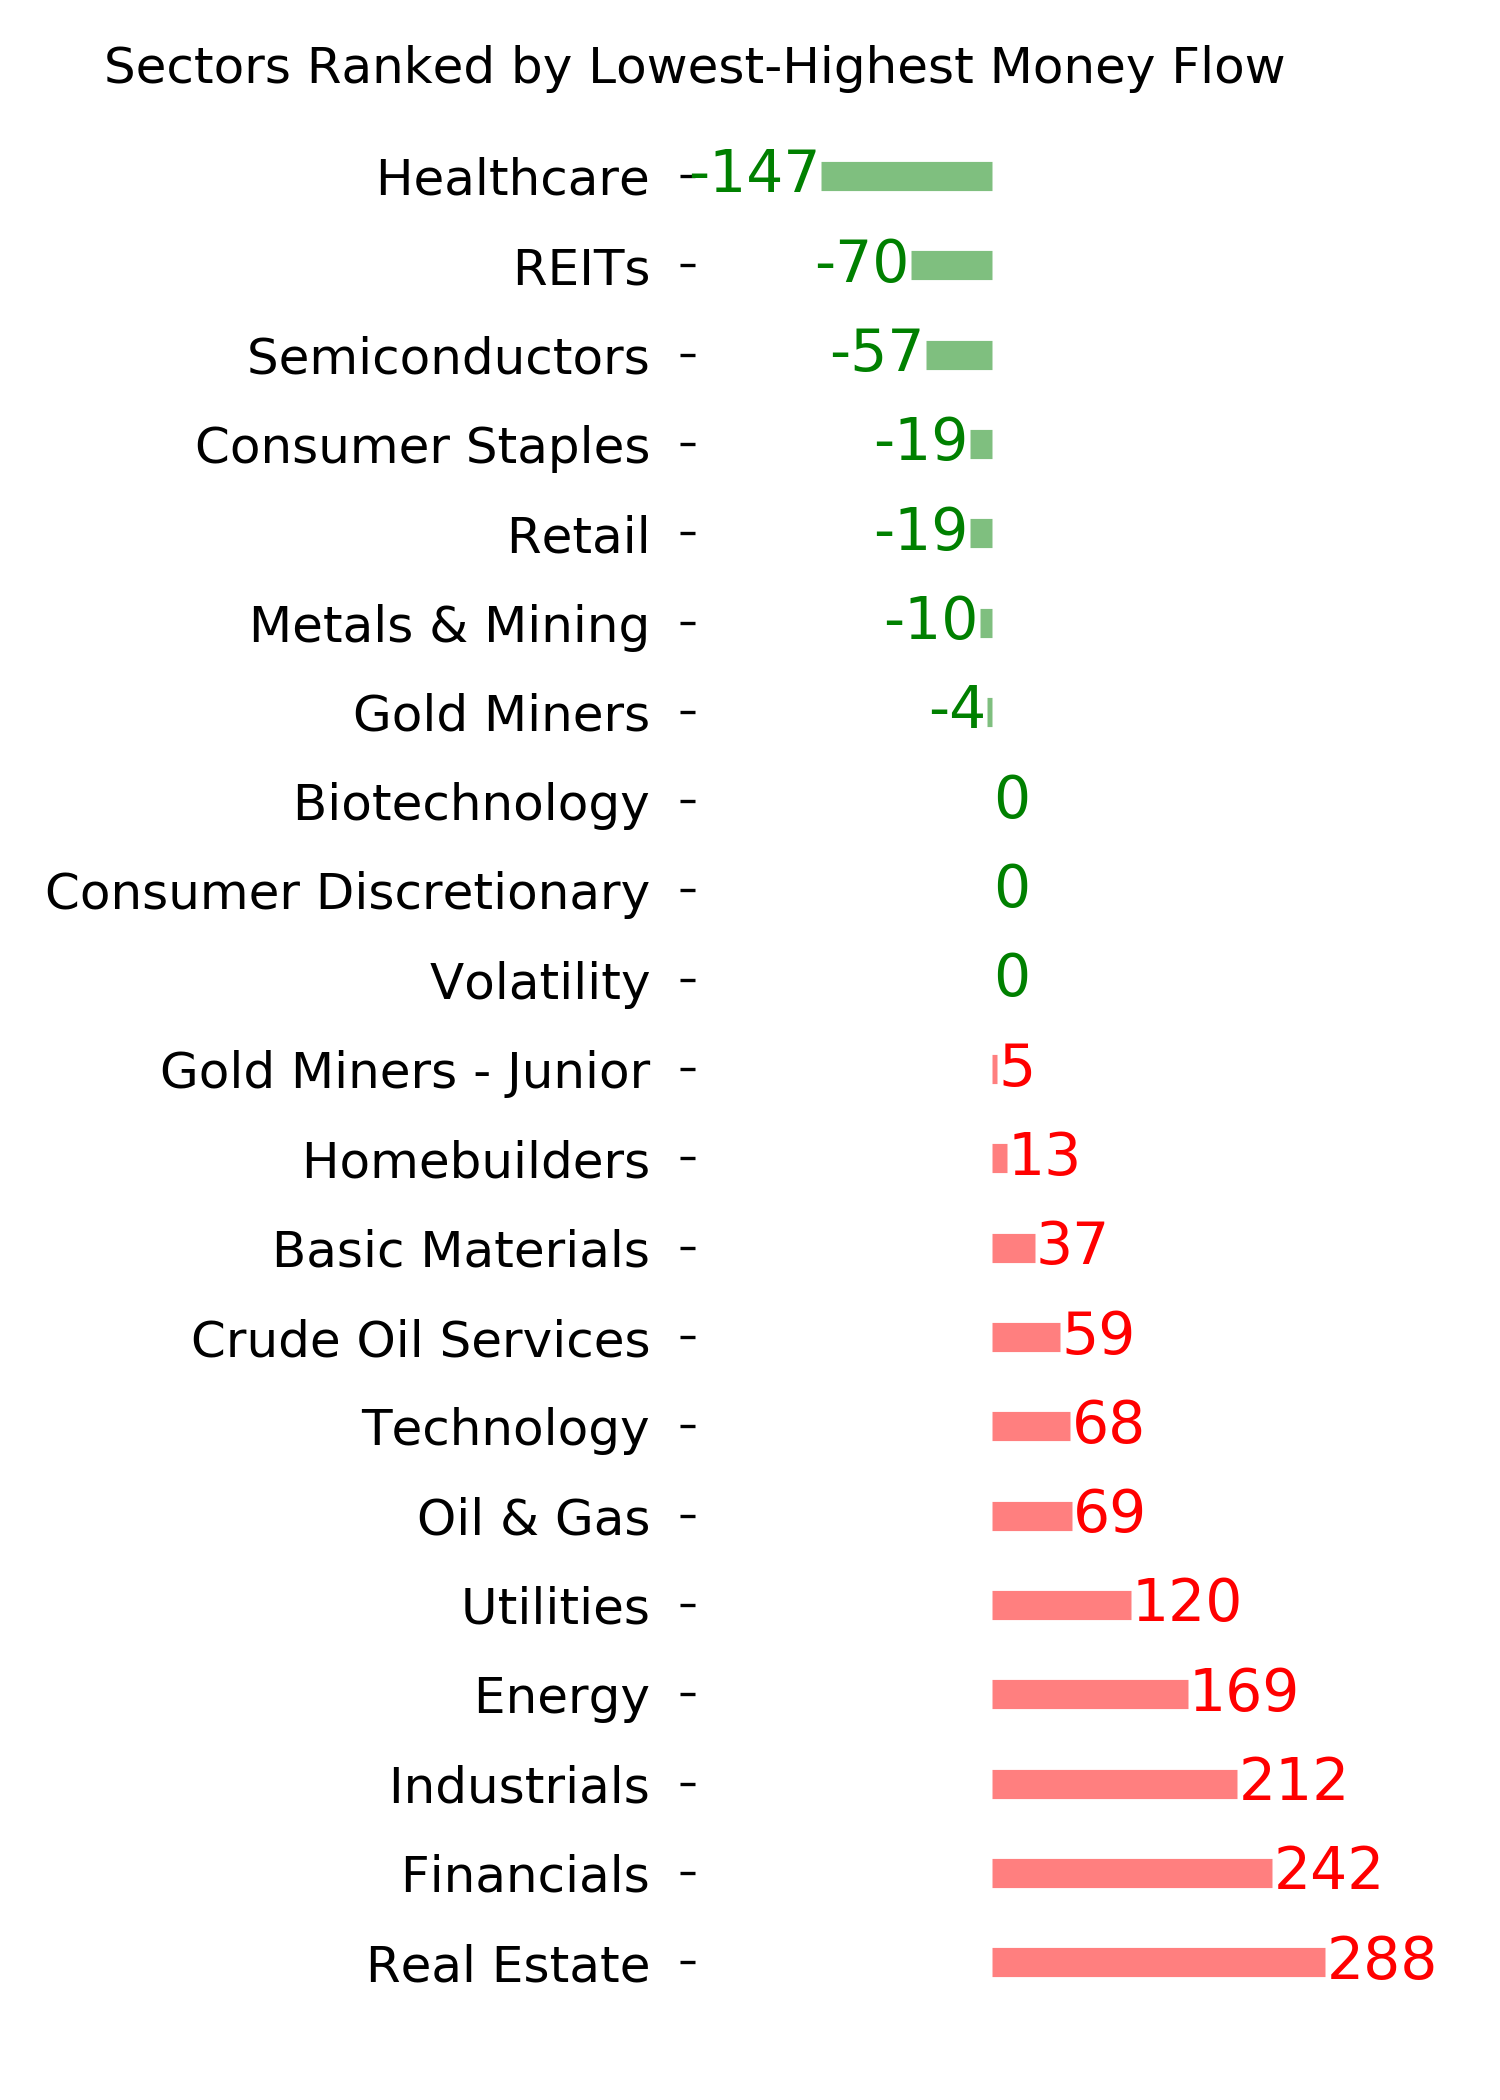
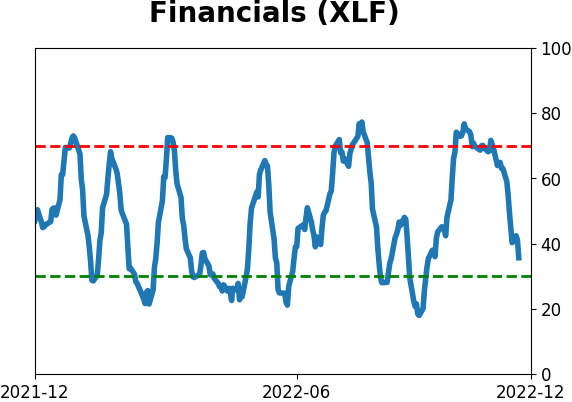
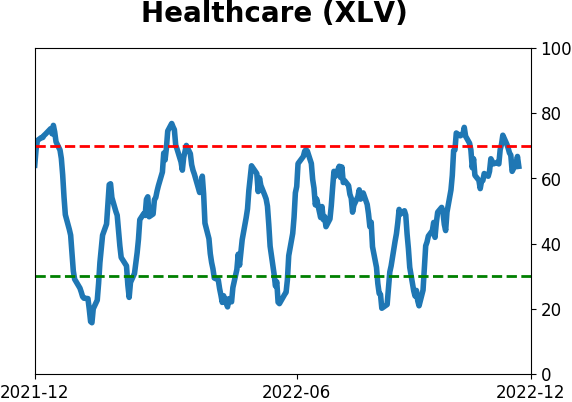
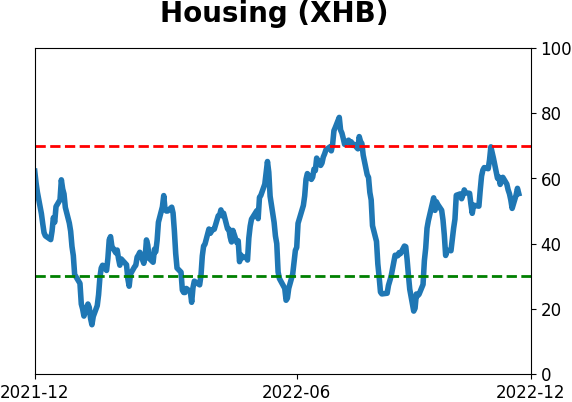
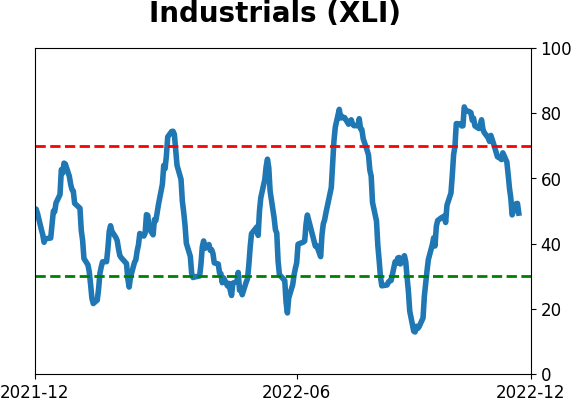
Sector ETF's - 10-Day Moving Average
|
|
|
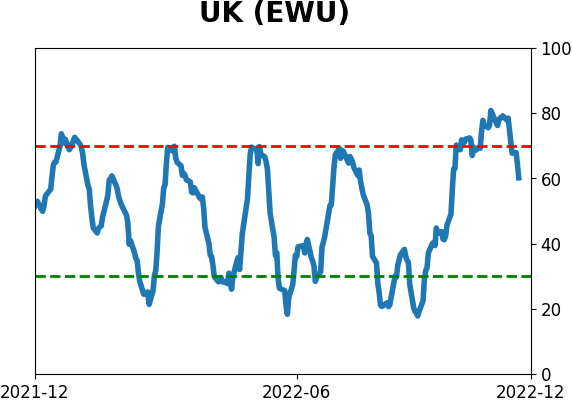
Country ETF's - 10-Day Moving Average
|
|
|
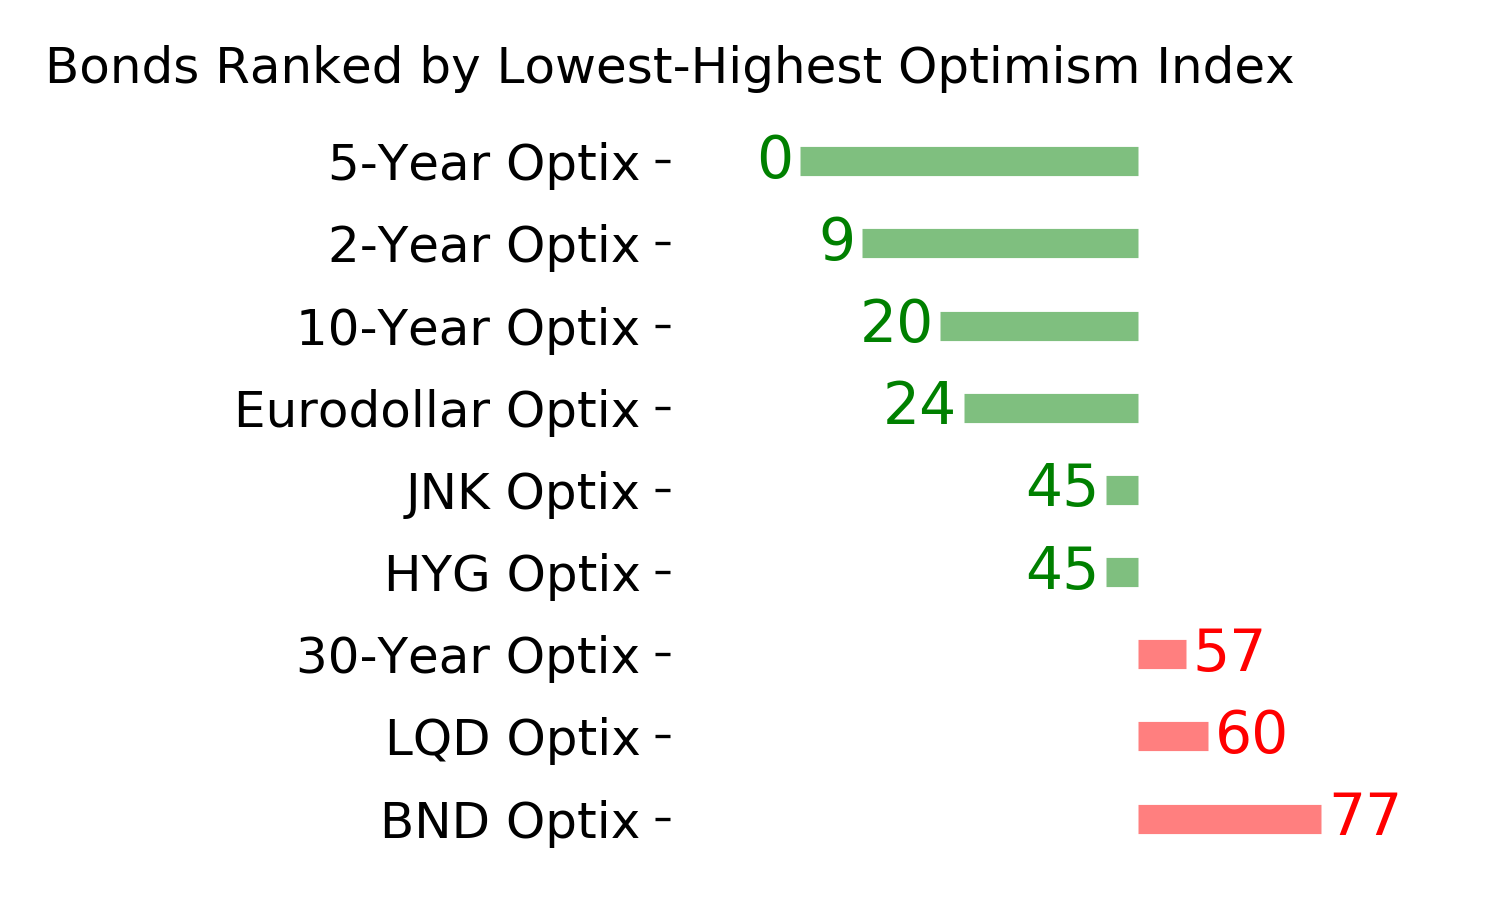
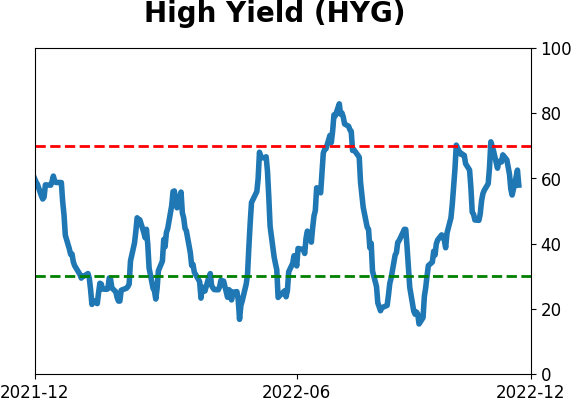
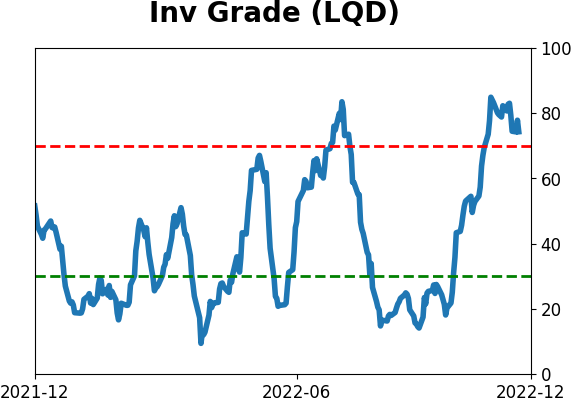
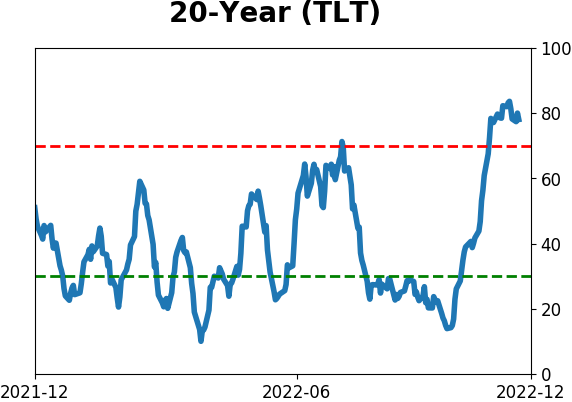
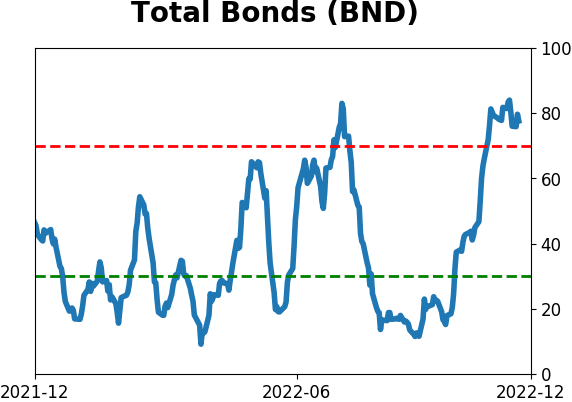
Bond ETF's - 10-Day Moving Average
|
|
|
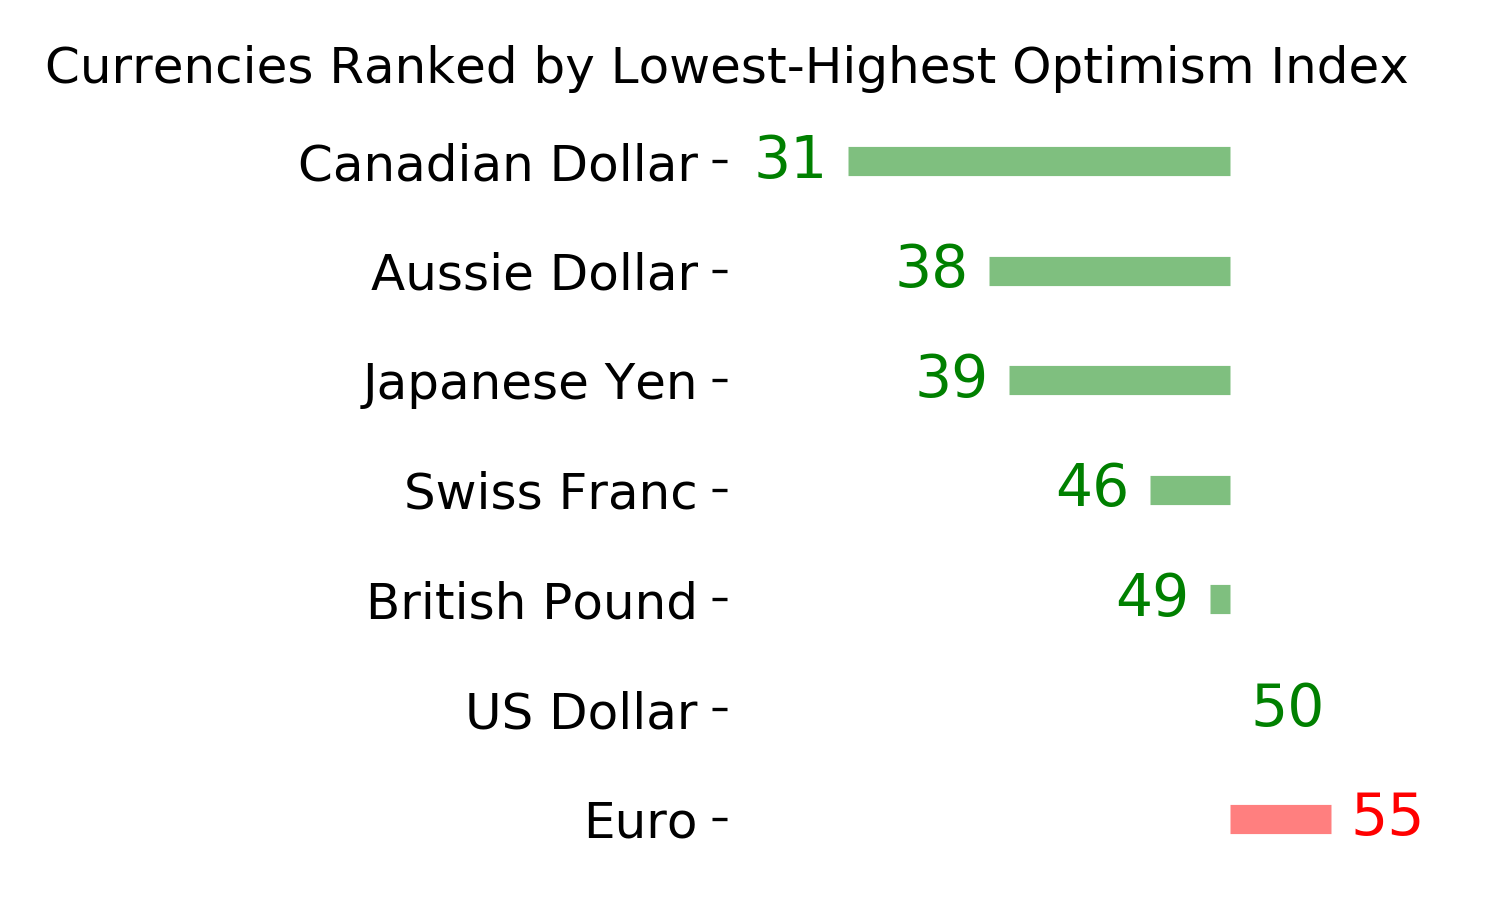
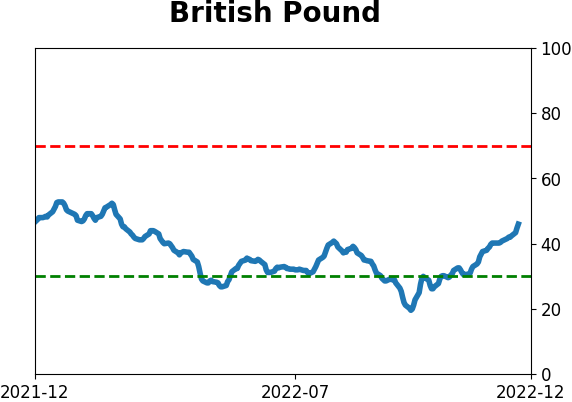
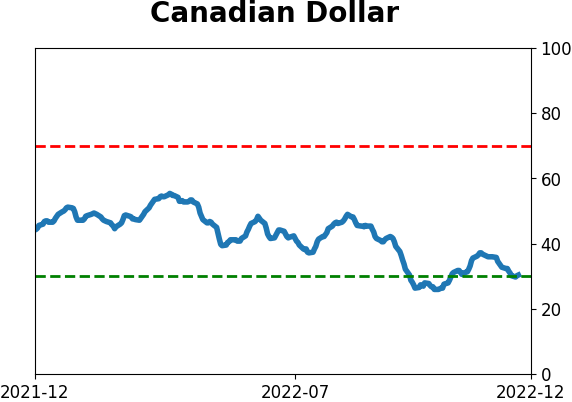
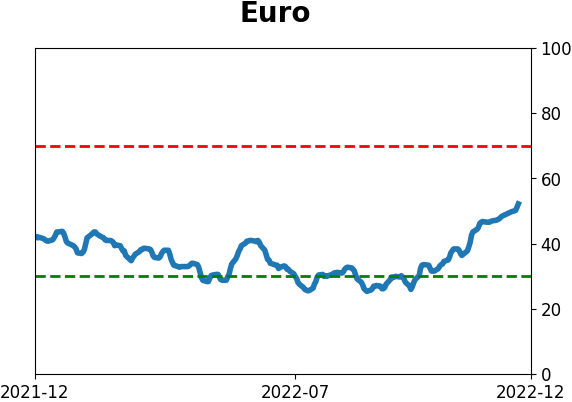
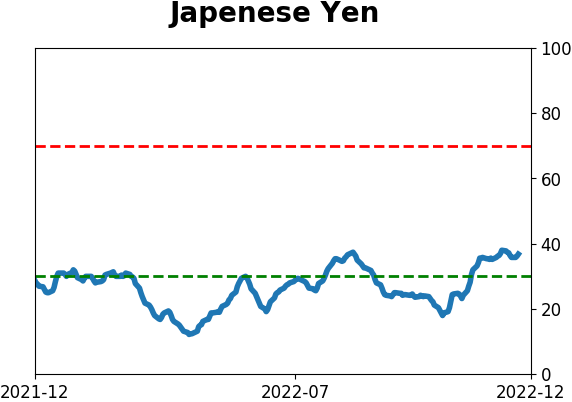
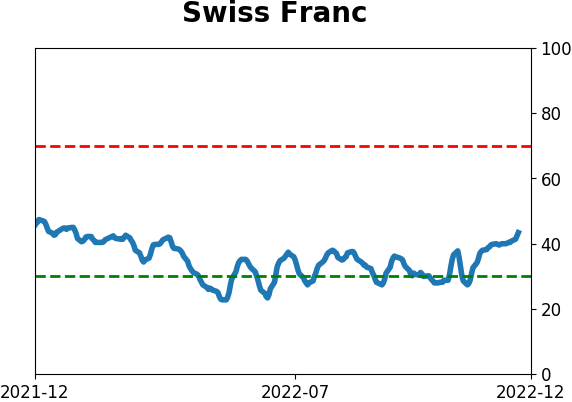
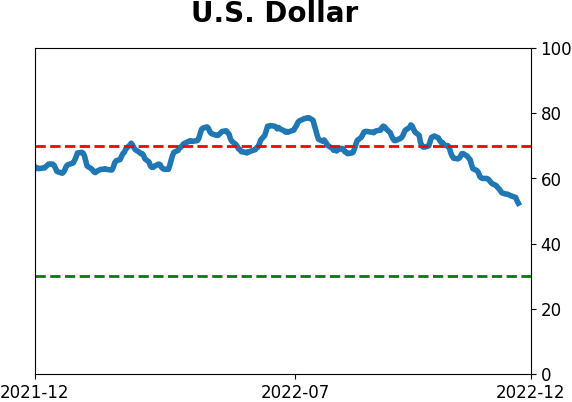
Currency ETF's - 5-Day Moving Average
|
|
|
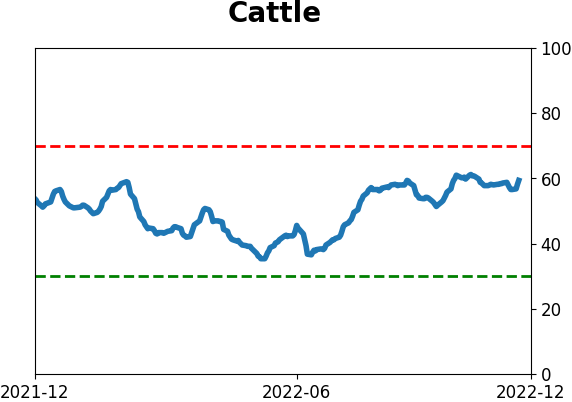
Commodity ETF's - 5-Day Moving Average
|
|