Headlines
|
|
What happens when more than half of indicators show too much optimism:
A couple of times in the past week, more than half of our core indicators were showing that investors are excessively optimistic. That's a stark change from October when more indicators were showing pessimism than optimism. After similar quick cycles from pessimism to extreme optimism, stocks rose over the next 2-3 months.
|
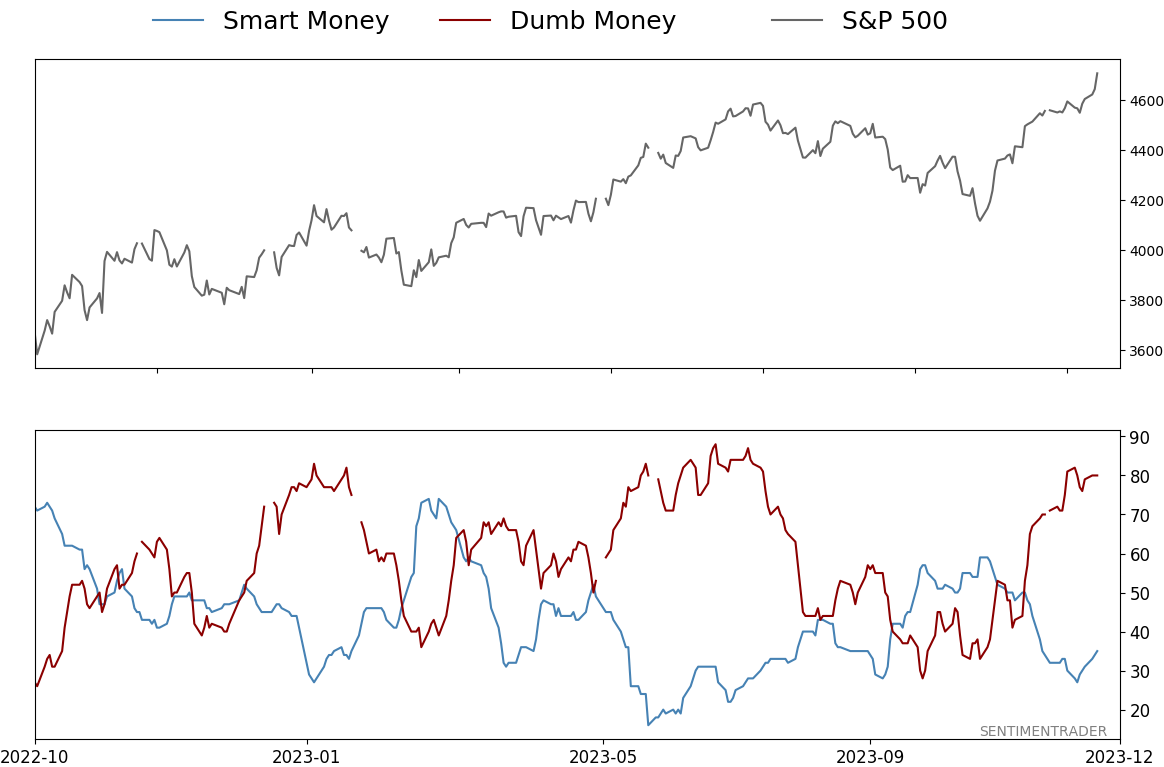
Smart / Dumb Money Confidence
|
Smart Money Confidence: 35%
Dumb Money Confidence: 80%
|
|
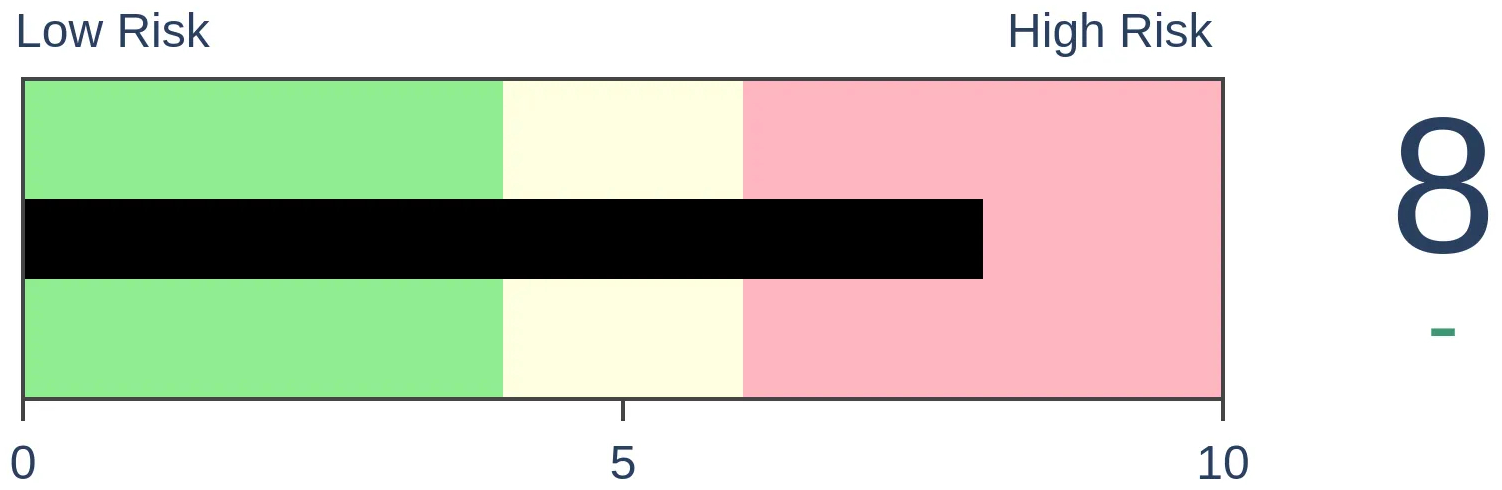
Risk Levels
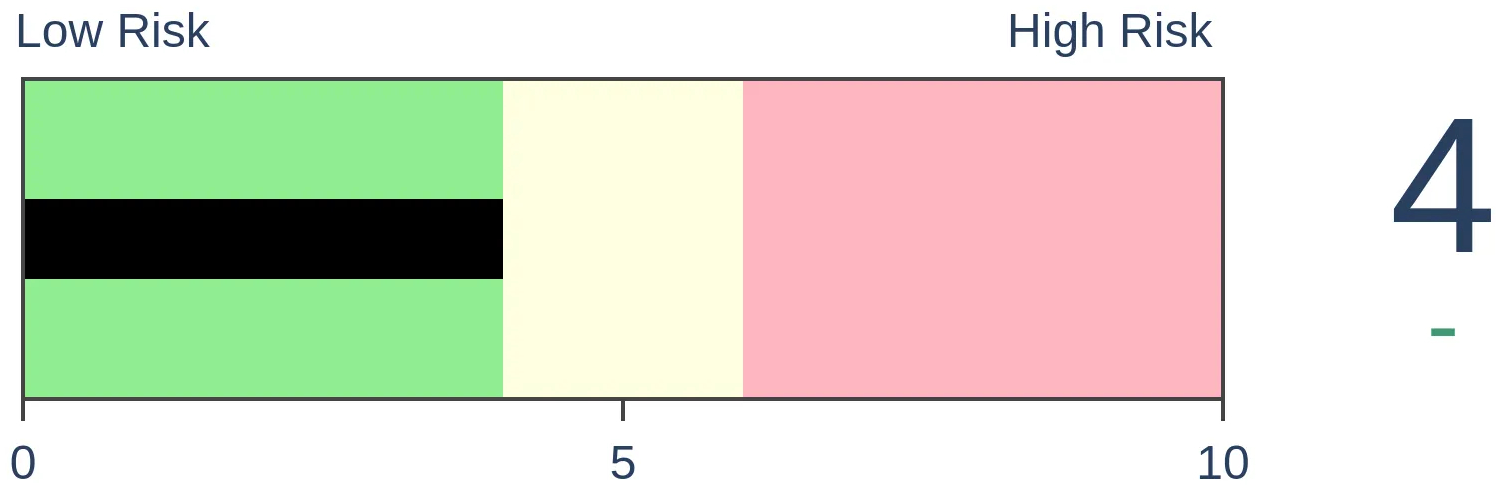
Stocks Short-Term

|
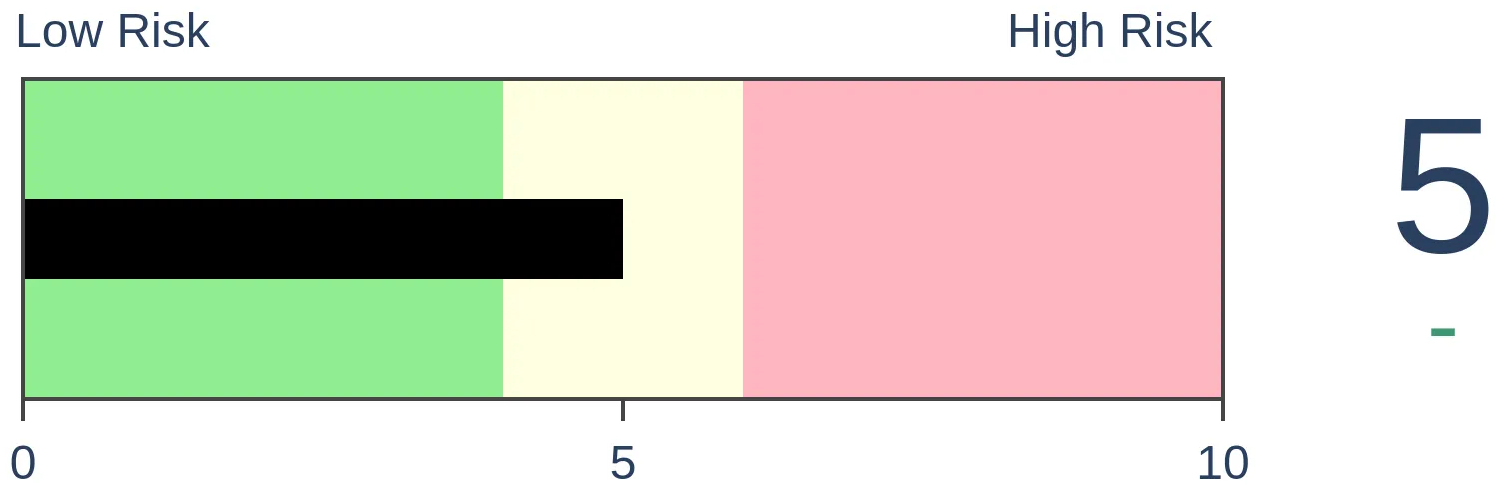
Stocks Medium-Term
|
|
Bonds

|
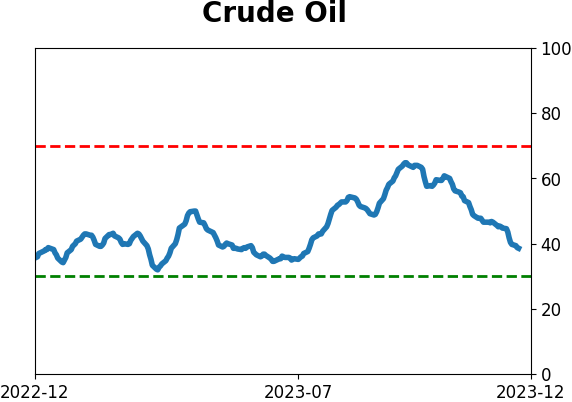
Crude Oil
|
|
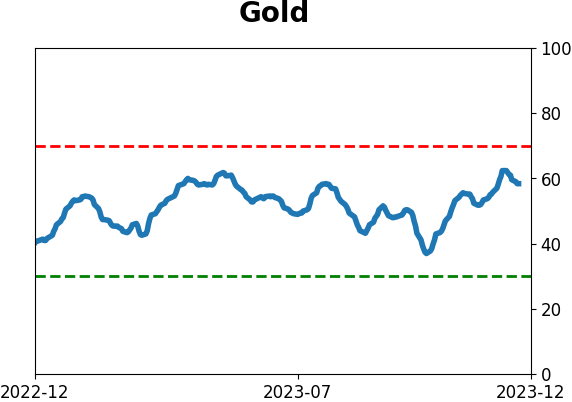
Gold

|
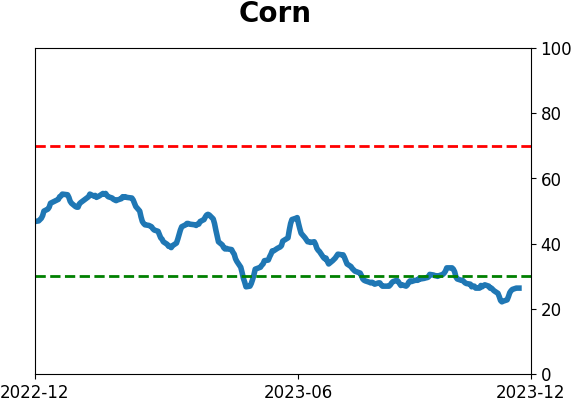
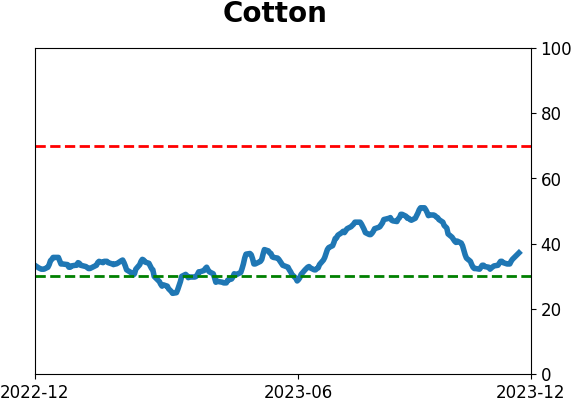
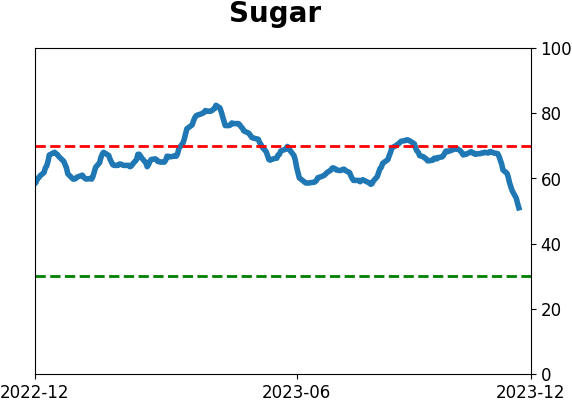
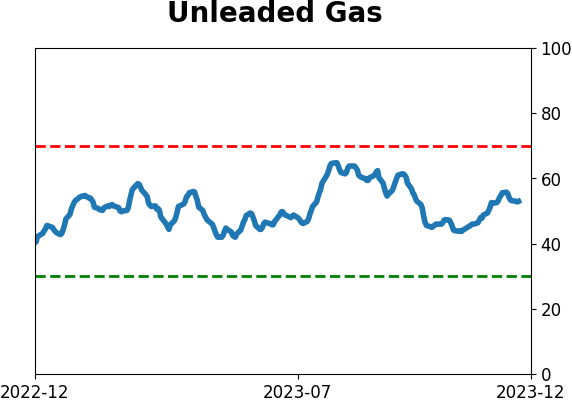
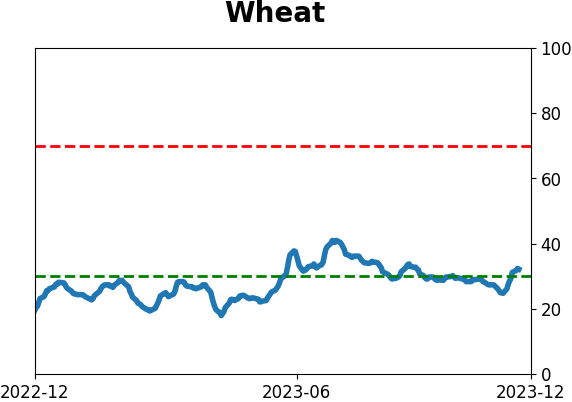
Agriculture
|
|
Research
By Jason Goepfert
BOTTOM LINE
A couple of times in the past week, more than half of our core indicators were showing that investors are excessively optimistic. That's a stark change from October when more indicators were showing pessimism than optimism. After similar quick cycles from pessimism to extreme optimism, stocks rose over the next 2-3 months.
FORECAST / TIMEFRAME
None
|
Key points:
- More than half of our core indicators recently showed excessive optimism, while few showed pessimism
- The spread between those indicators recently reached the 2nd most extreme level in two years
- When we cycle from more indicators showing pessimism to many more showing optimism in a quick cycle, it has been bullish
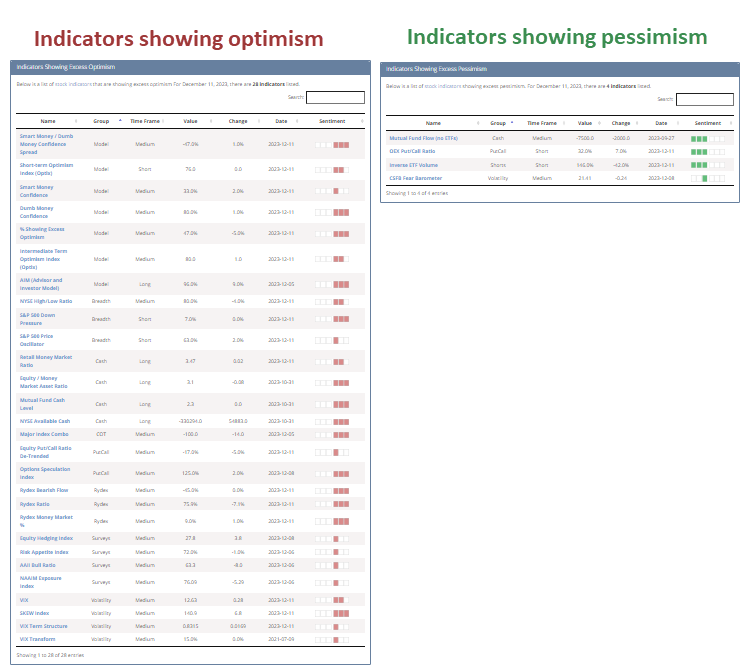
A lot more indicators are showing excessive optimism than pessimism
Even though it seems like consumers and investors want reasons to be pessimistic, and (depending on the source) they're saying they're pessimistic - or at least not all that optimistic - some objective indicators show that they're buying stocks, even if they're holding their noses.
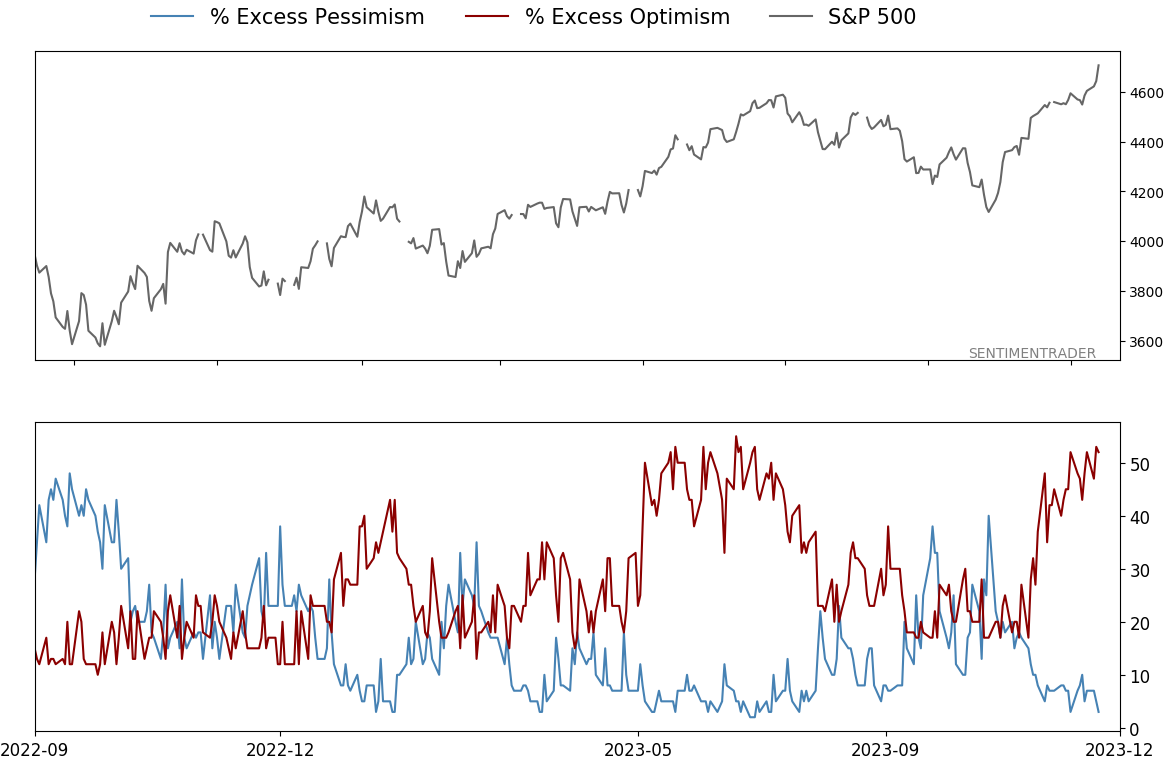
After several potential warnings went unheated and stocks continued to rise, more indicators registered optimistic extremes this week. Most models we follow, including Smart/Dumb Money Confidence and Fear & Greed, show excessive optimism. A simple look at the number of indicators registered an optimistic extreme versus pessimistic extreme from the Dashboard shows how unbalanced one side is.
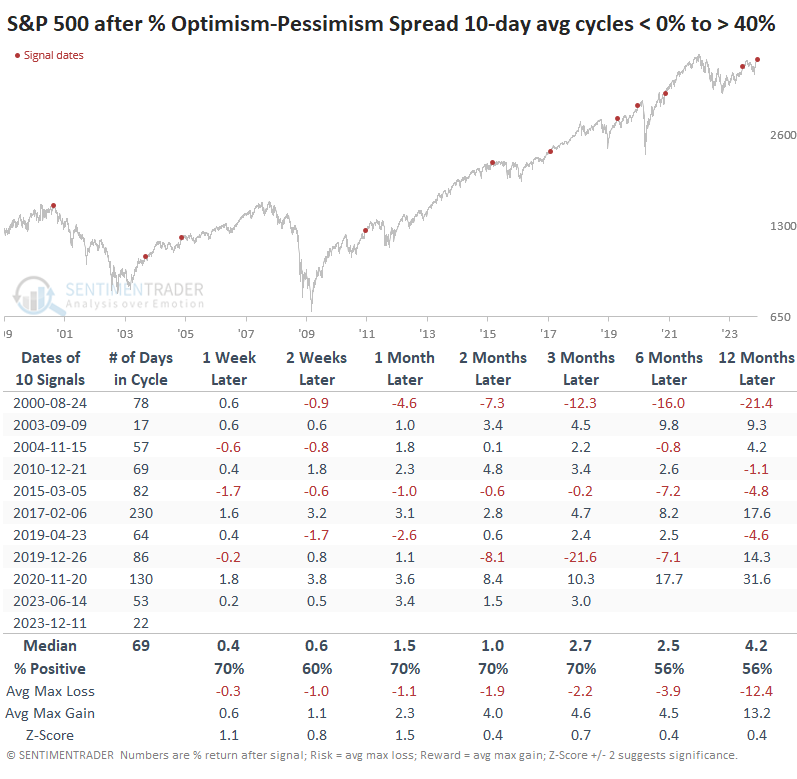
The percentage of the core indicators showing optimism minus those showing pessimism widened well into extreme territory last week and has stayed there. A 10-day moving average of the spread has now cycled from negative (more pessimistic than optimistic indicators) to +40%, the 2nd-highest level in two years.
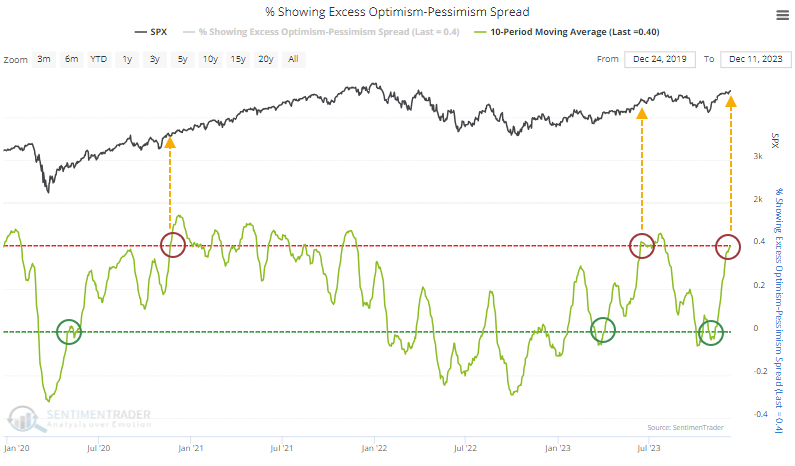
Returns in the S&P 500 after the spread cycles like this were mostly positive. The sweet spot was 1-3 months after it reached extreme optimism territory, with the S&P rising 70% of the time. There were two large losses out of the ten signals.
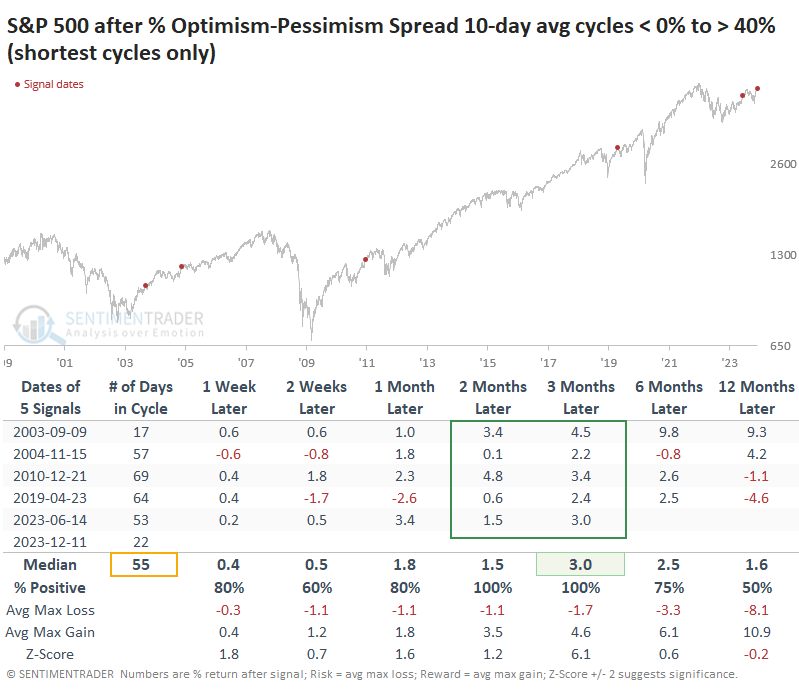
As we often see, context can be critical, especially how quickly these sentiment cycles occur. The table below filters the table to include only the quickest cycles when it took about three months or less to cycle from negative to extreme optimism.
While the sample size becomes uncomfortably tiny, the S&P's behavior after these quick cycles was pretty consistent. It didn't suffer any losses over the next two to three months, with returns that were all within a couple of percent of each other.
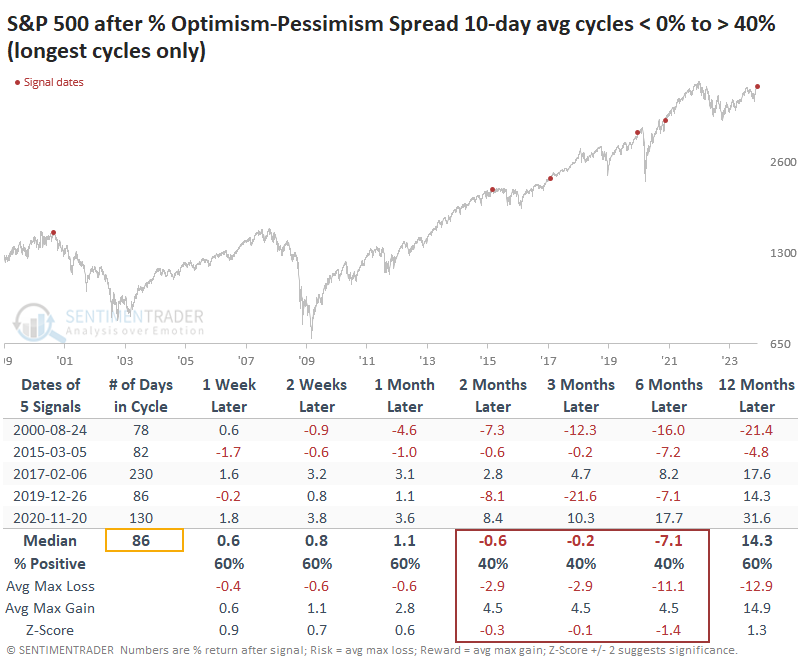
Contrast that with the cycles that took the longest. After these slow-rolling cycles, the S&P's returns were more bifurcated, with three losses and a couple of gains over the medium-term.
What the research tells us...
We've examined evidence of excessive optimism among indicators or models several times recently. The conclusions are typically not what knee-jerk contrarians expect, but that's the difference between bull and bear markets. During bull markets, excessive optimism often results in slightly below-average annualized returns at worst. During bear markets, well, optimism doesn't have a chance to get this excessive, which is a point in favor of the idea that this isn't an ongoing bear market.
We've presented evidence since October 2022 why that's likely the case, and it hasn't changed much. The fact that optimism has rapidly returned to excessive territory after modest pessimism in October suggests that while returns might be moderate going forward, there isn't much evidence that the peak and crash that doomers are hoping for is likely.
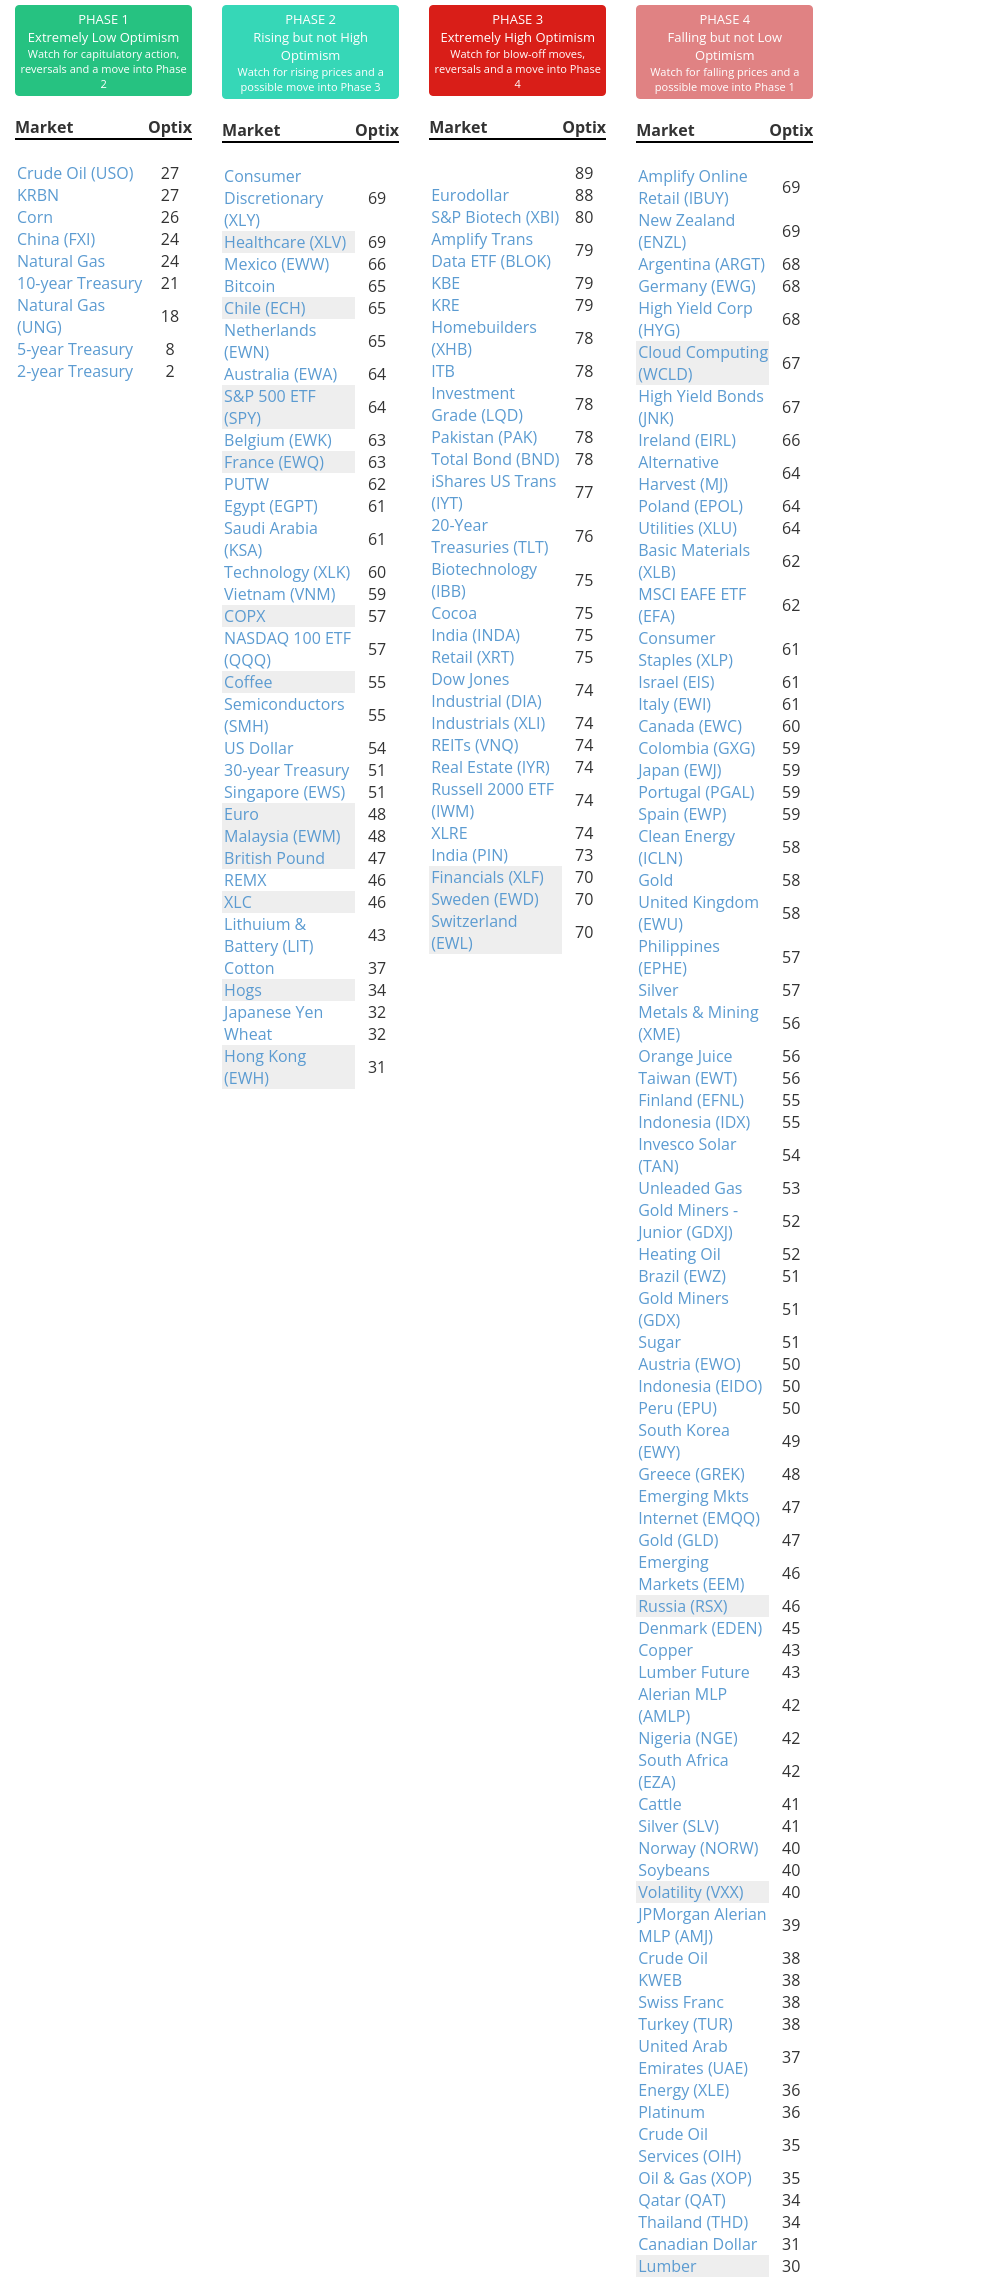
Indicators at Extremes
Phase Table
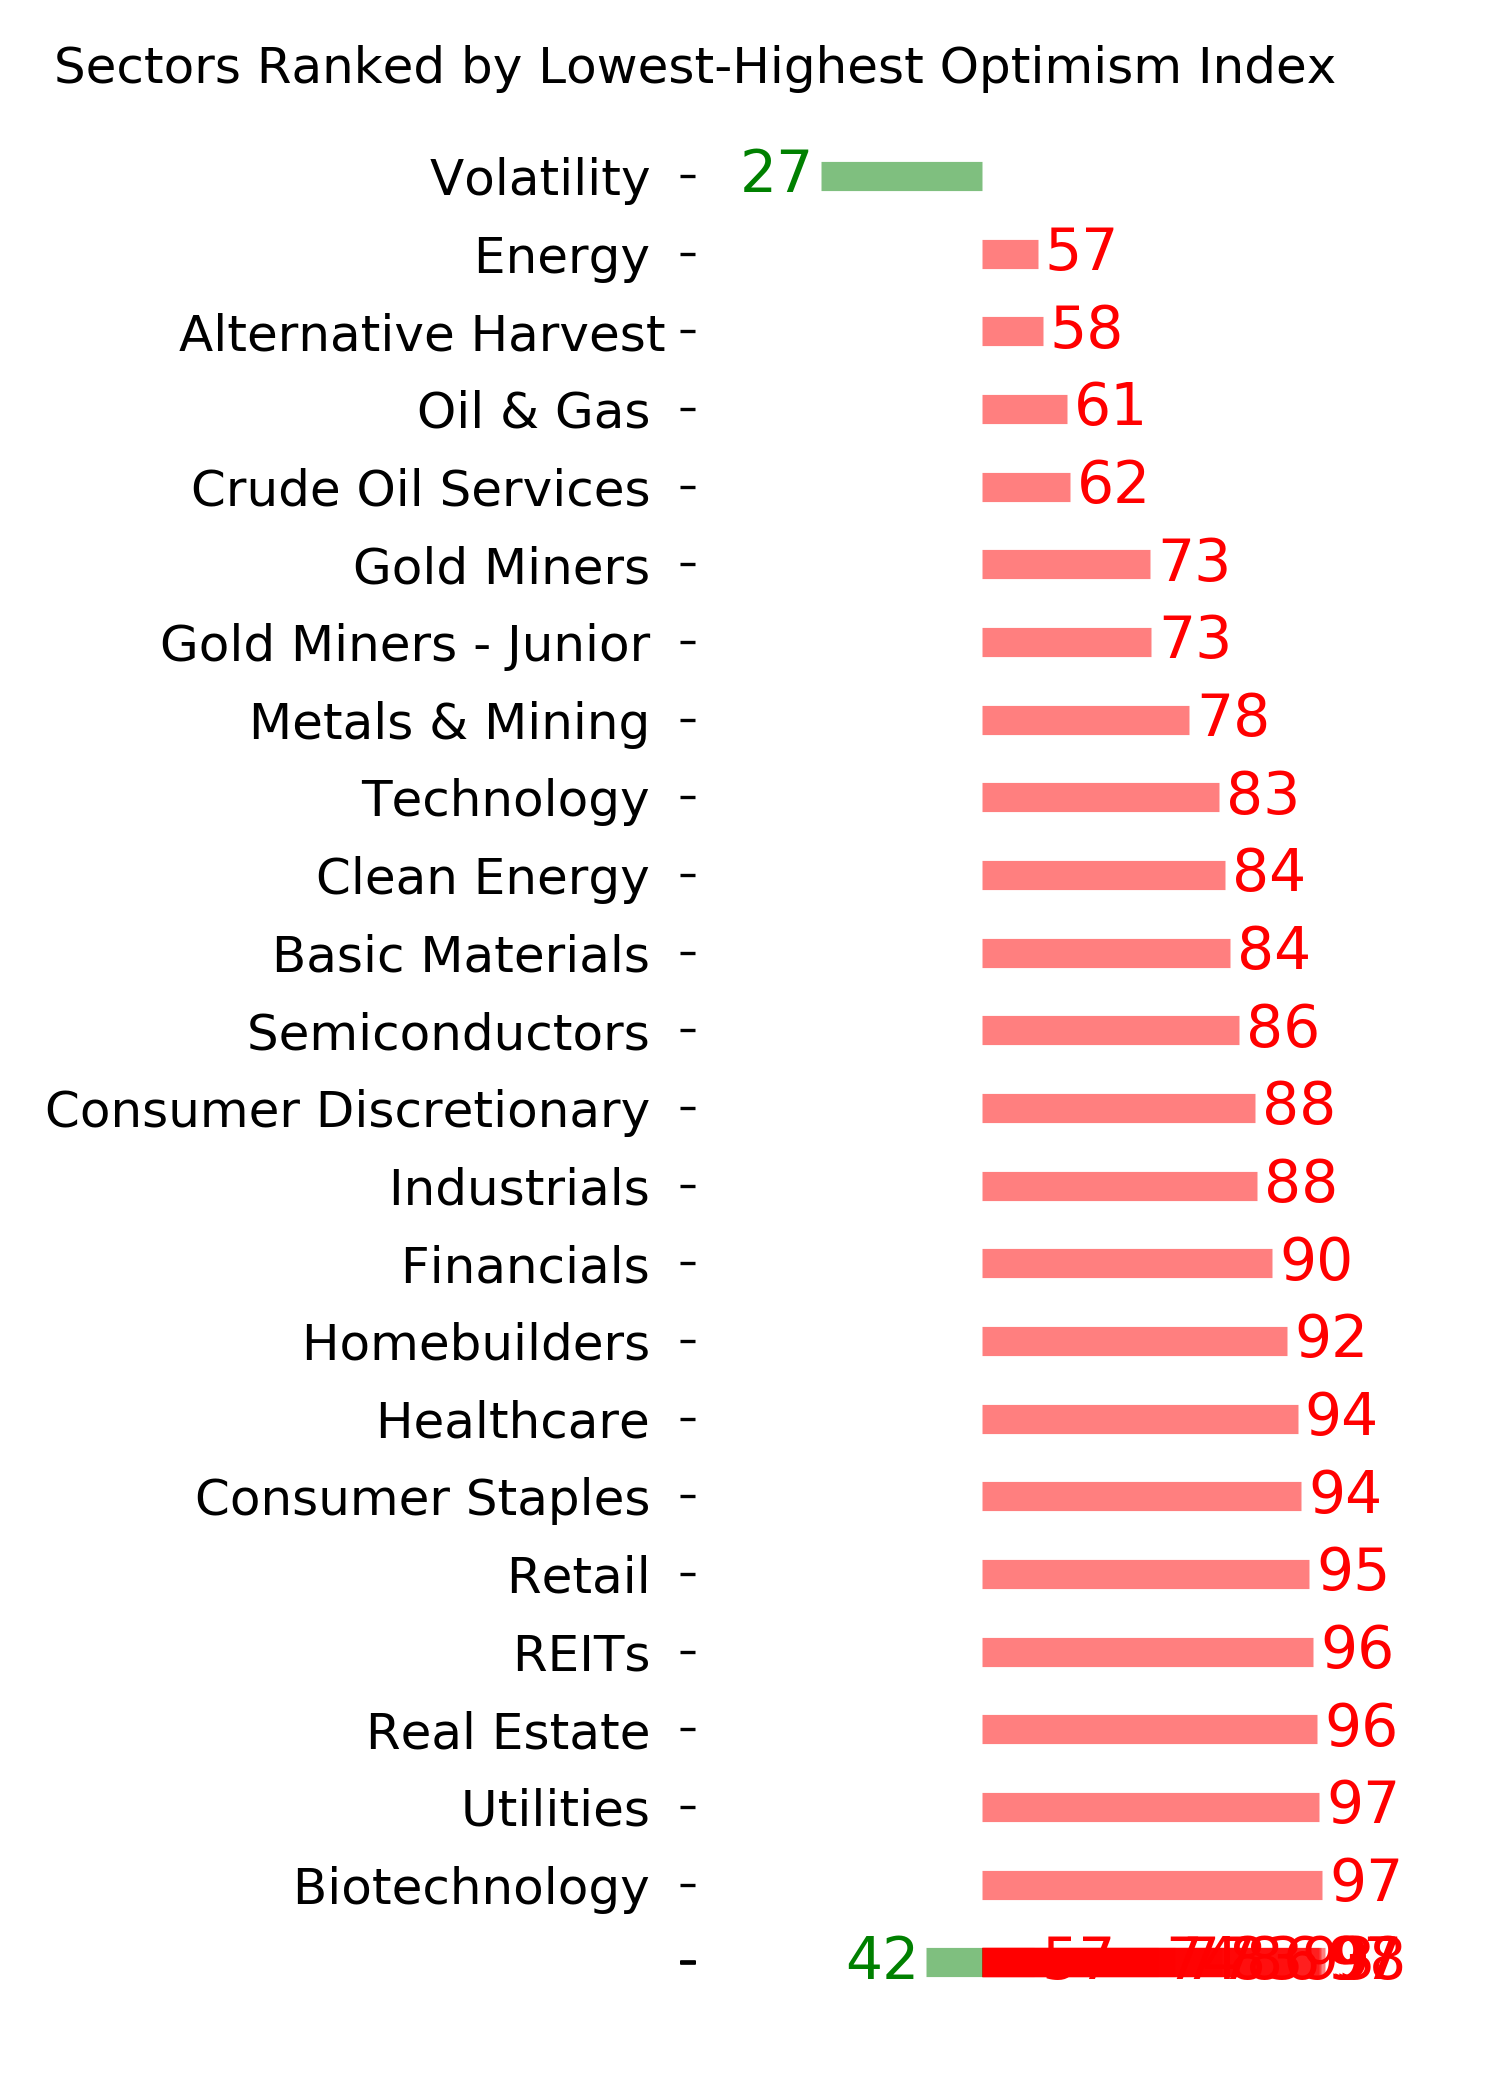
Ranks
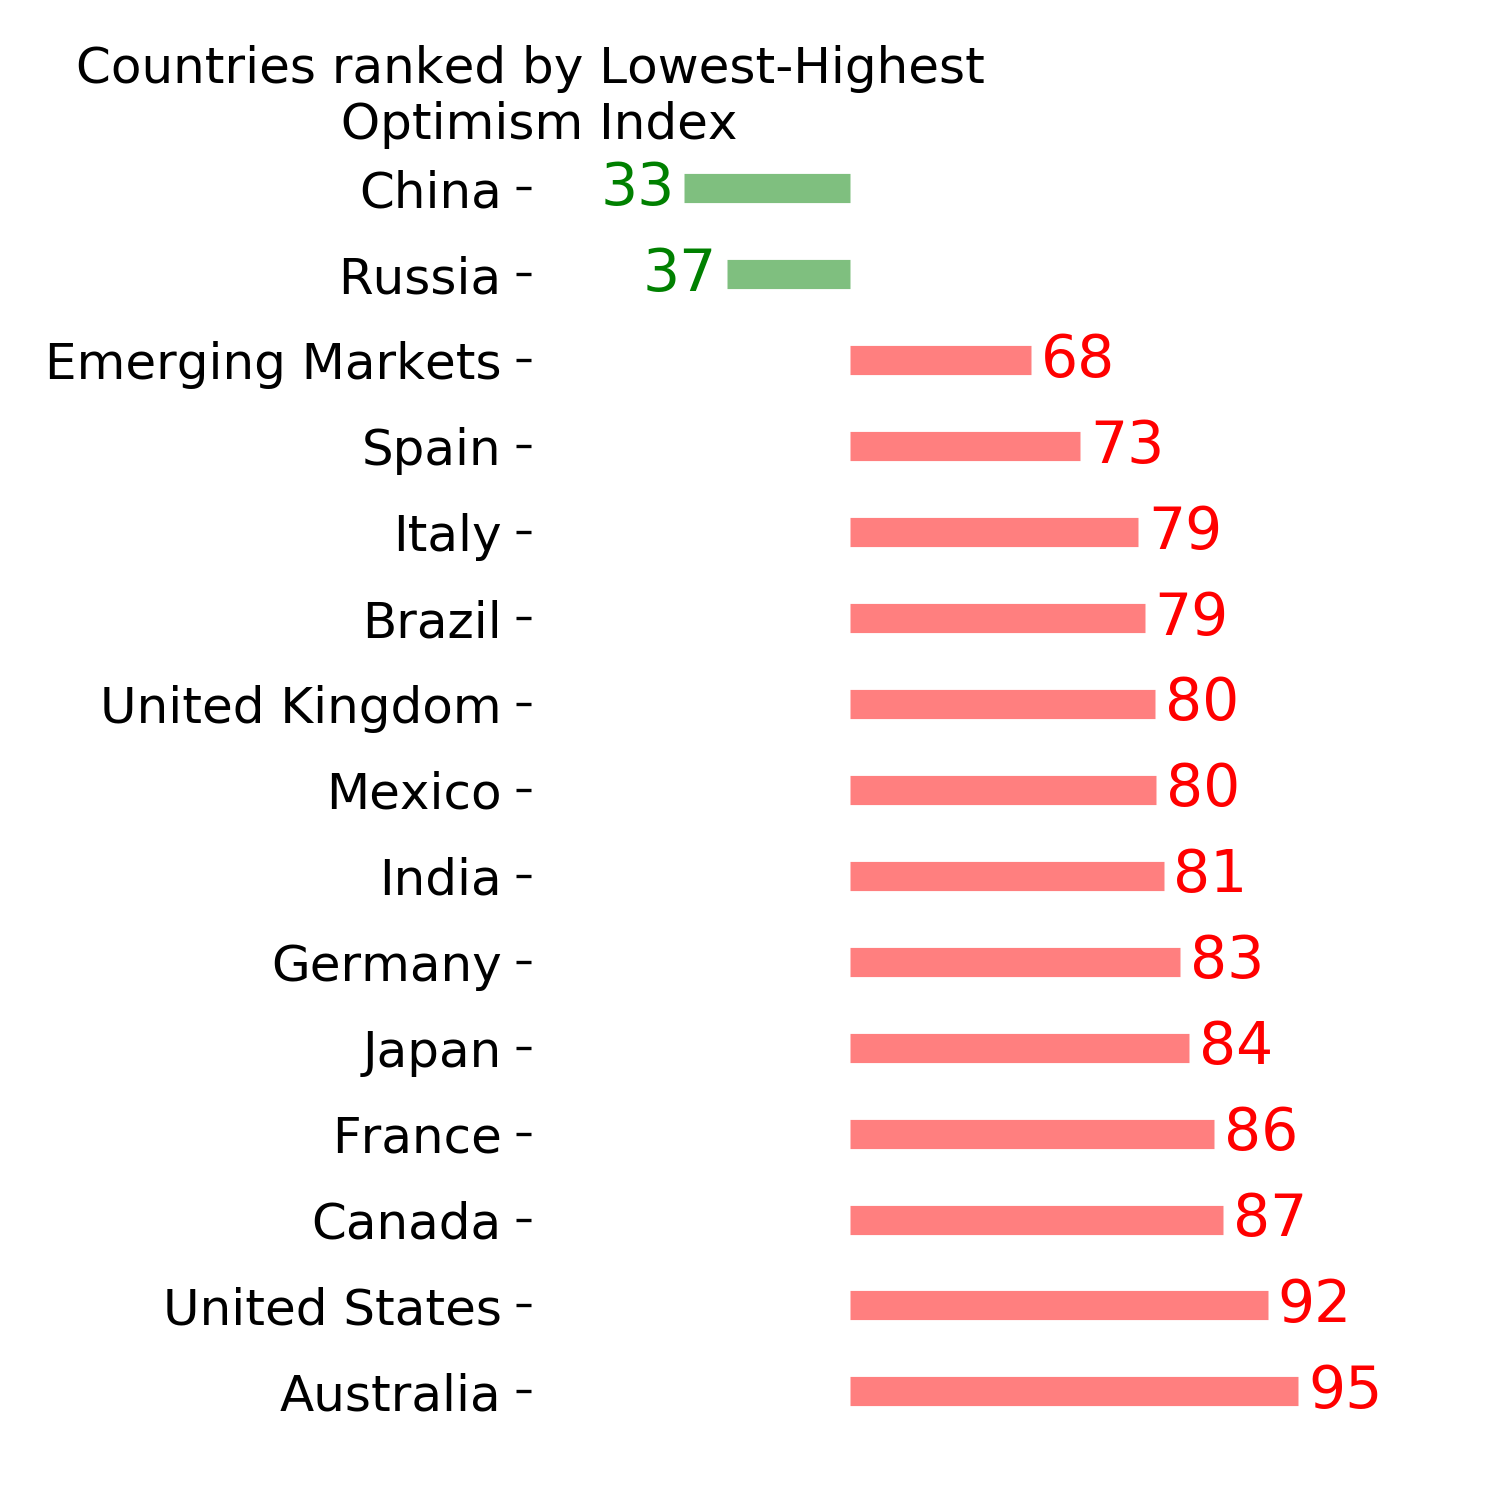
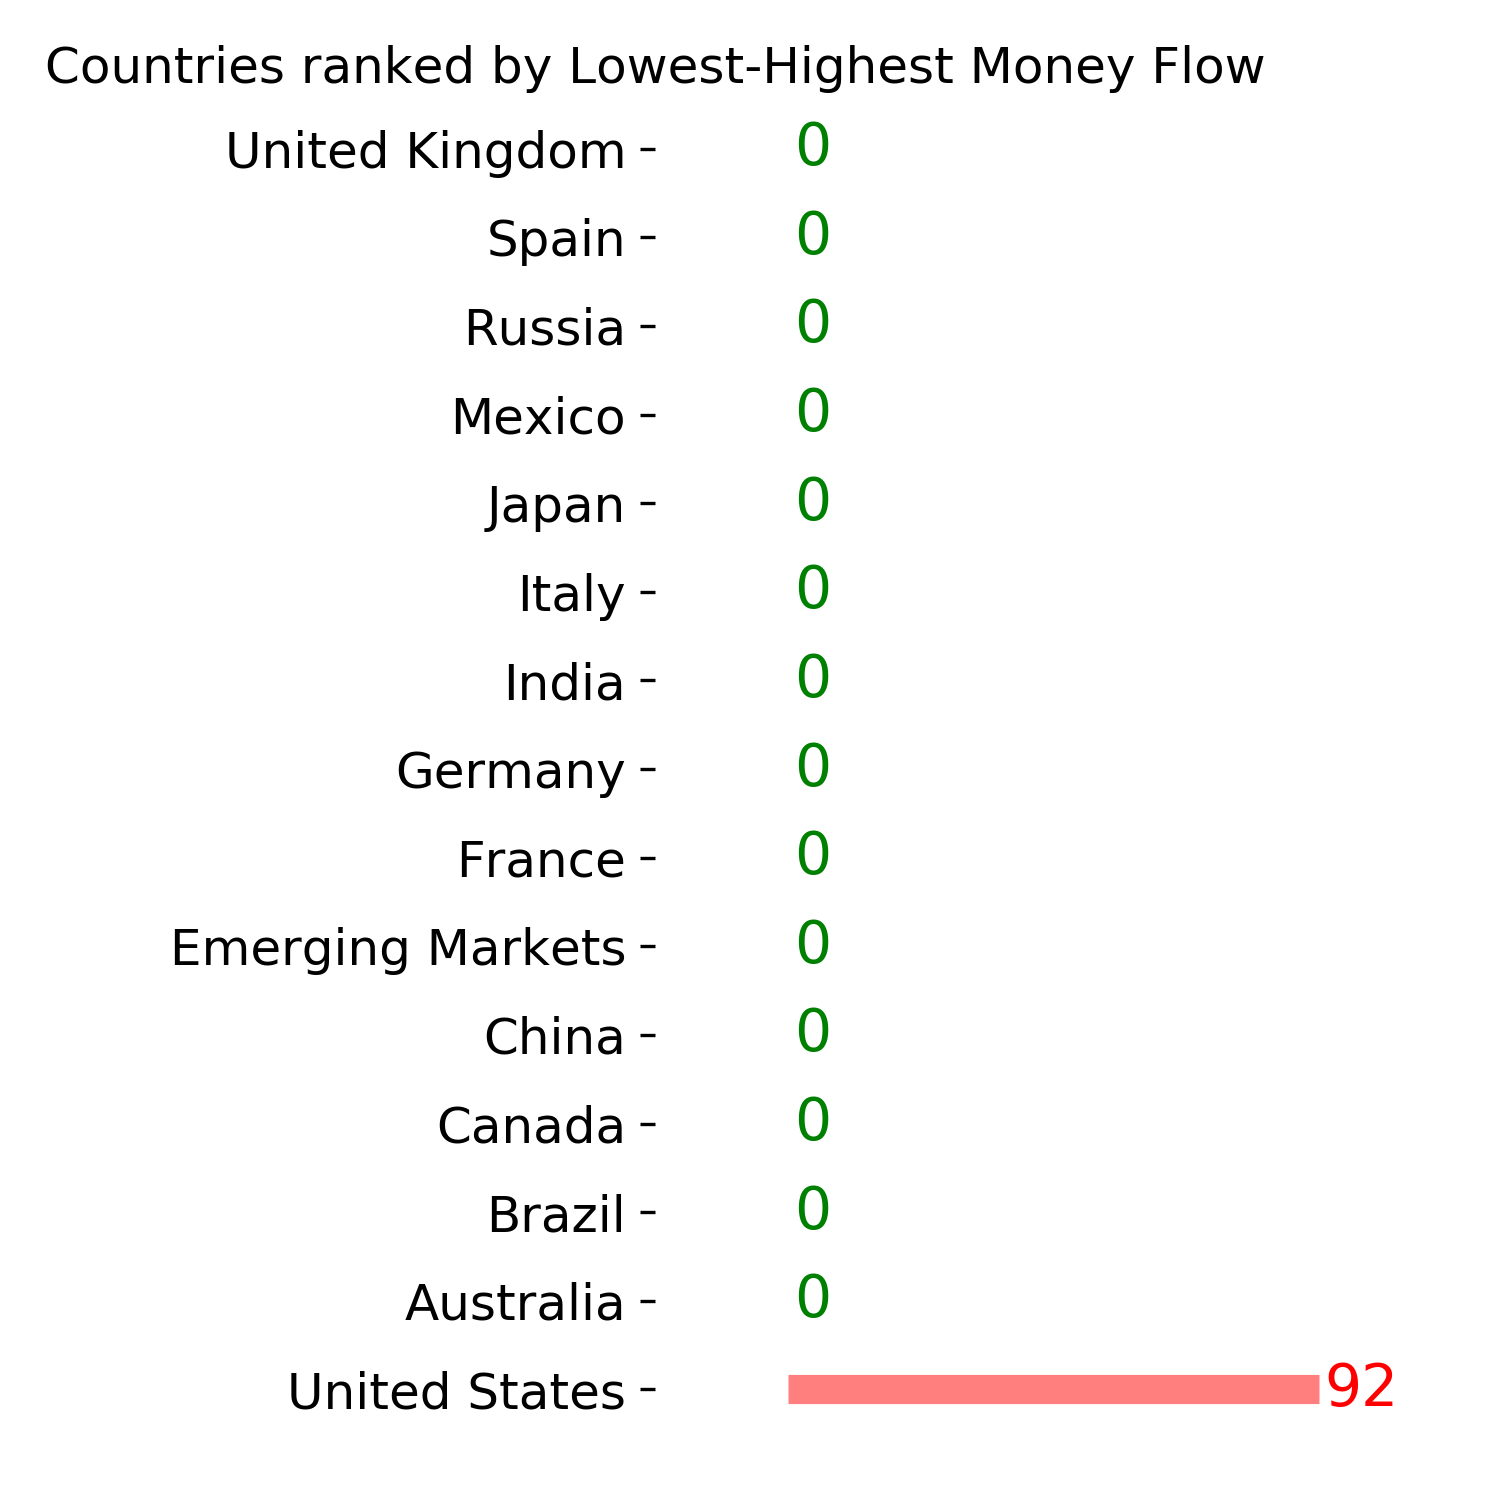
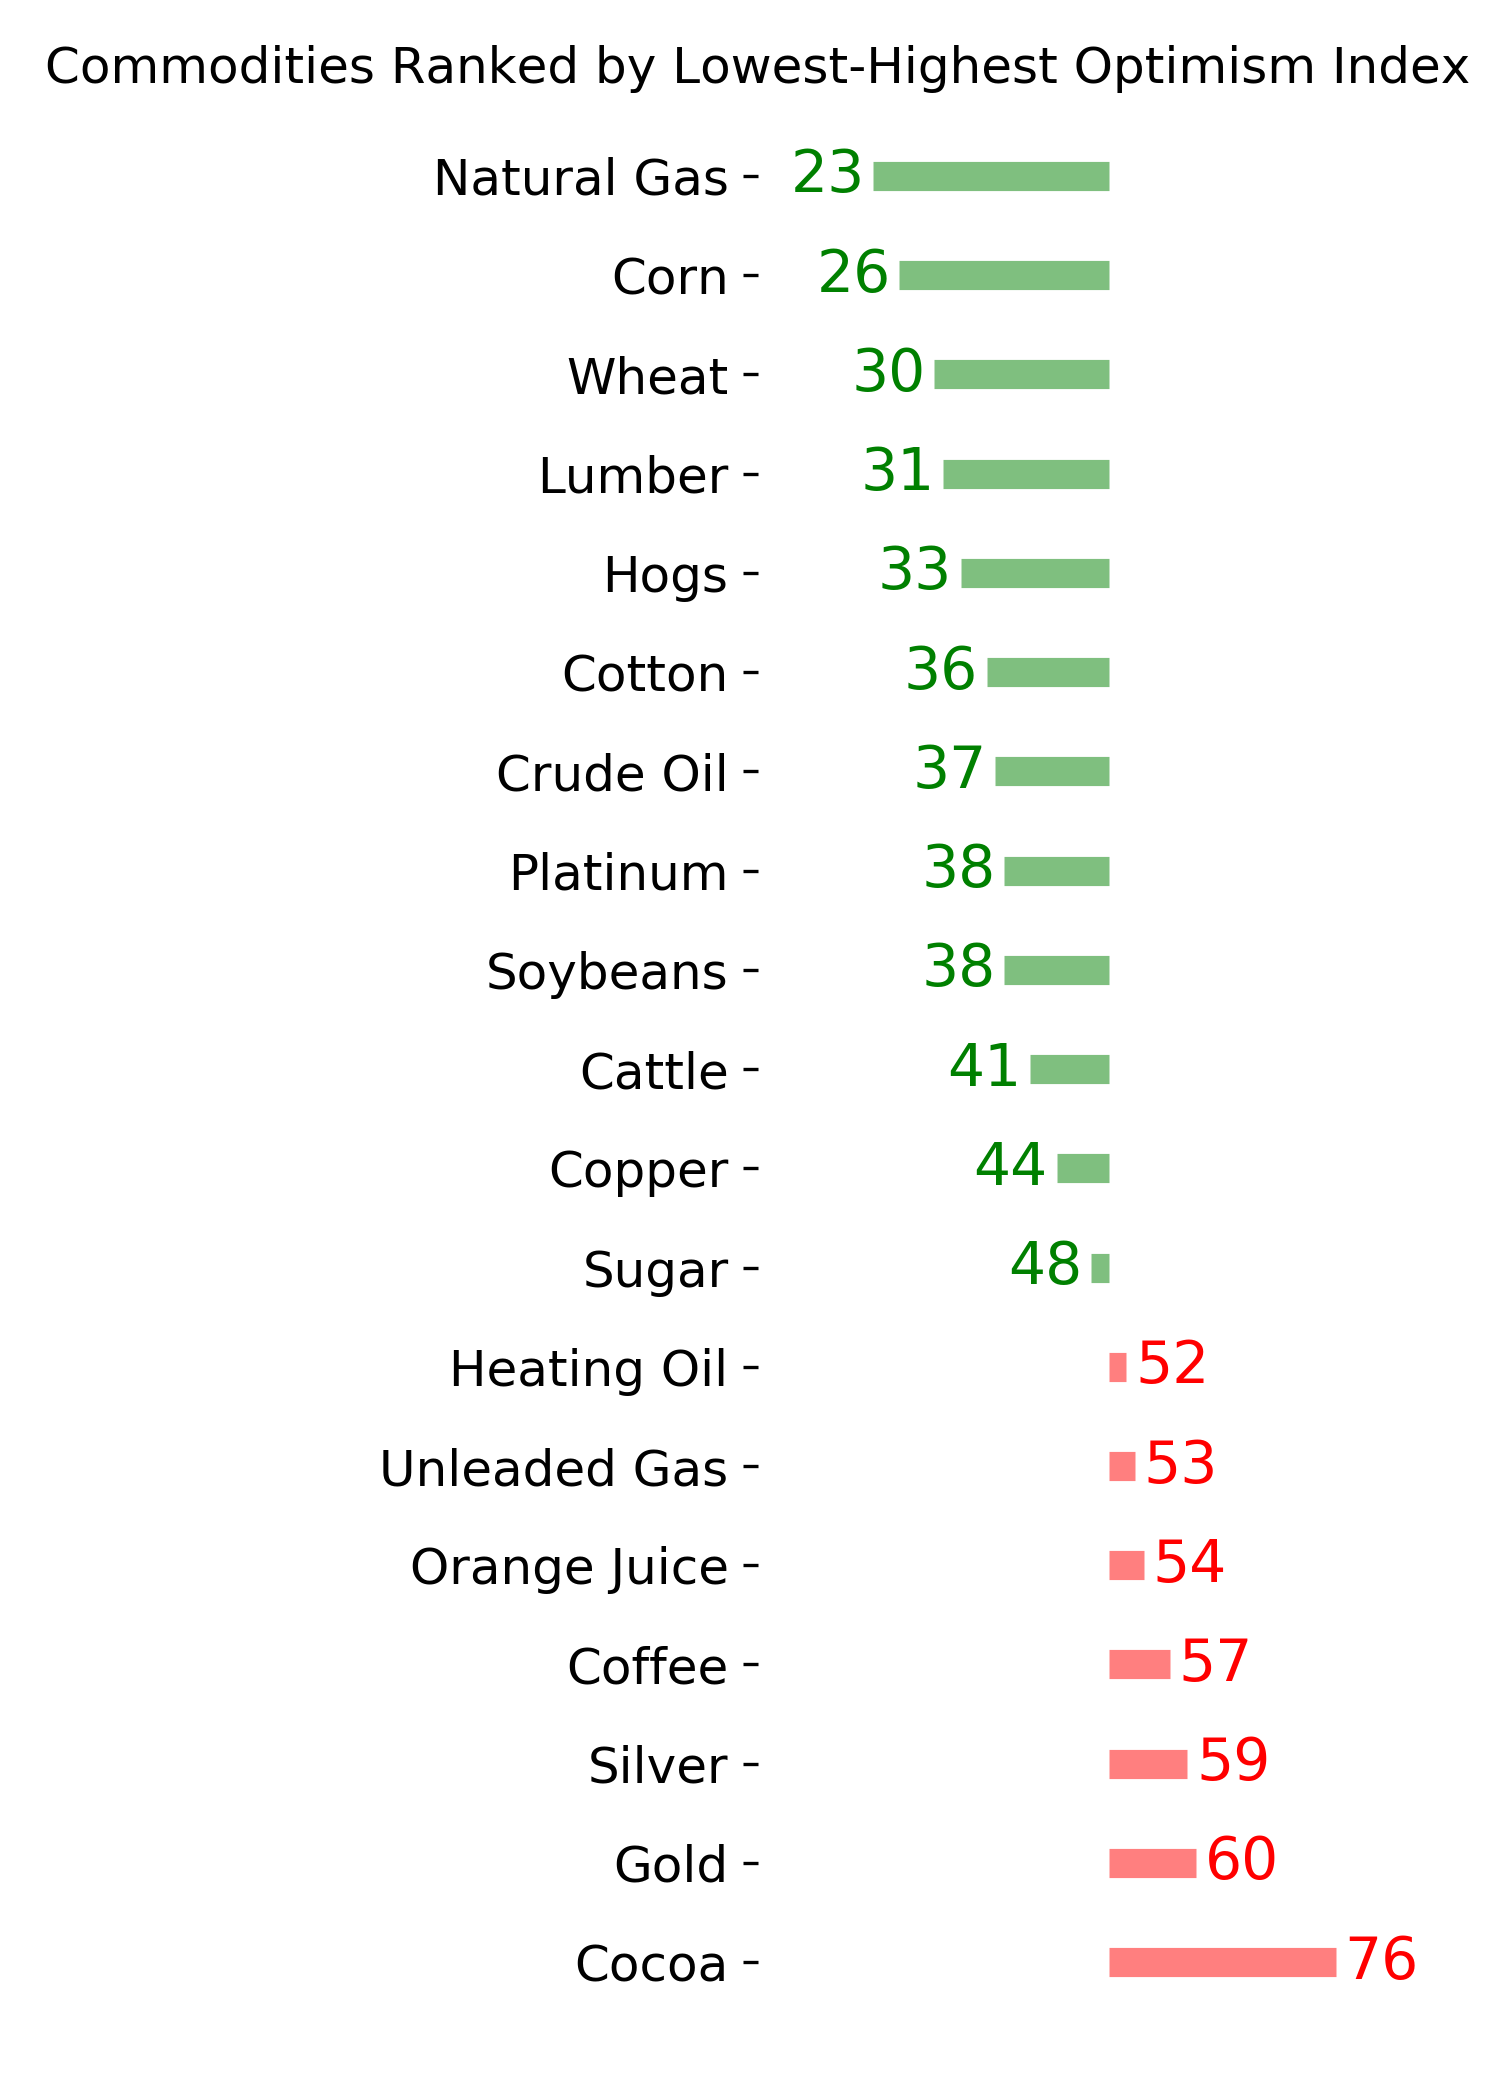
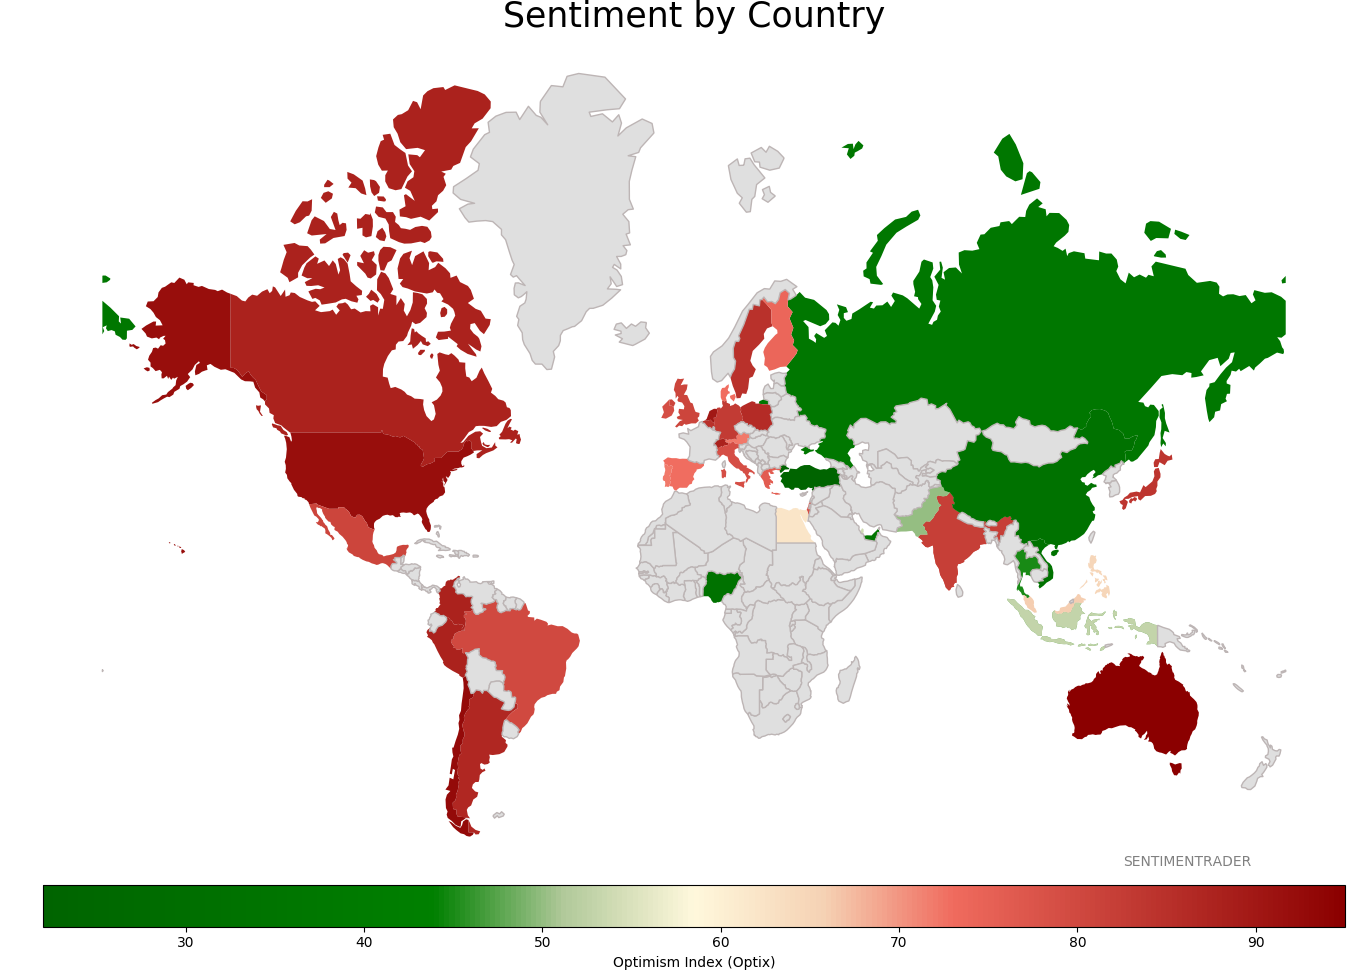
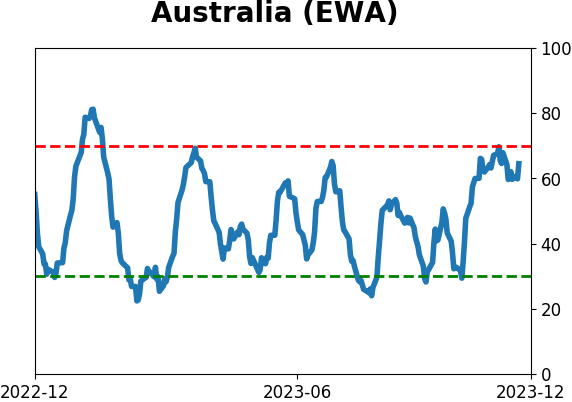
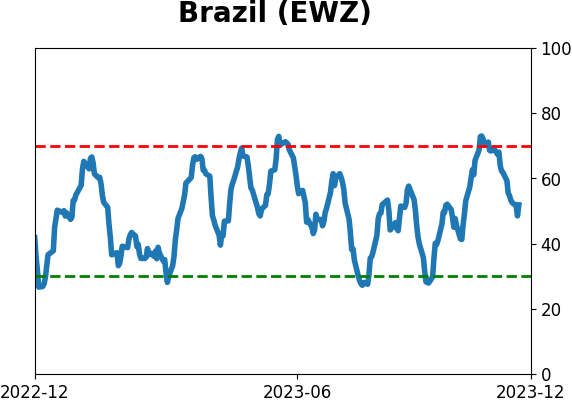
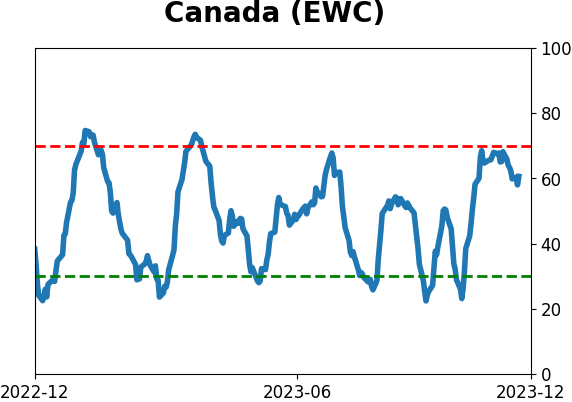
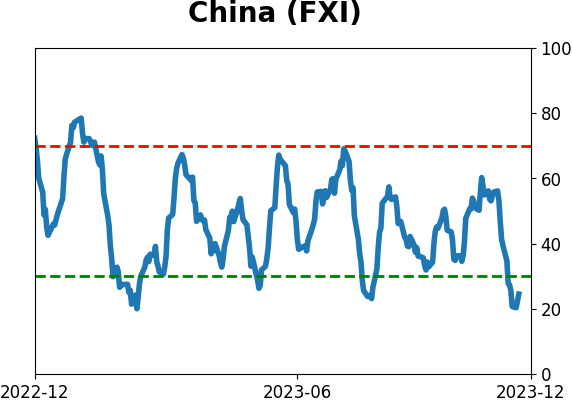
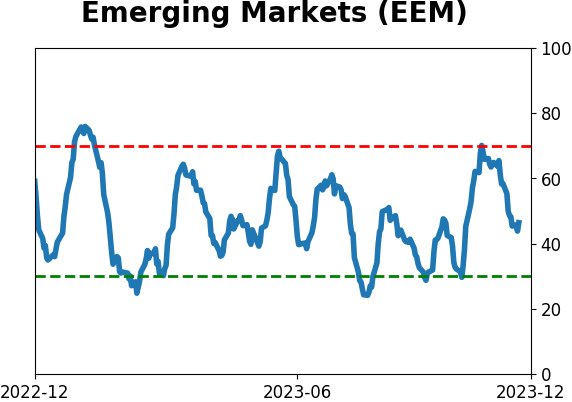
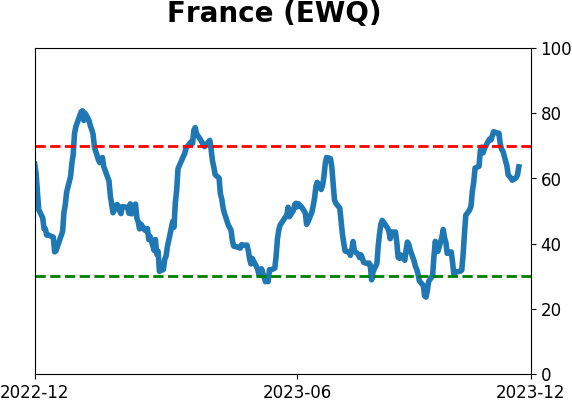
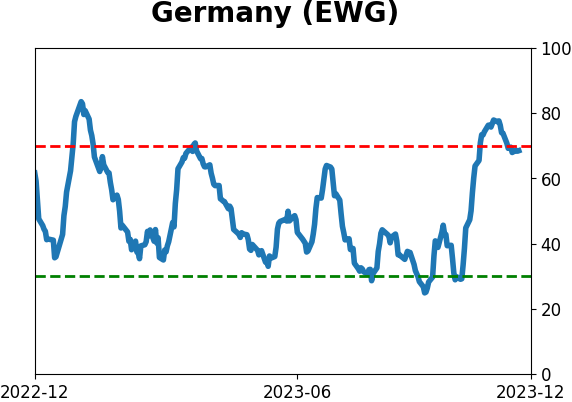
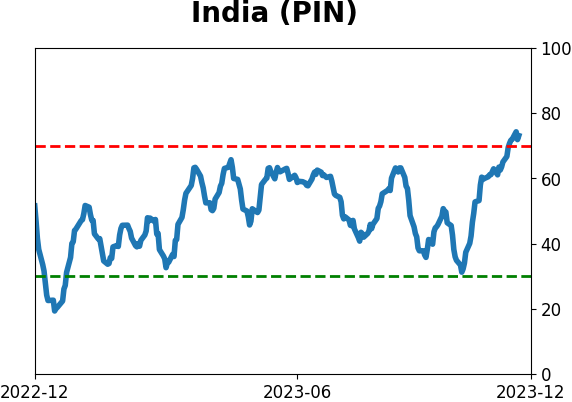
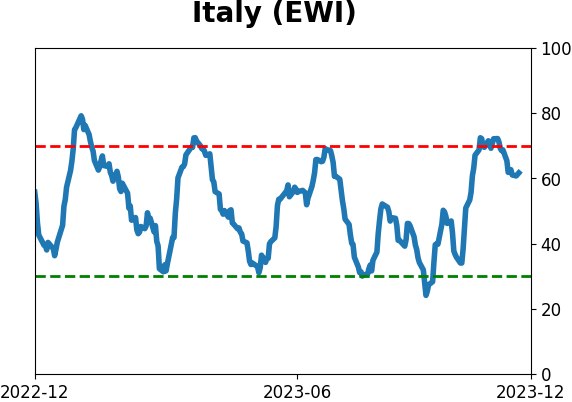
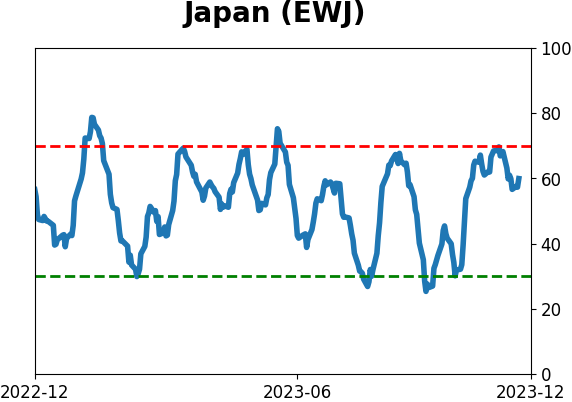
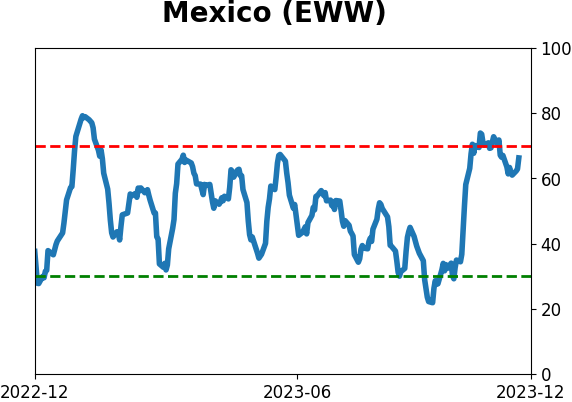
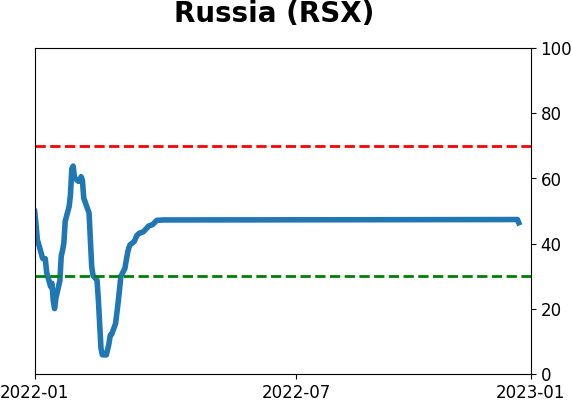
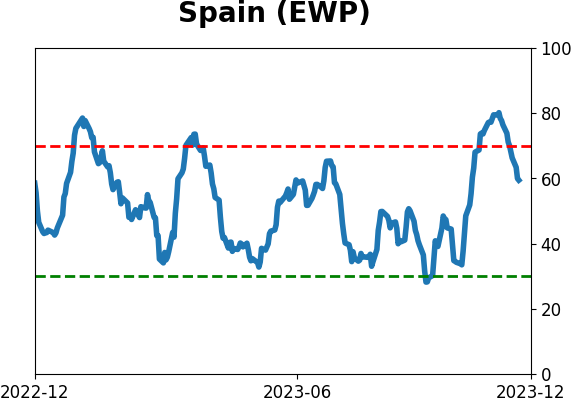
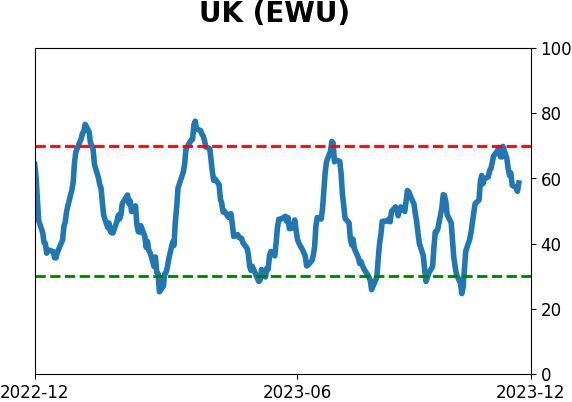
Sentiment Around The World
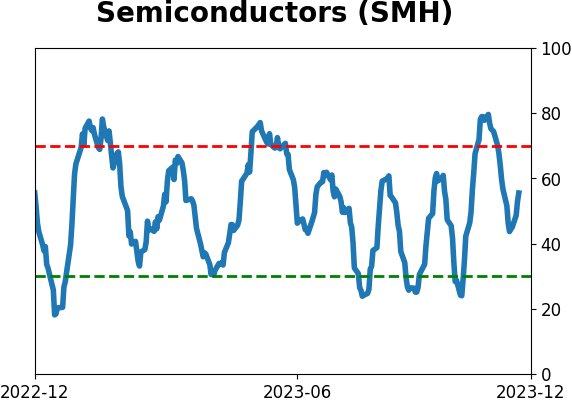
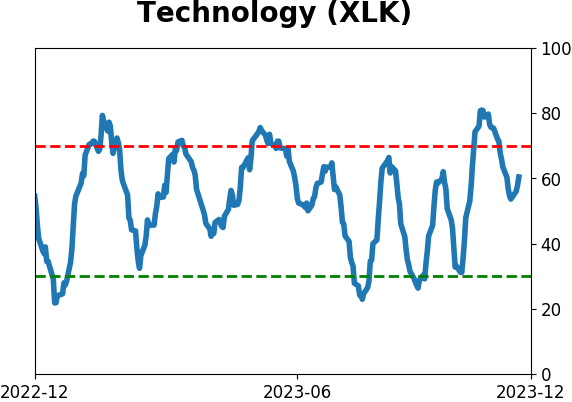
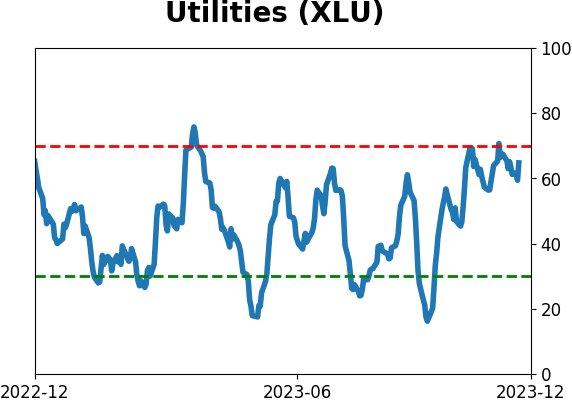
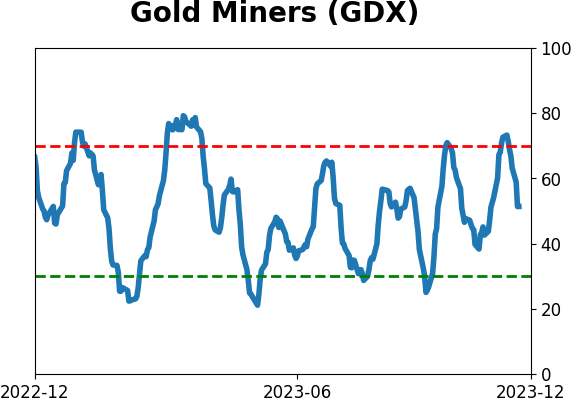
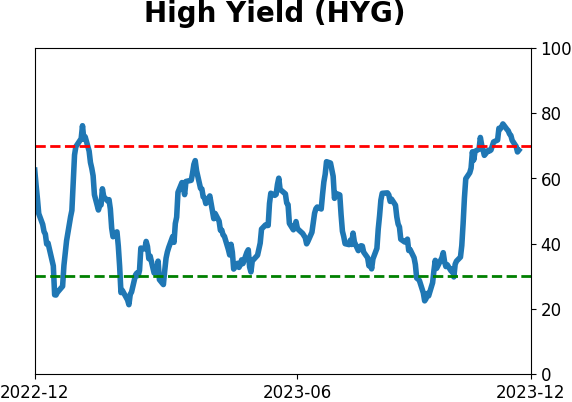
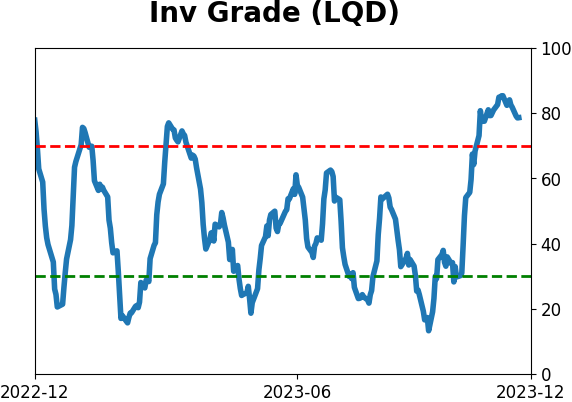
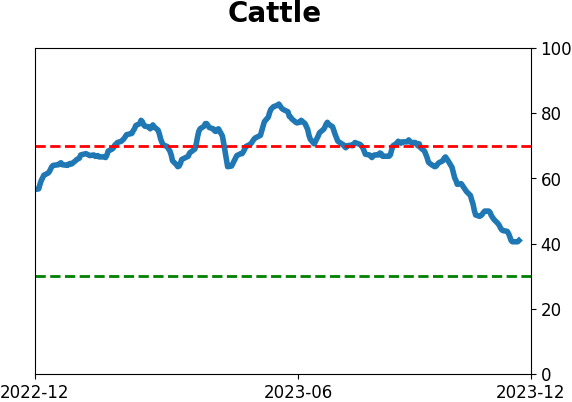
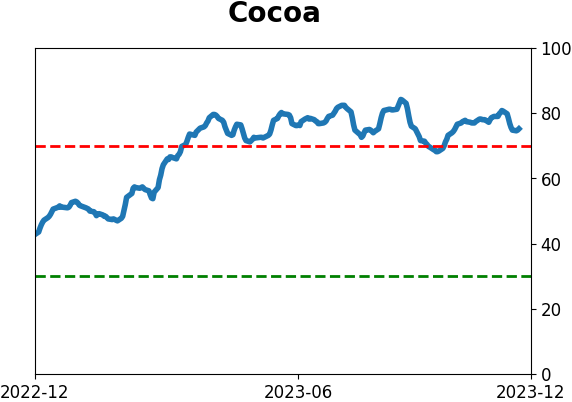
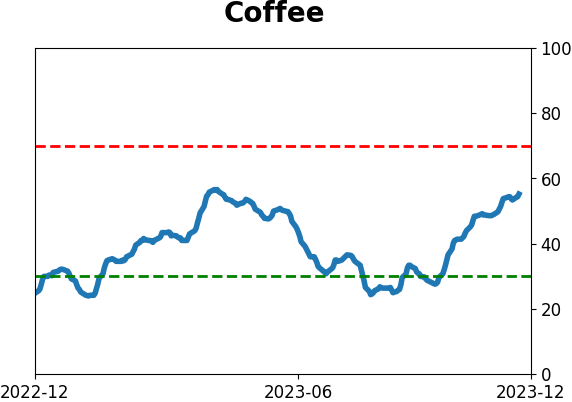
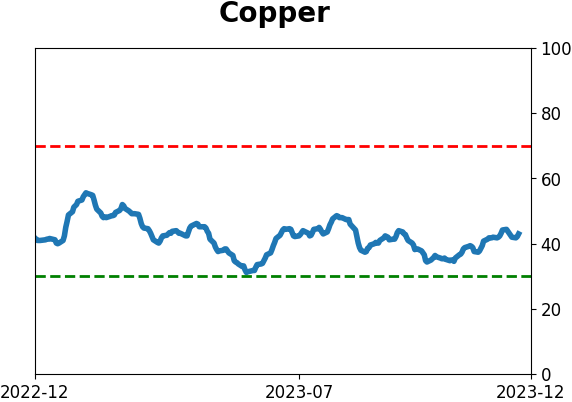
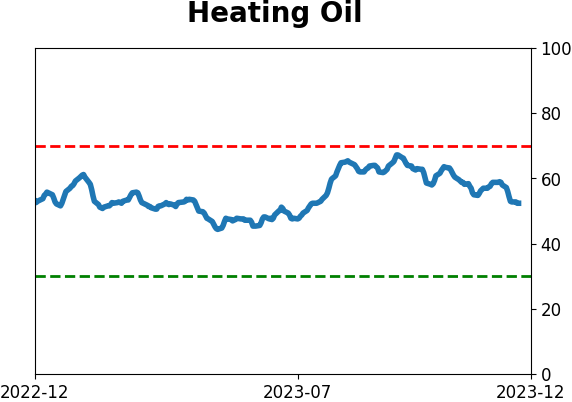
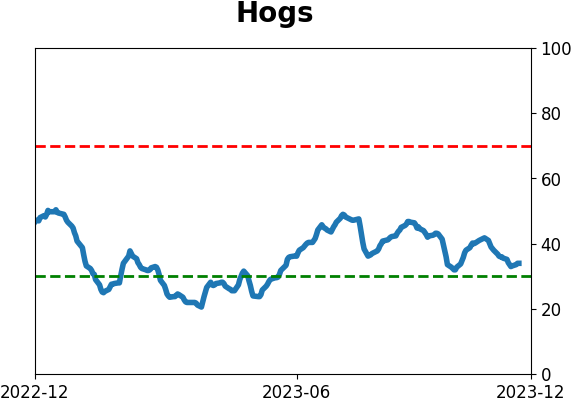
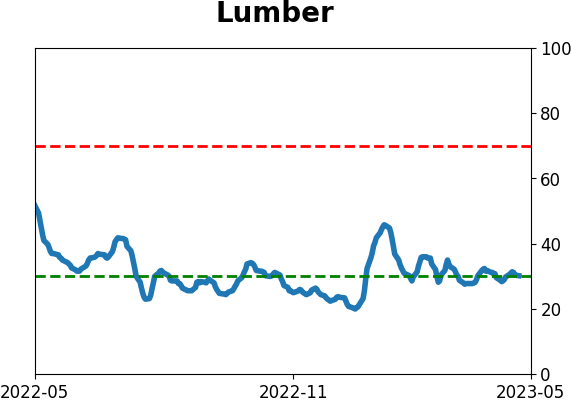
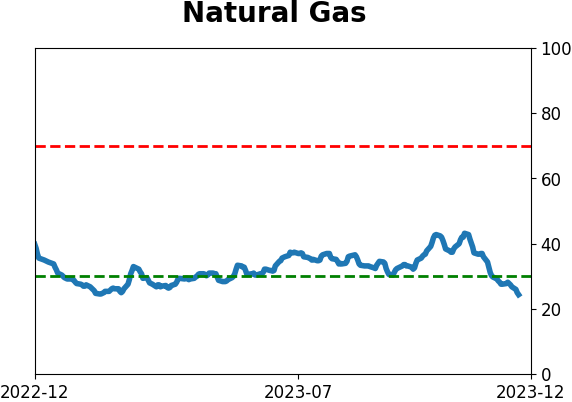
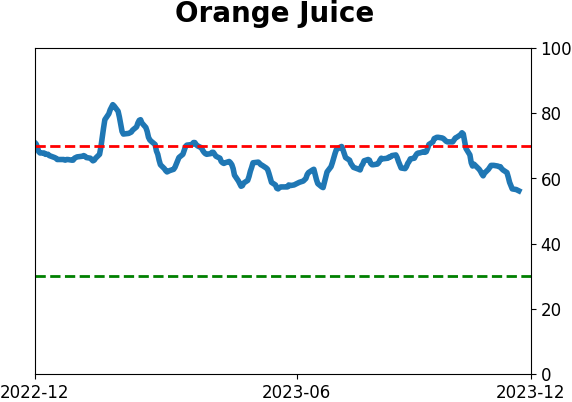
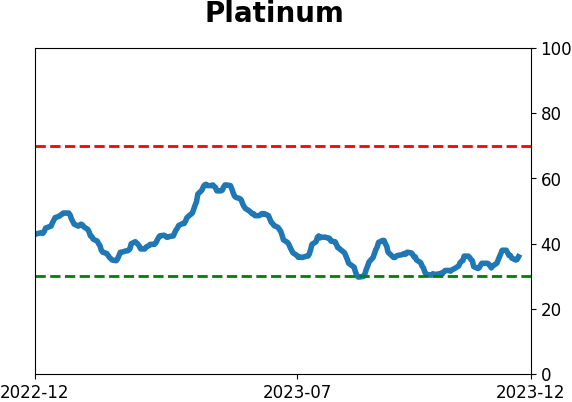
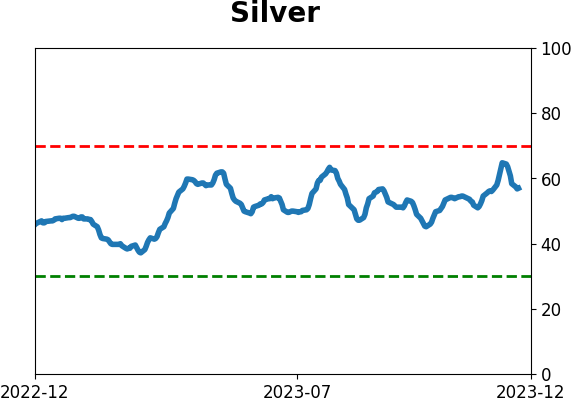
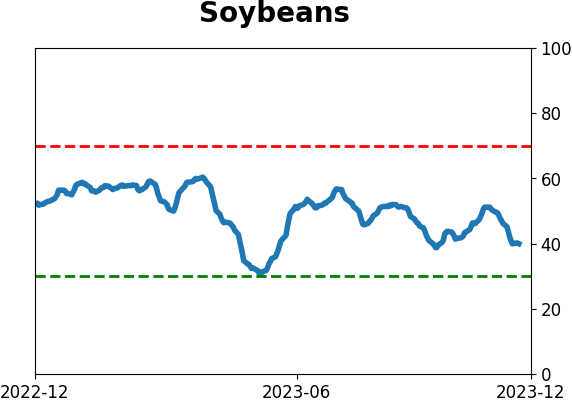
Optimism Index Thumbnails
|
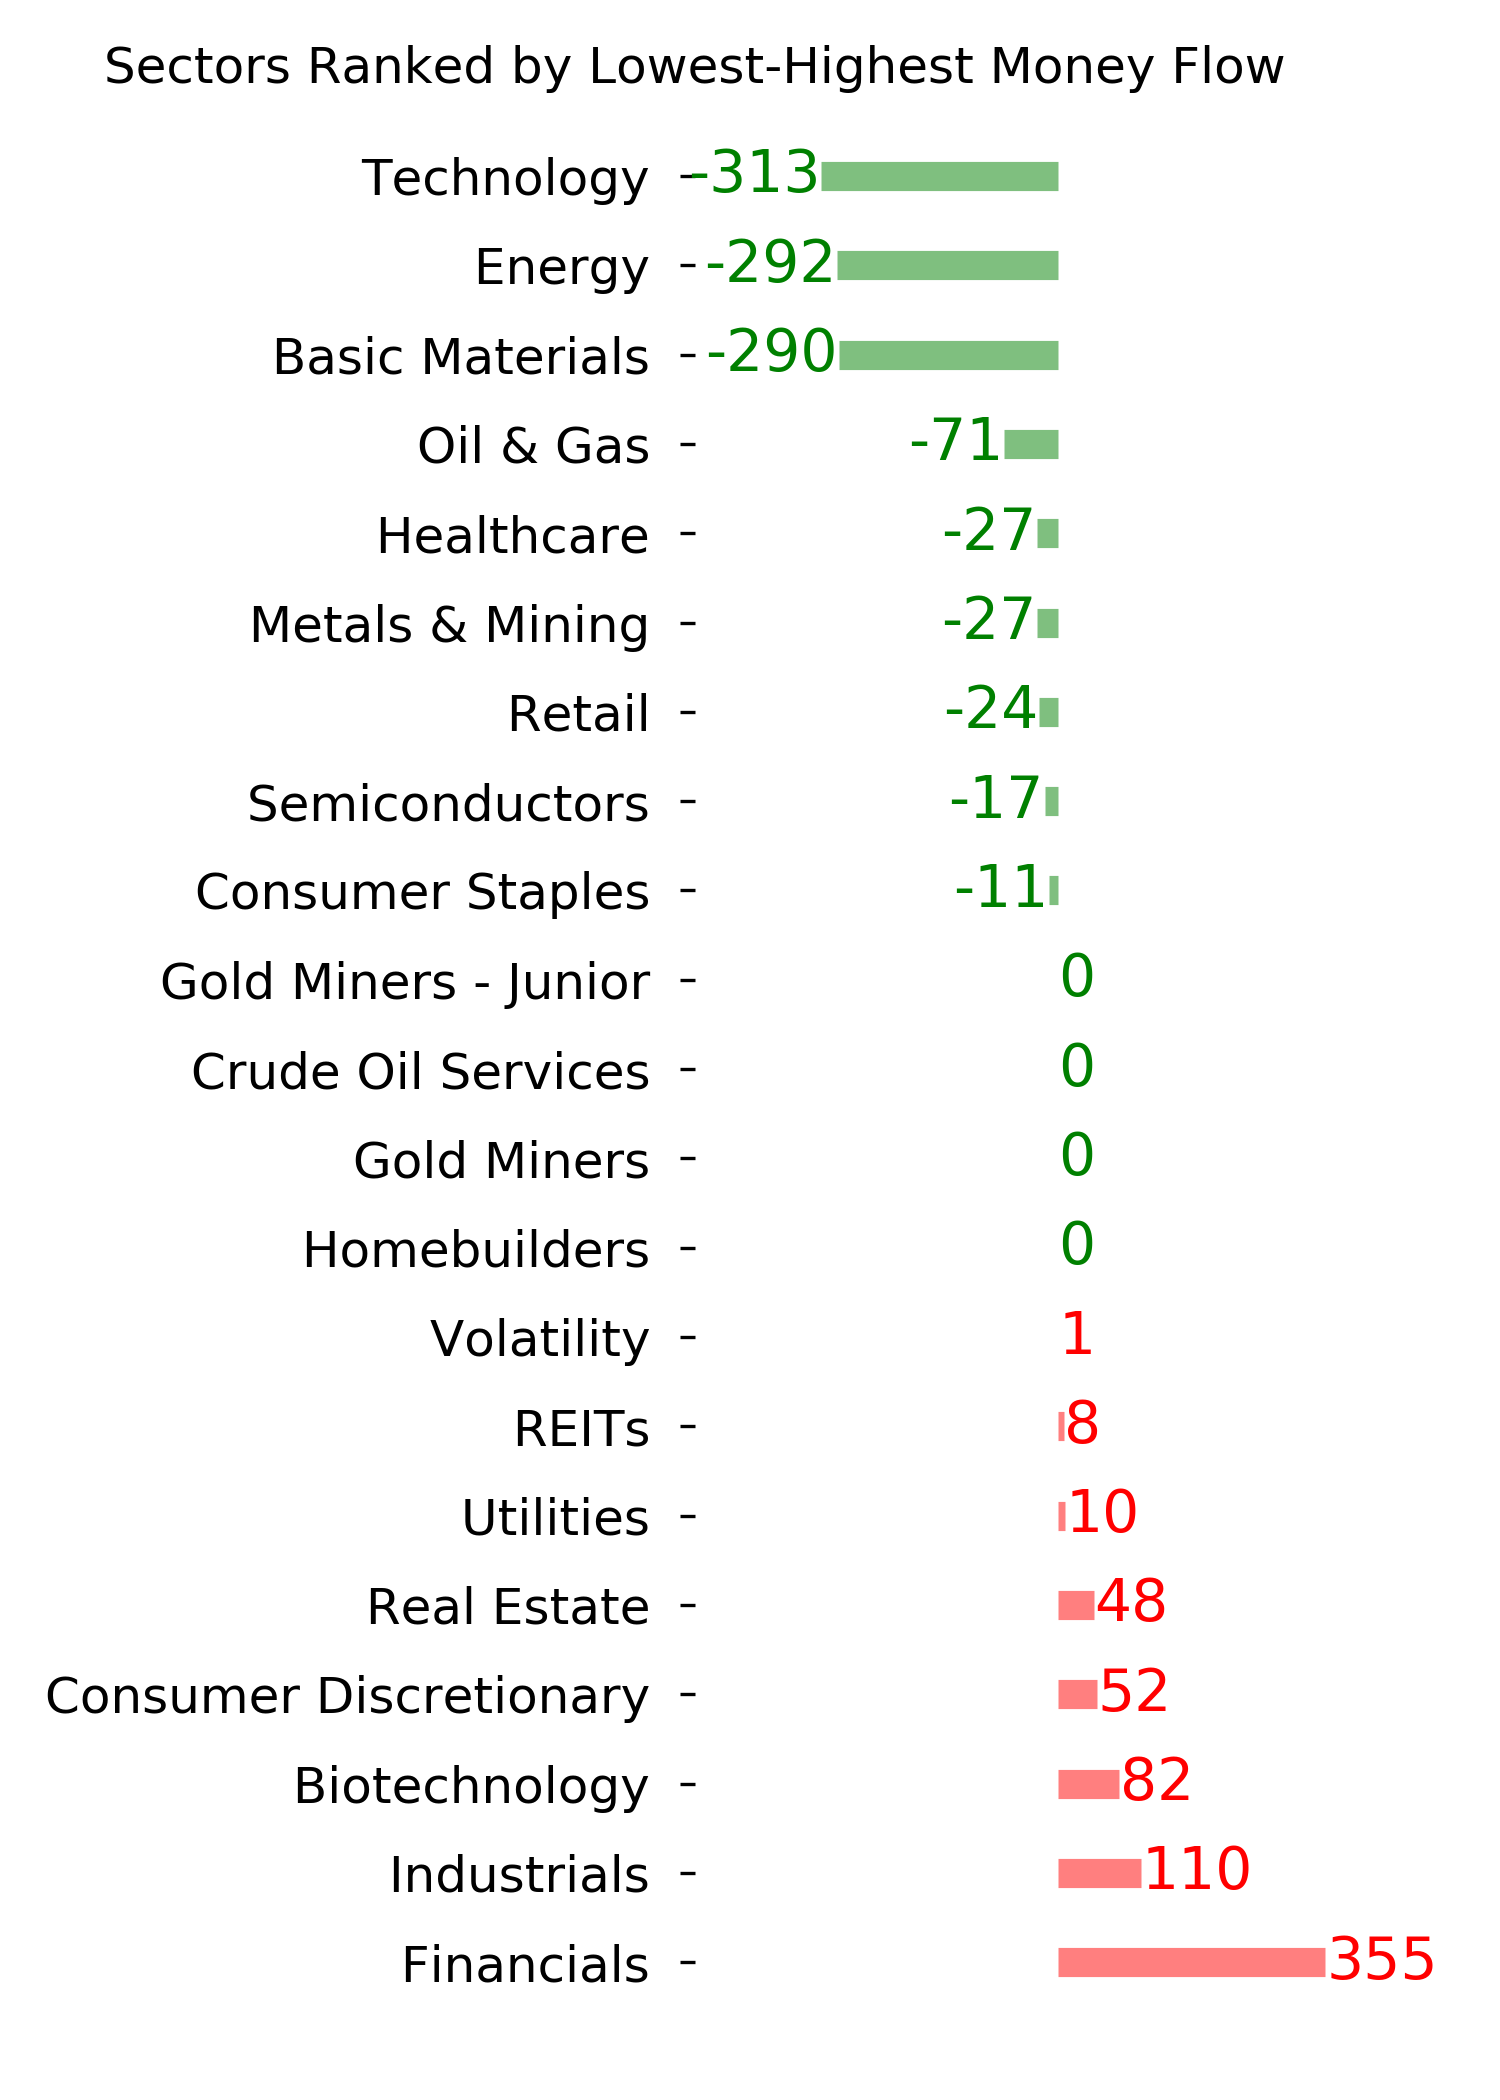
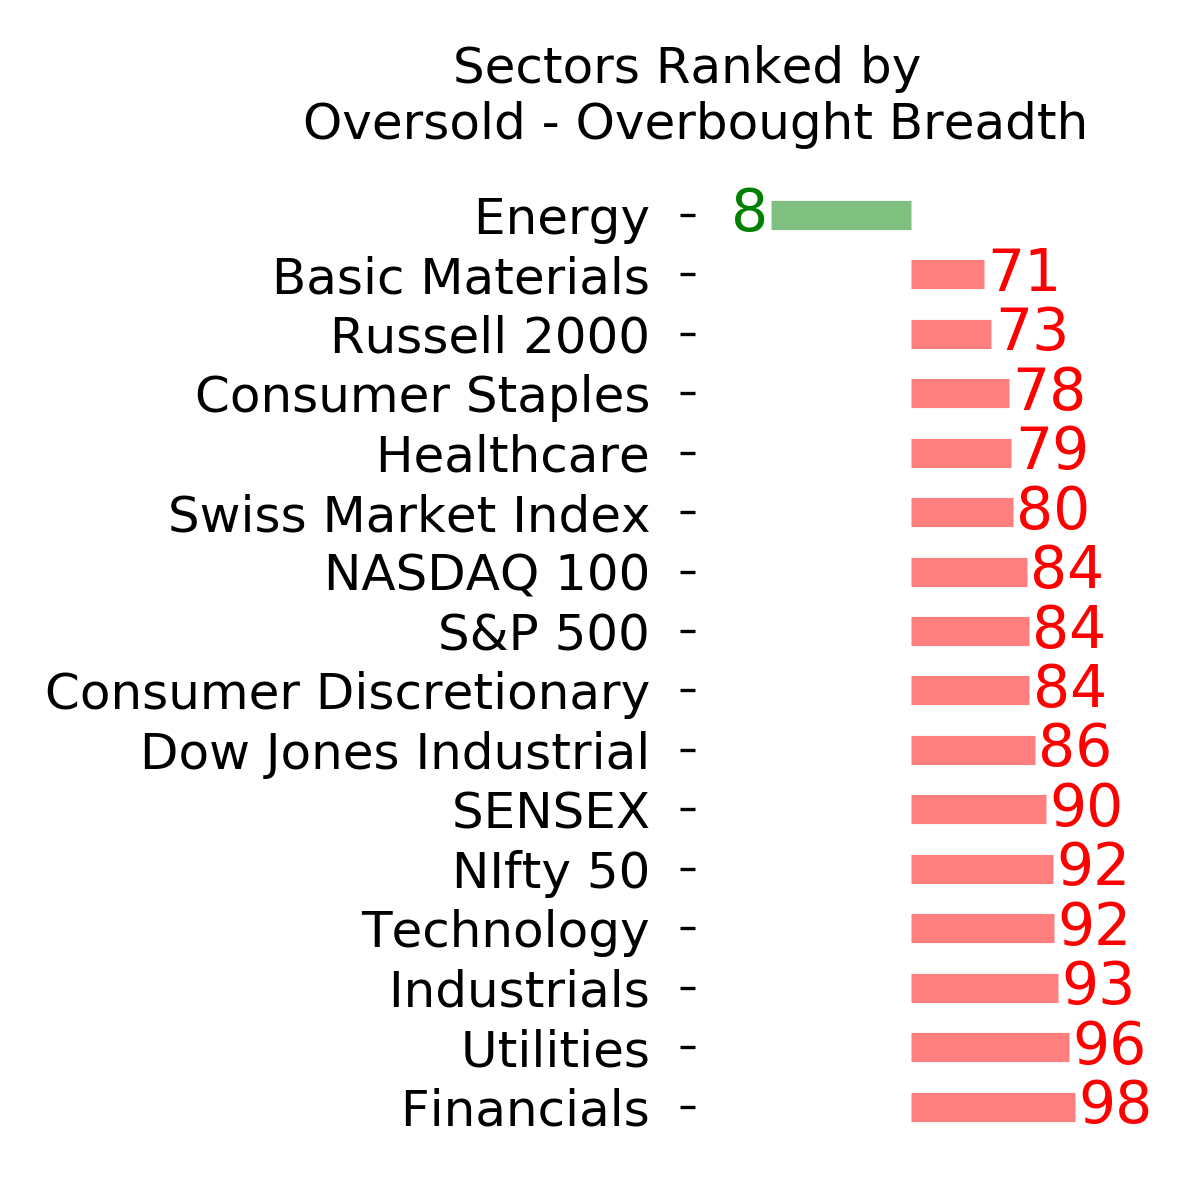
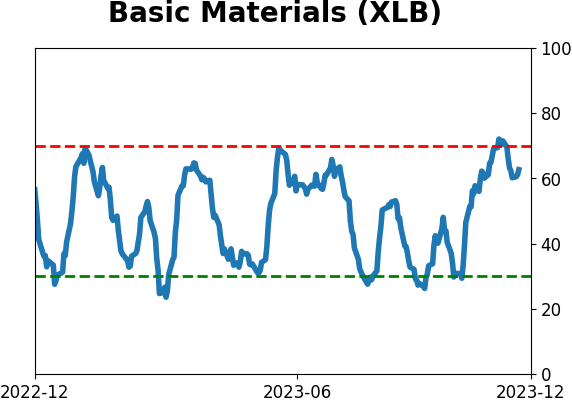
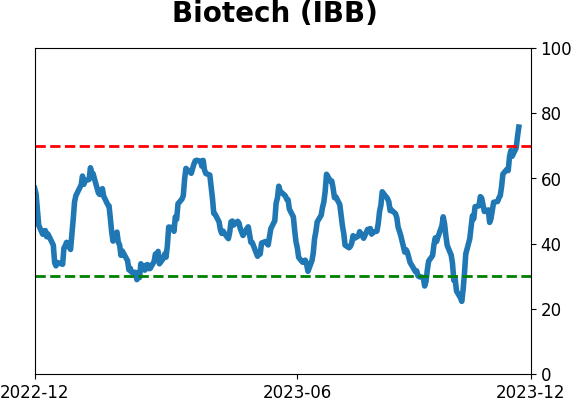
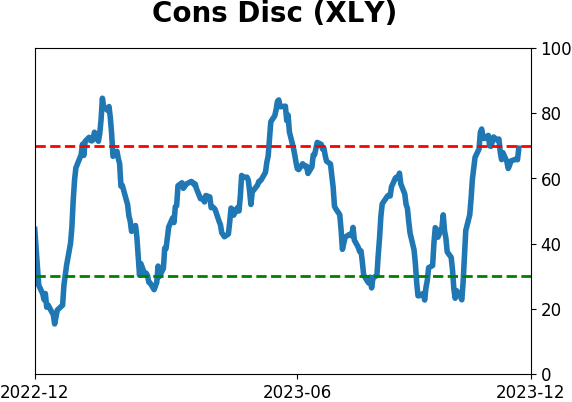
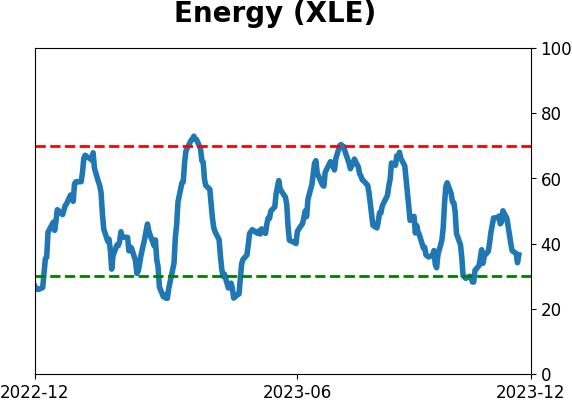
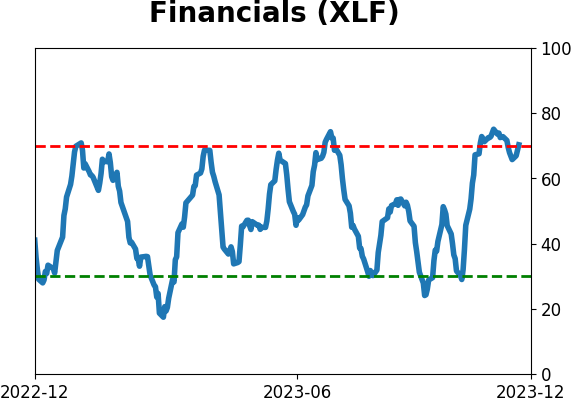
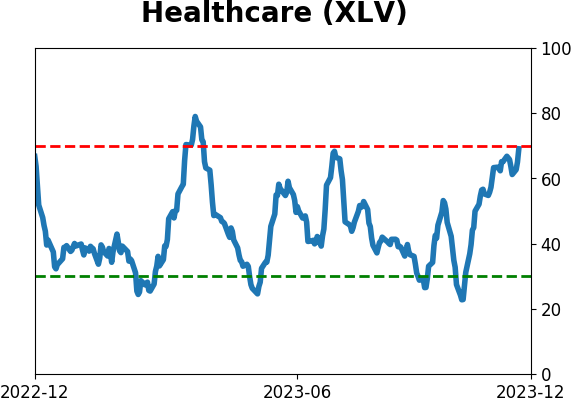
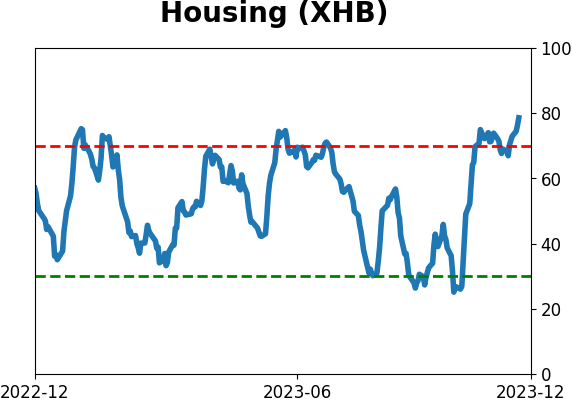
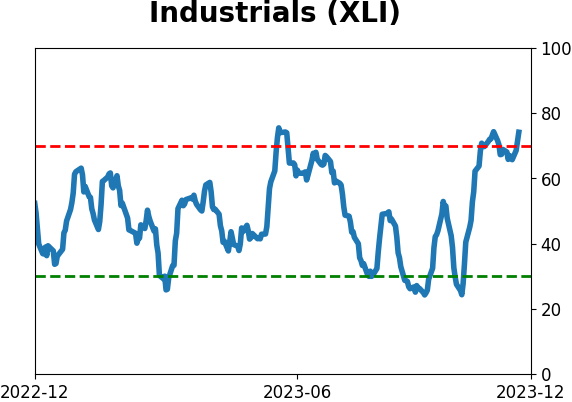
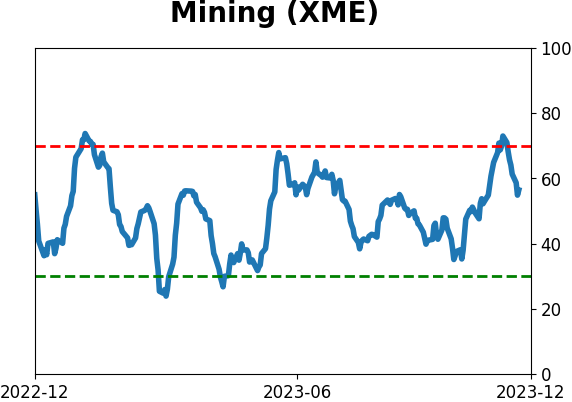
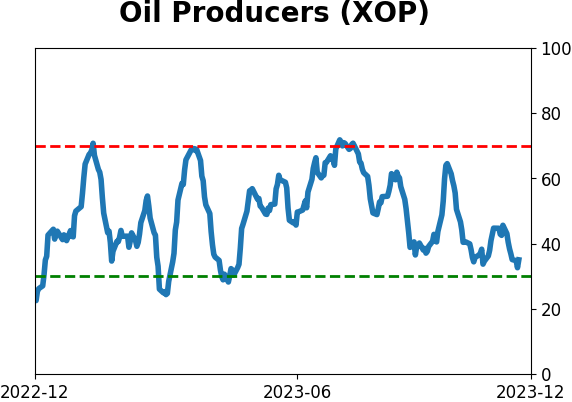
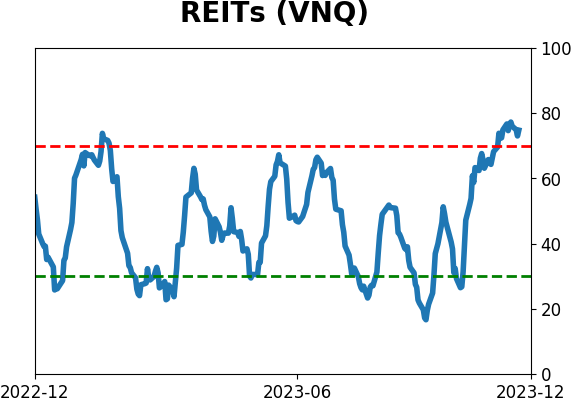
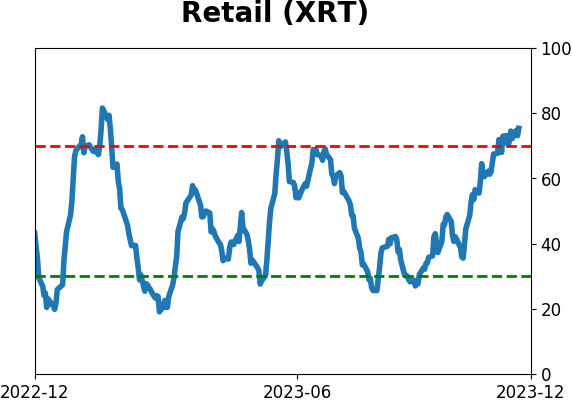
Sector ETF's - 10-Day Moving Average
|
|
|
Country ETF's - 10-Day Moving Average
|
|
|
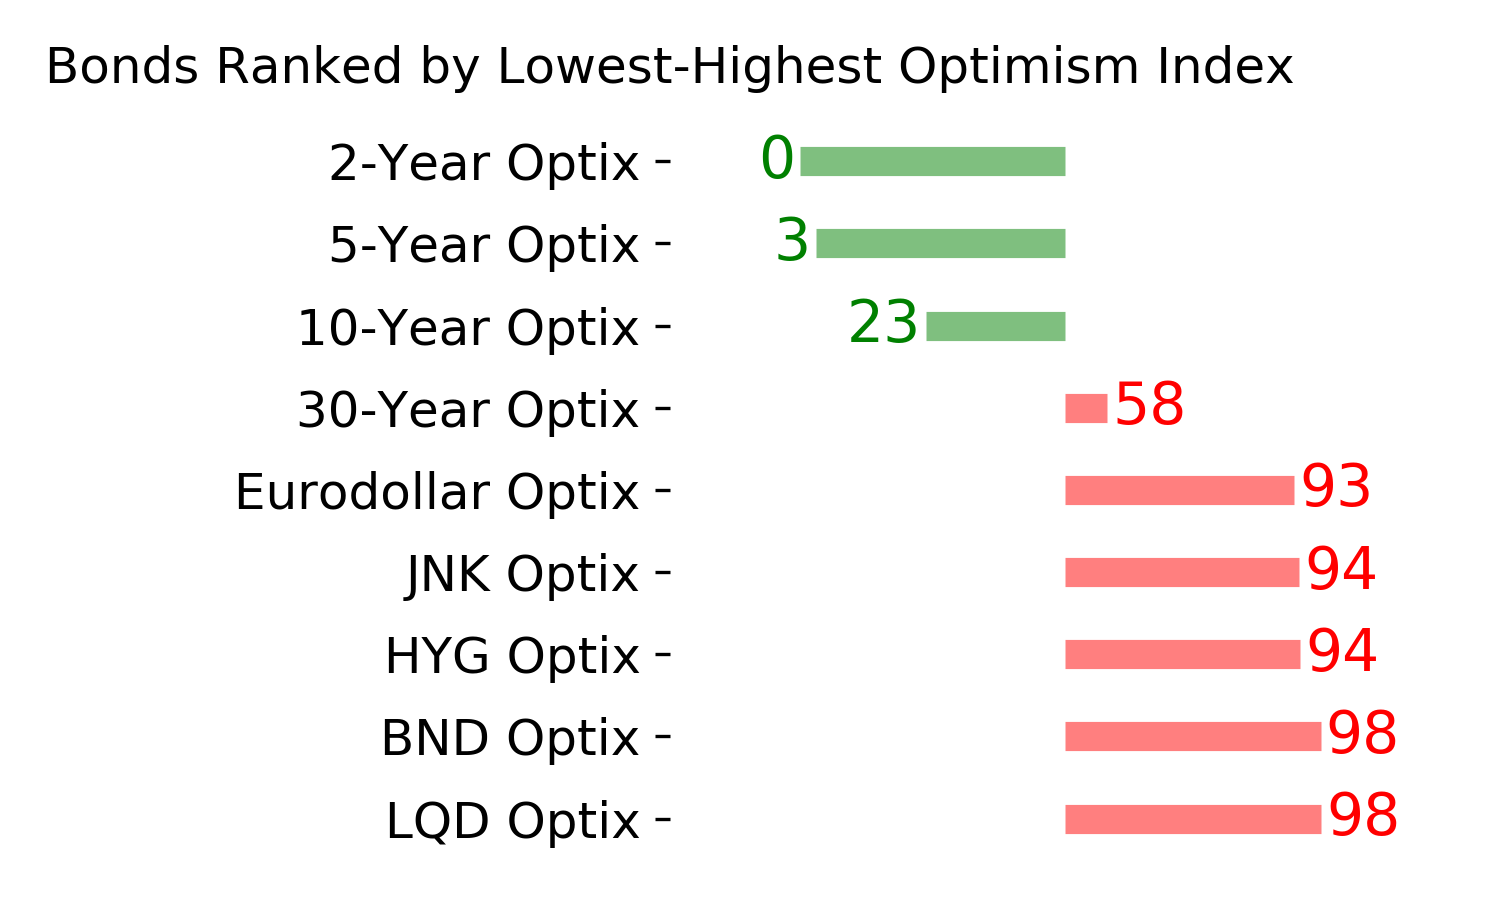
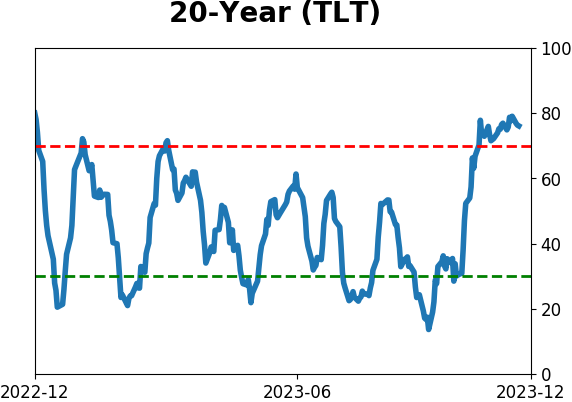
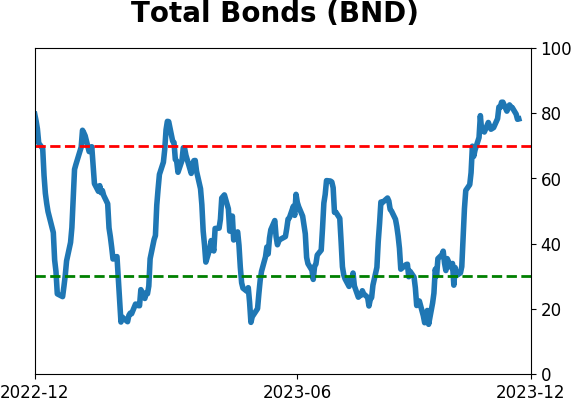
Bond ETF's - 10-Day Moving Average
|
|
|
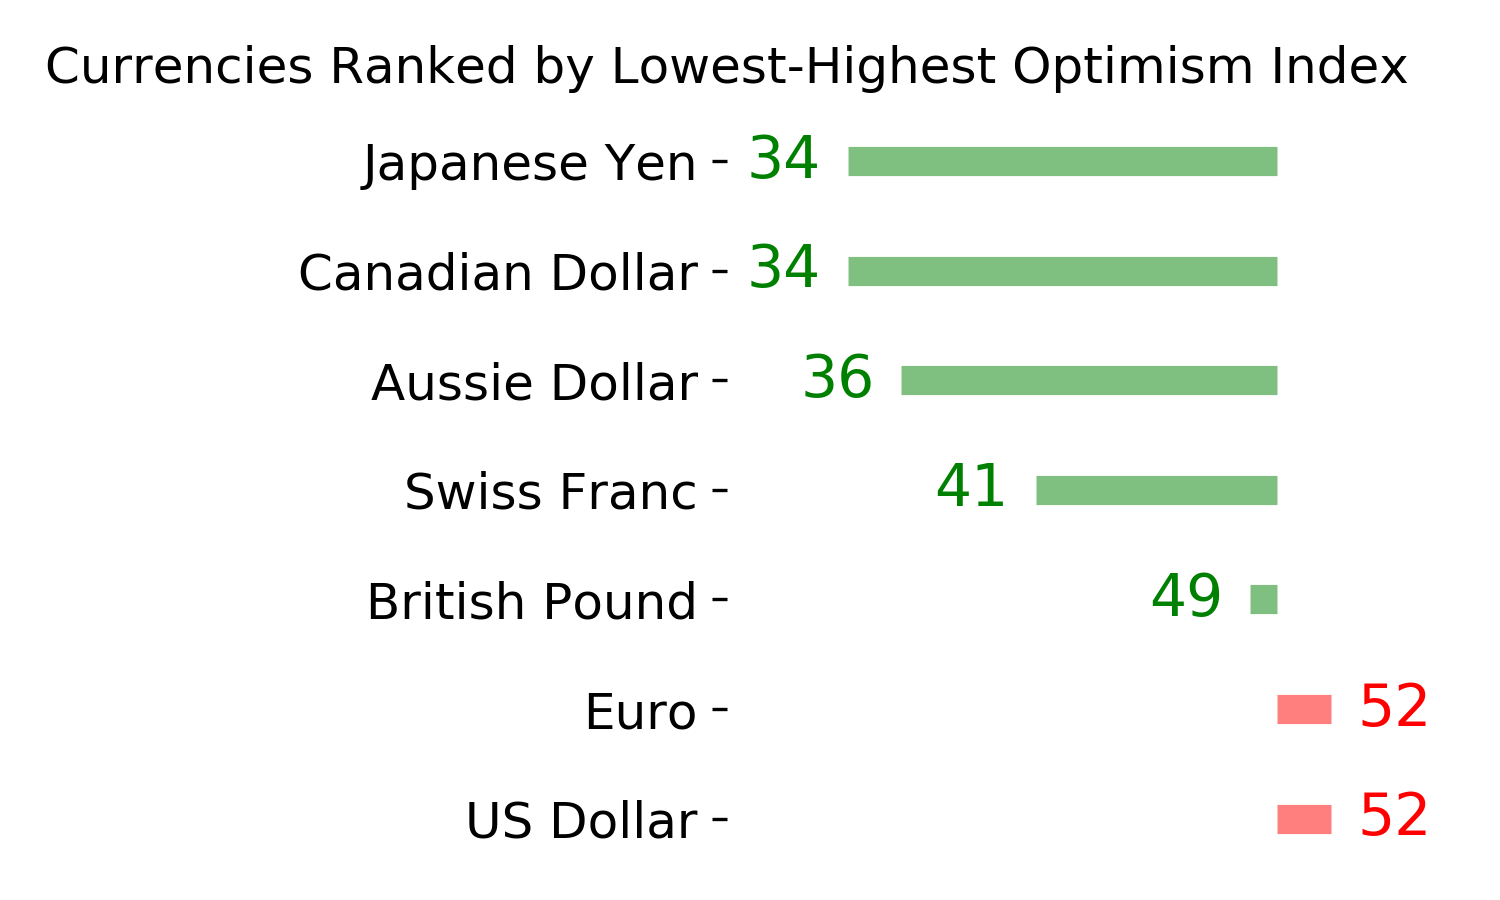
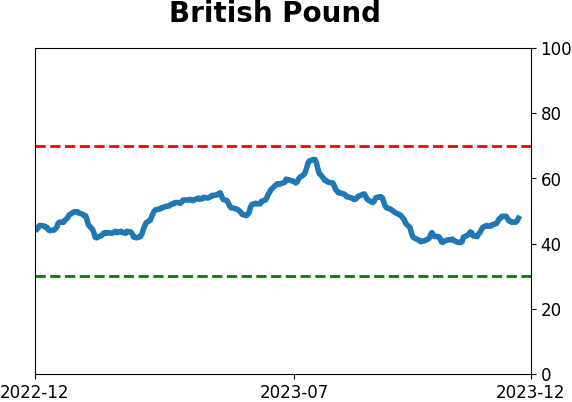
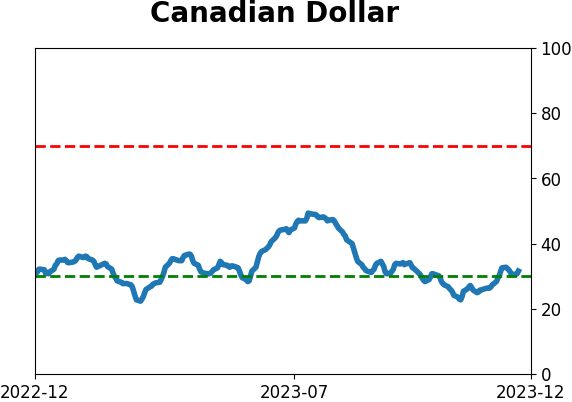
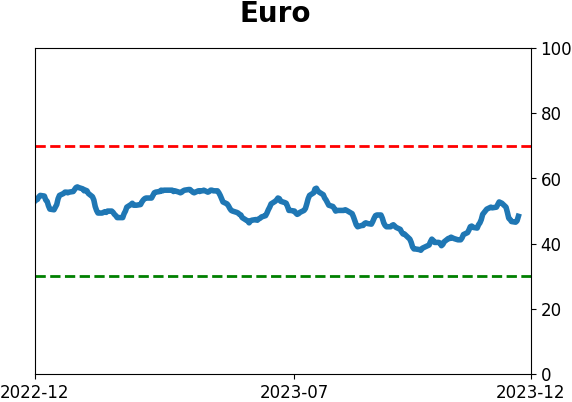
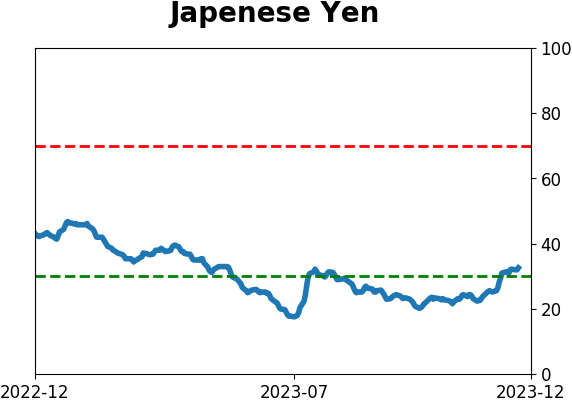
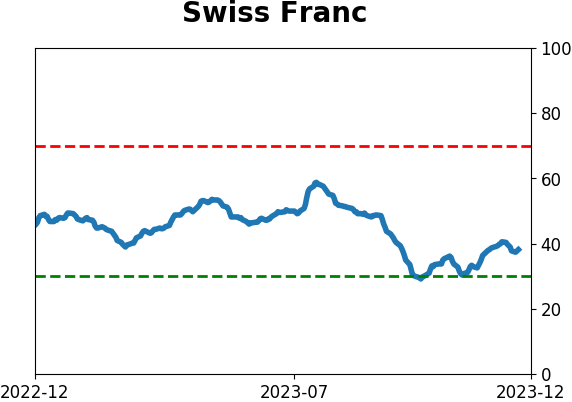
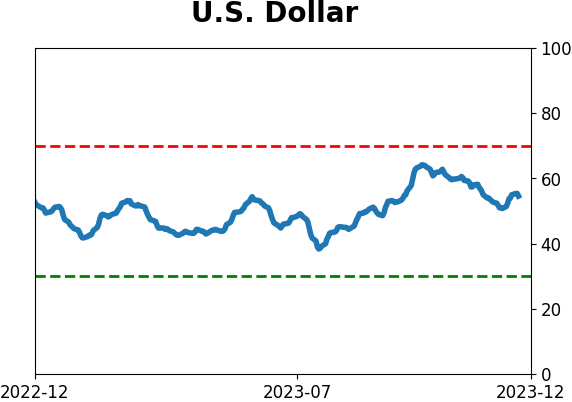
Currency ETF's - 5-Day Moving Average
|
|
|
Commodity ETF's - 5-Day Moving Average
|
|