Headlines
|
|
A 25% drawdown in oil has been no reason to sell:
Crude oil has dropped more than 25% from its most recent 52-week high, triggering warnings that we're heading into a recession. But oil often plunges 25% or more from a high, with no ill effects on the economy or broader stock market.
|
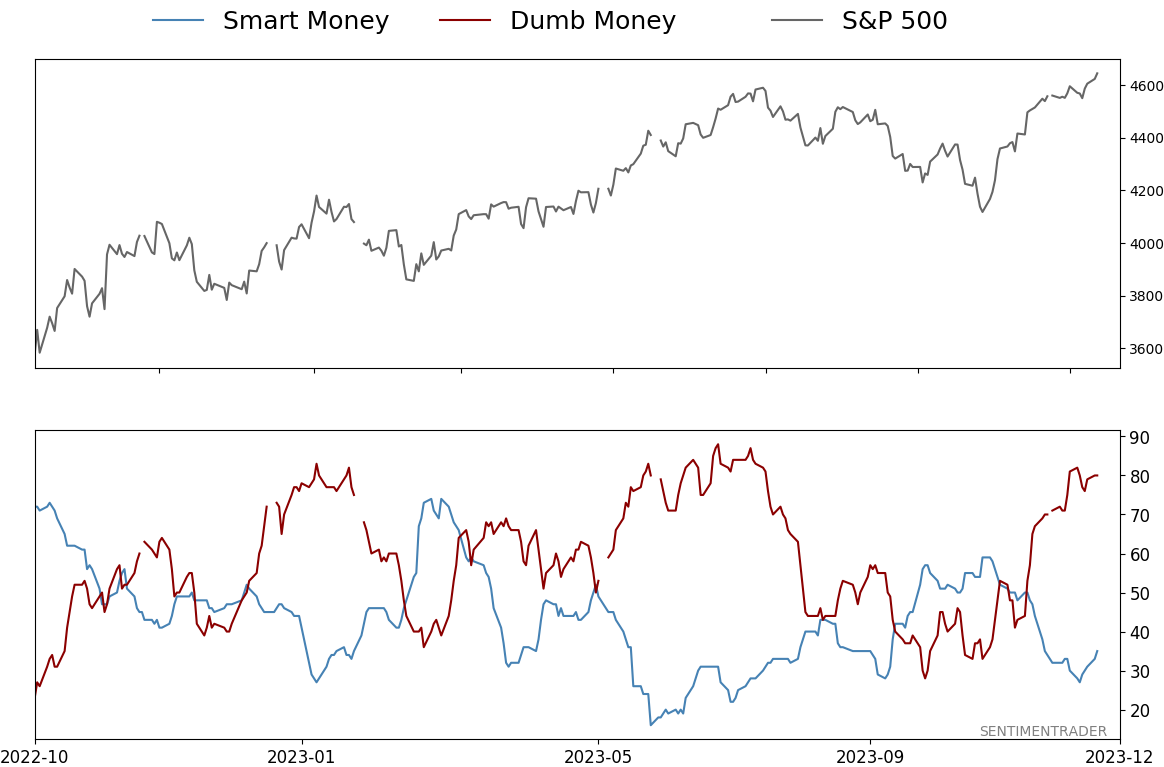
Smart / Dumb Money Confidence
|
Smart Money Confidence: 35%
Dumb Money Confidence: 80%
|
|
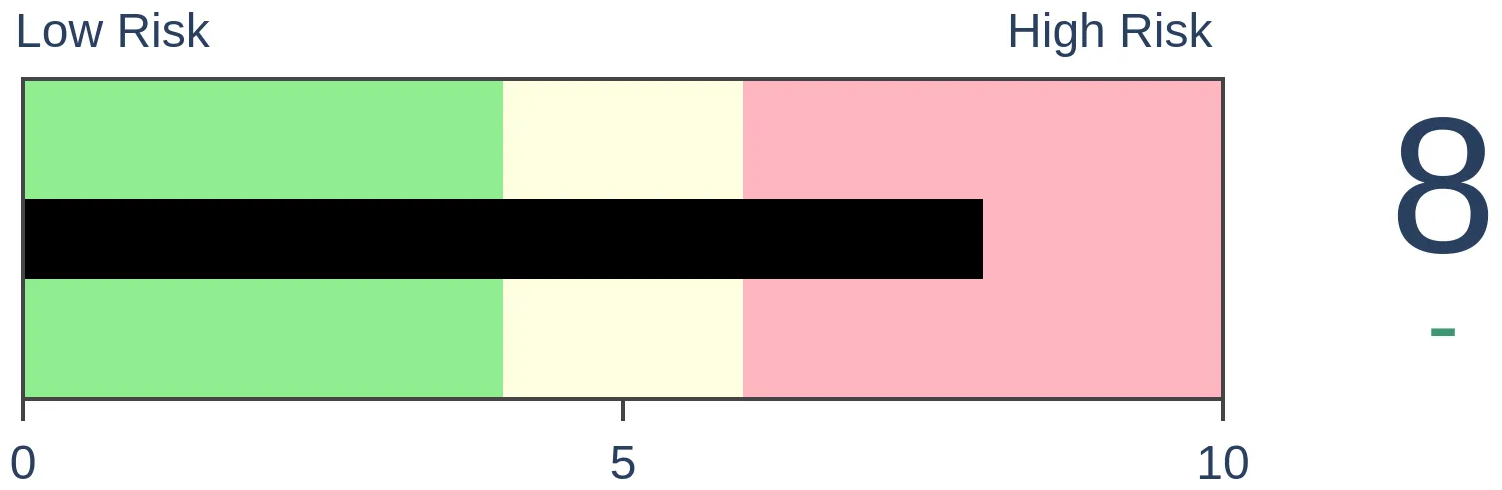
Risk Levels
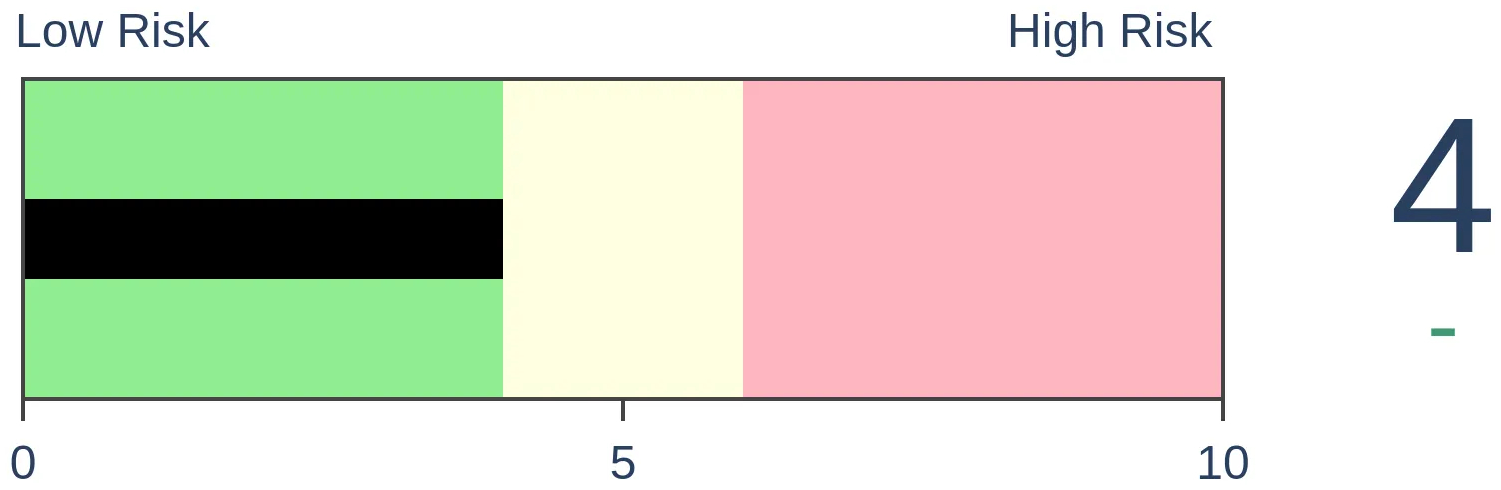
Stocks Short-Term

|
Stocks Medium-Term
|
|
Bonds
|
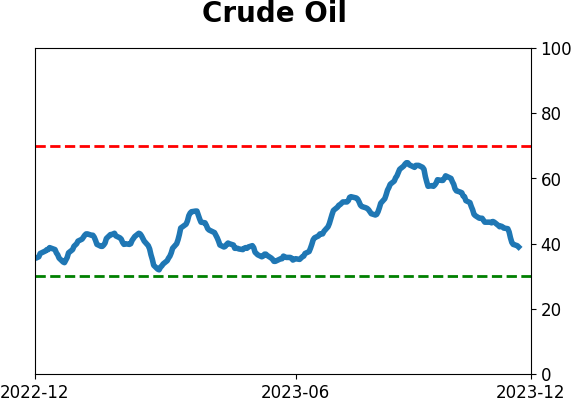
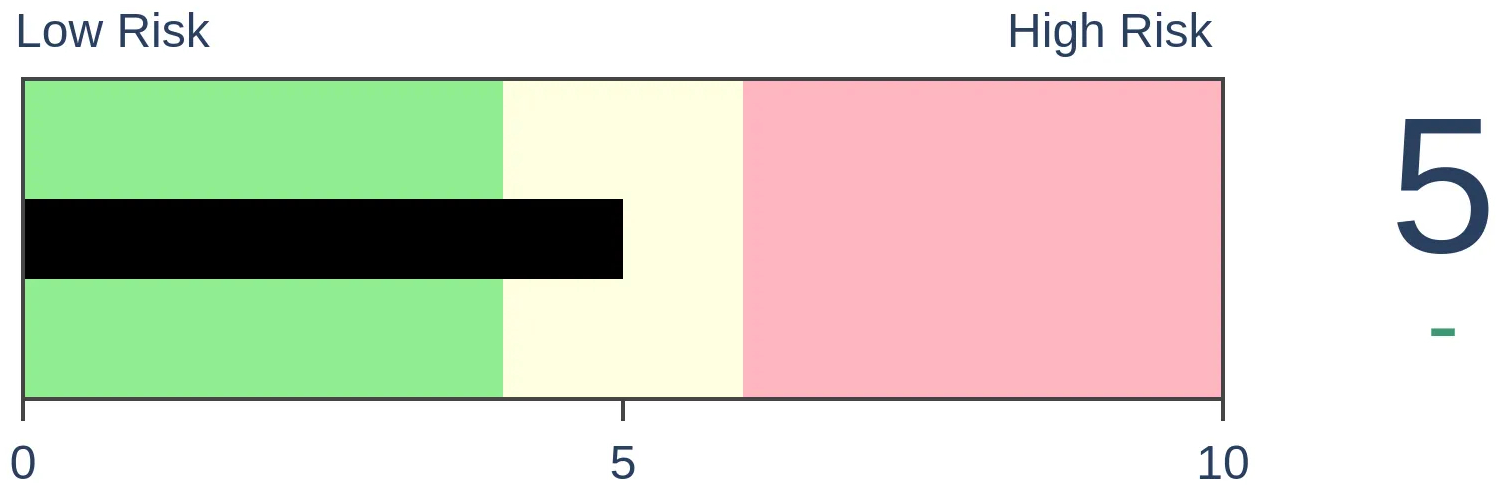
Crude Oil
|
|
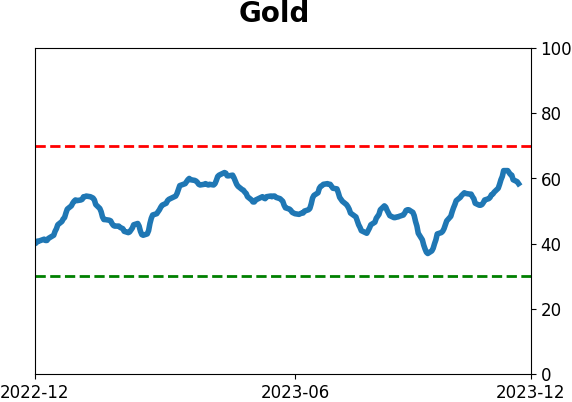
Gold

|
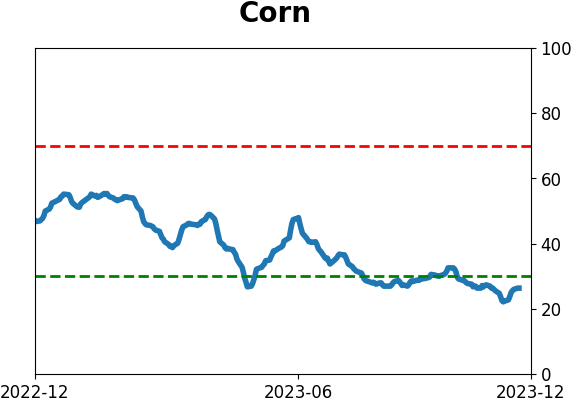
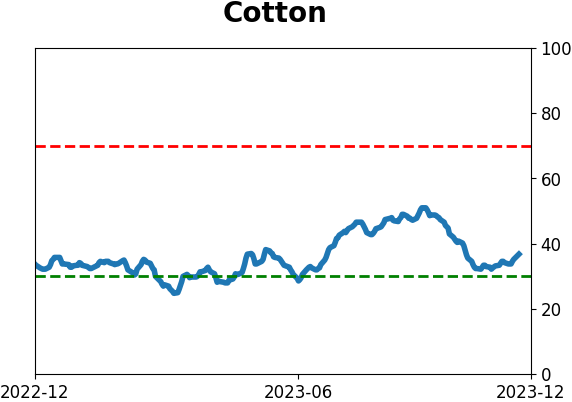
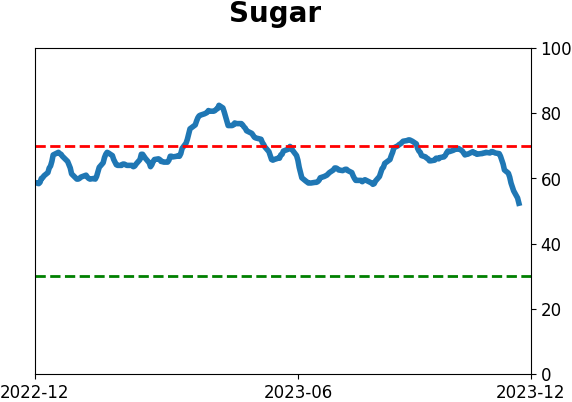
Agriculture

|
|
Research
By Jason Goepfert
BOTTOM LINE
Crude oil has dropped more than 25% from its most recent 52-week high, triggering warnings that we're heading into a recession. But oil often plunges 25% or more from a high, with no ill effects on the economy or broader stock market.
FORECAST / TIMEFRAME
None
|
Key points:
- Crude oil fell into a 25% drawdown from its recent high, sparking calls of impending doom
- These macro calls might make theoretical sense, but drawdowns in oil have a poor record of preceding weakness
- After big drops in oil, stocks tended to do quite well, and they rarely ended up leading to economic recessions
Oil has shed a quarter of its value
People really want to be bearish. They'll look for any excuse, no matter how outlandish or poorly supported. It's no secret that investors pay much more attention to exciting stories than compelling data, and it seems like it's getting worse.
Take this tweet, for example. I like Charles, and it has nothing to do with calling anyone out - it's more a reflection of the engagement from the FinTwit audience - just read the comments.
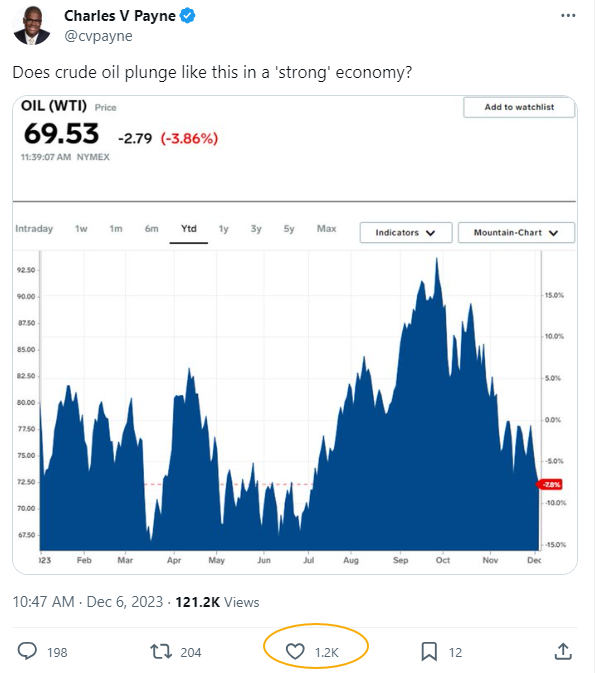
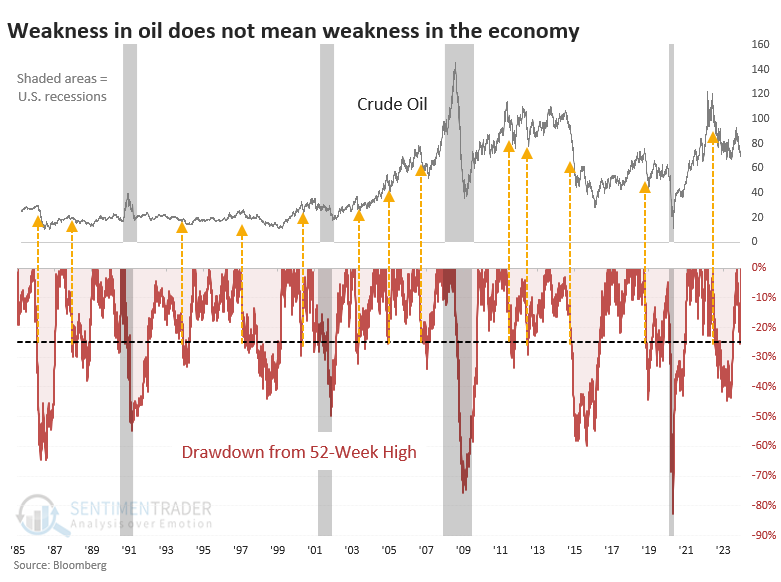
The fact, easily verified, is that, yes, oil does plunge like this in a strong economy. All the time.
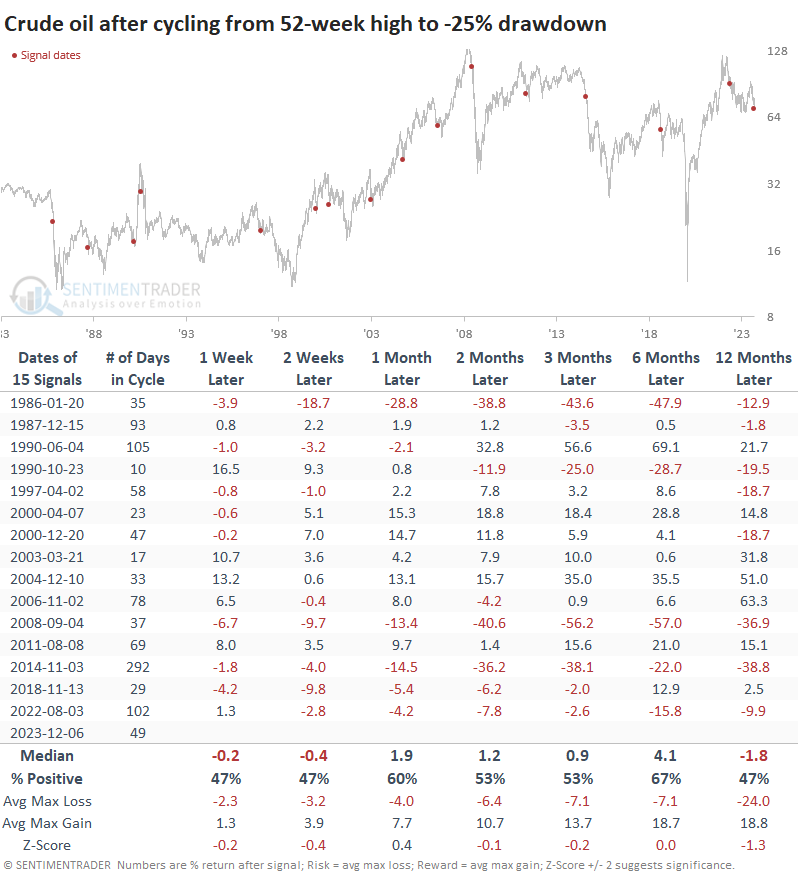
Just eyeballing the chart, there have been 13 times when oil plunged 25% or more from a 52-week high, and it didn't result in an imminent recession.
Big drawdowns in oil were not a good reason to sell oil...or stocks...or most other things
Our process has never been to just eyeball a chart and call it a day. So, the chart below shows every time crude oil futures cycled from a 52-week high to a -25% drawdown and oil's future returns. They were relatively weak overall but nothing too devastating. Returns should be more consistently poor if it were a reliable signal of an economic contraction.
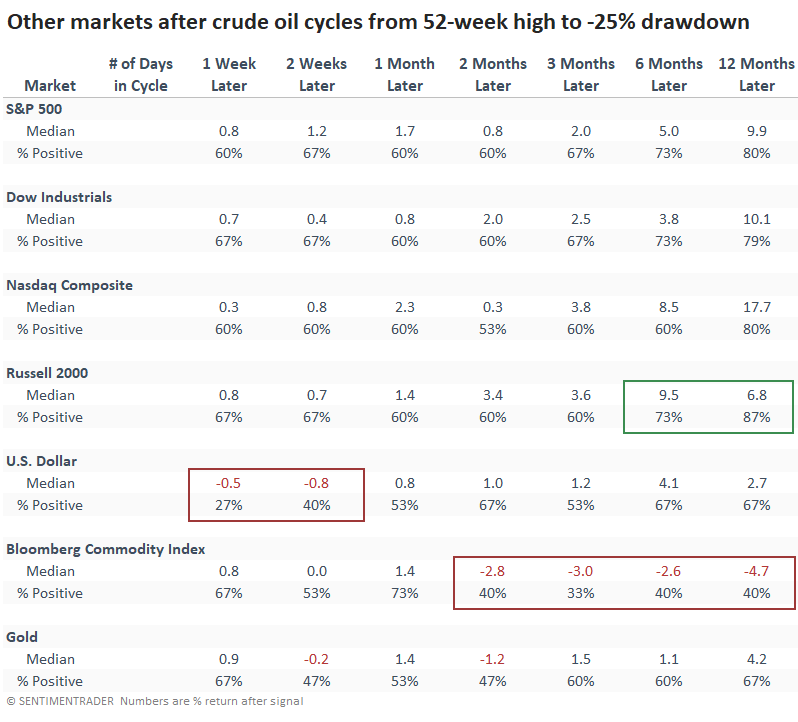
Looking at other markets, there was no evidence of a 25% decline in oil being an accurate doom signal. If it was effective at predicting economic weakness, then why was the small-cap Russell 2000 index the one with the most consistently positive returns? Doesn't make sense.
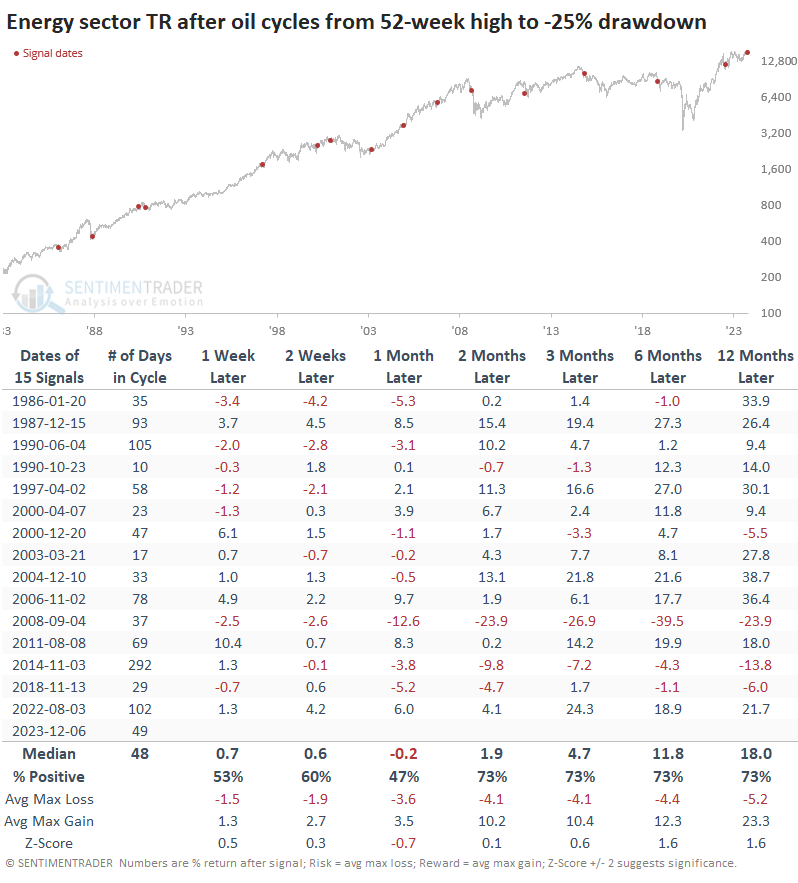
As for the Energy sector, those drawdowns in oil did not prove to be a consistent reason to worry. It did precede the worst of the financial crisis meltdown, but other than that, it was a feeble reason to sell the sector. The risk/reward for Energy stocks over the next year was excellent, and returns were consistently positive and above those of any random time.
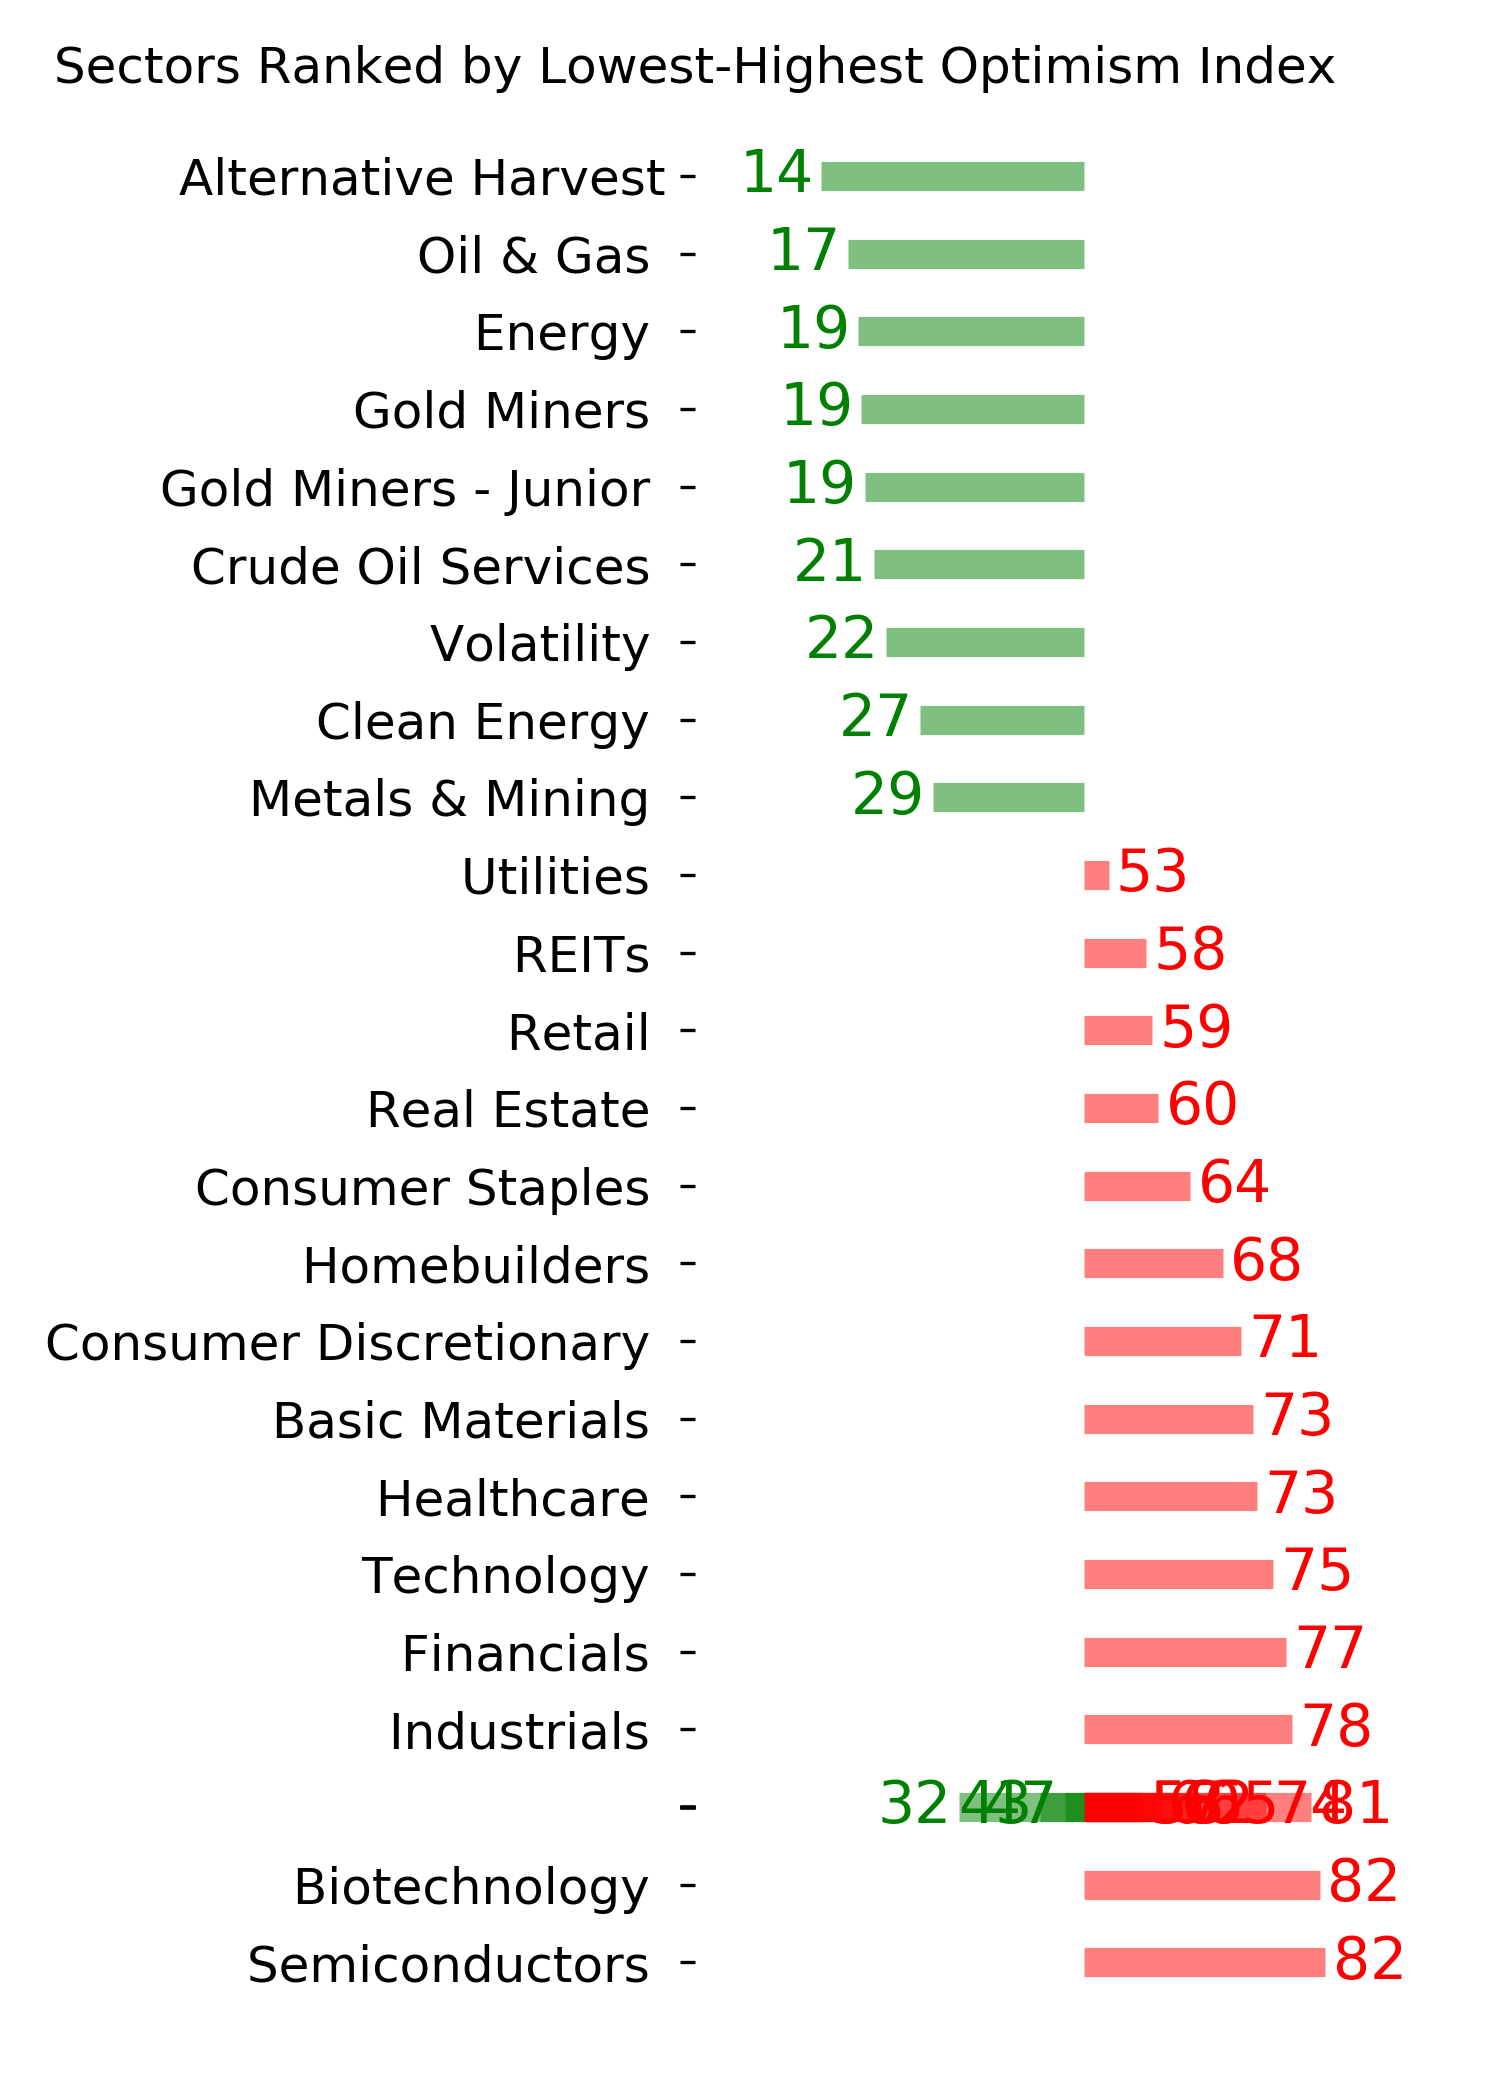
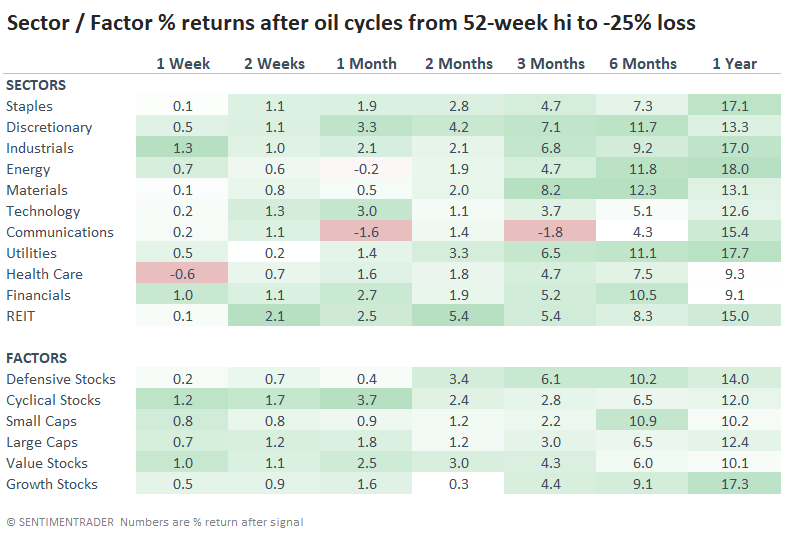
Among sectors and factors, there was some mixed performance. Cyclical stocks did stronger shorter-term, while Defensive ones did better longer-term. Energy stocks were among the strongest long-term performers.
What the research tells us...
Watching what investors pay attention to has often given us opportunities to look at actual data and determine if there is a disconnect between reality and a good story. Very often, there is.
There is some evidence that investors have become quite comfortable with the idea of a continuation of the rally, but anecdotally, it's odd how much focus there is on what can go wrong. The drop in crude oil is an excellent example of macro doomers making hay with something that might make sense in theory but, in practice, has zero value. Big drops in oil have zero predictive value in warning of dangers in the economy or the stock market.
Indicators at Extremes
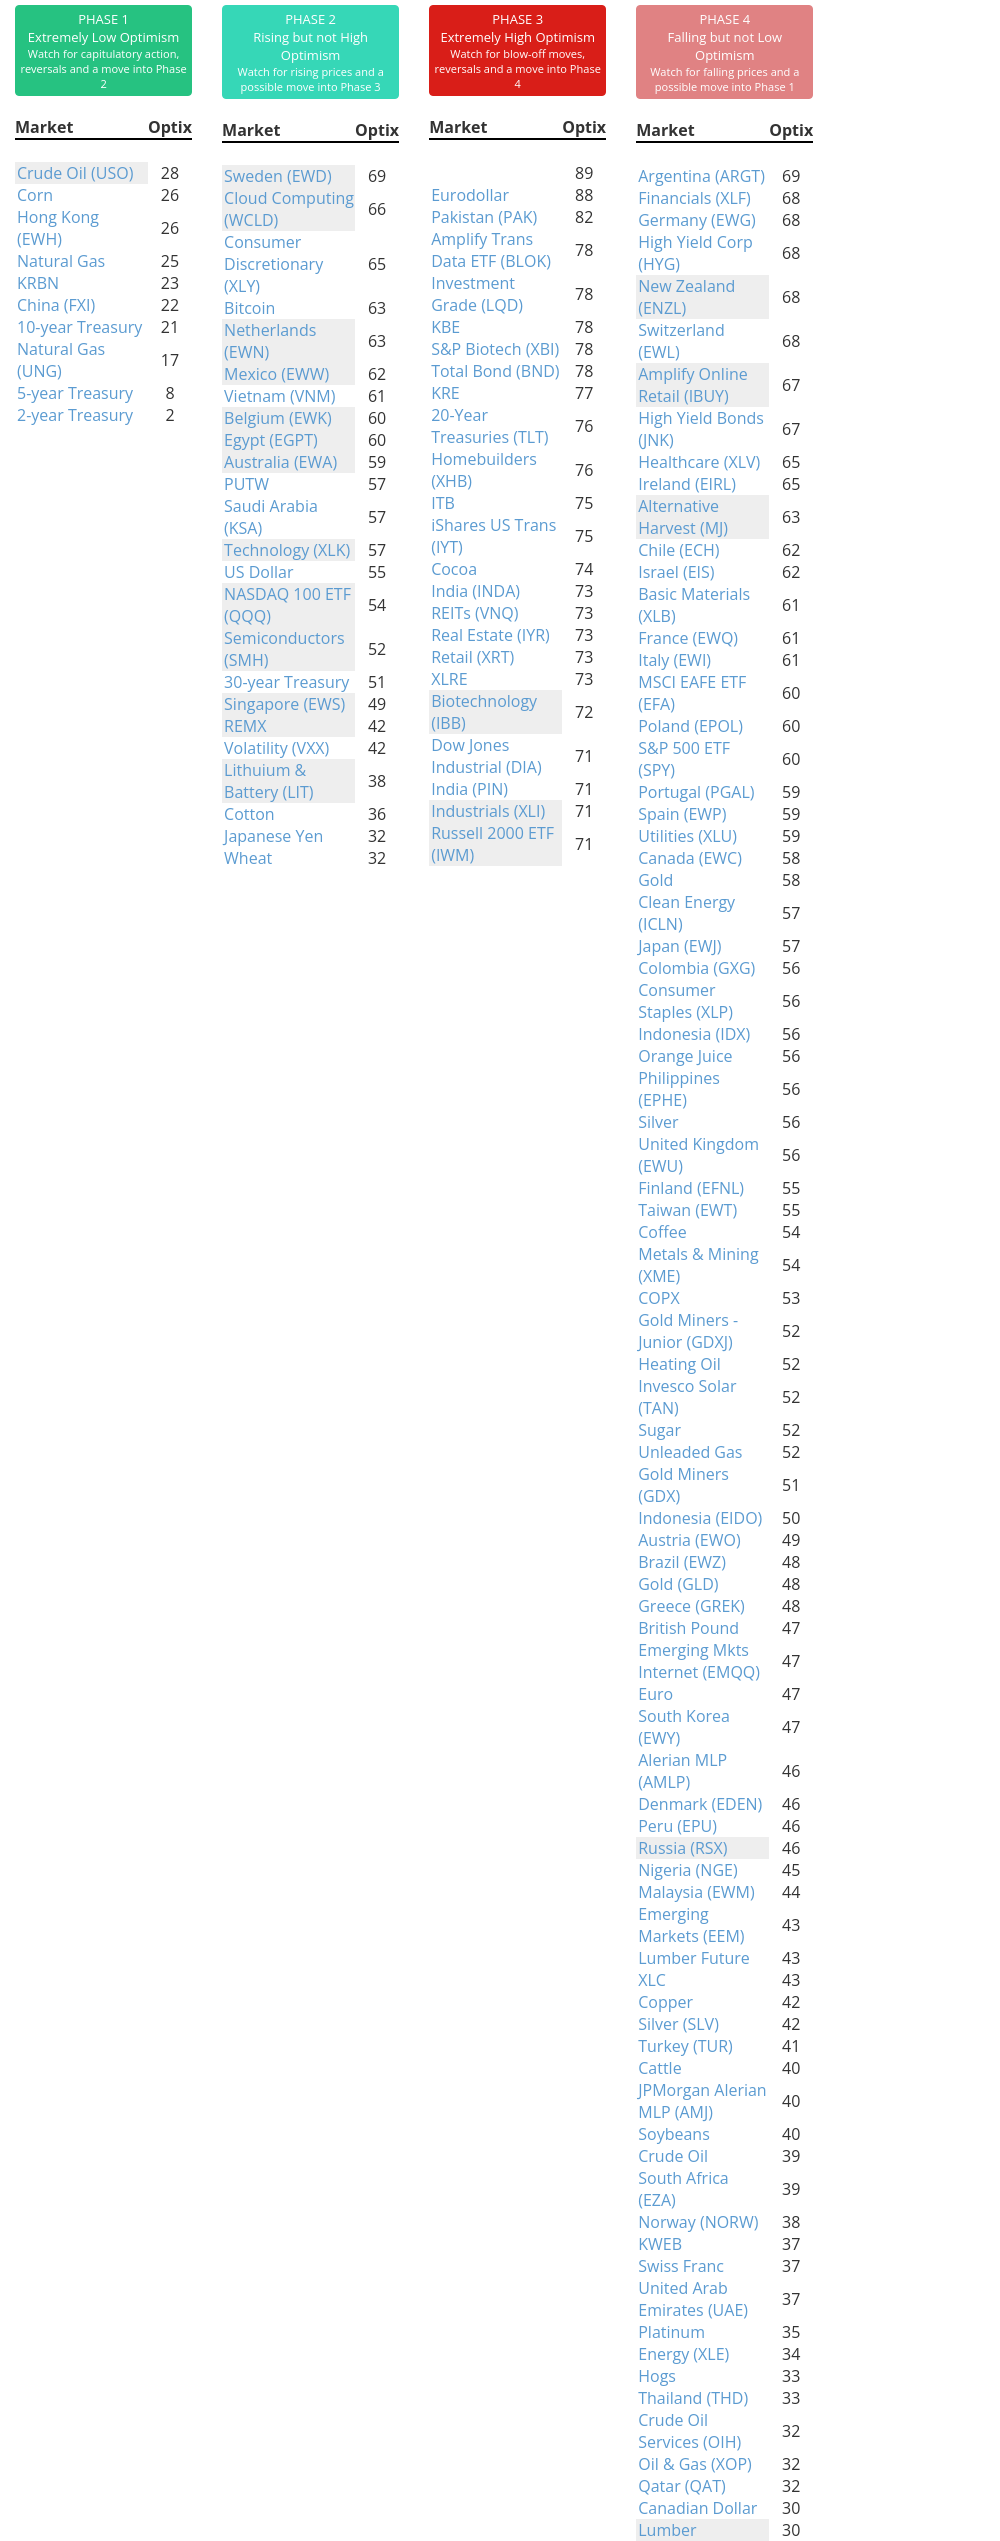
Phase Table
Ranks
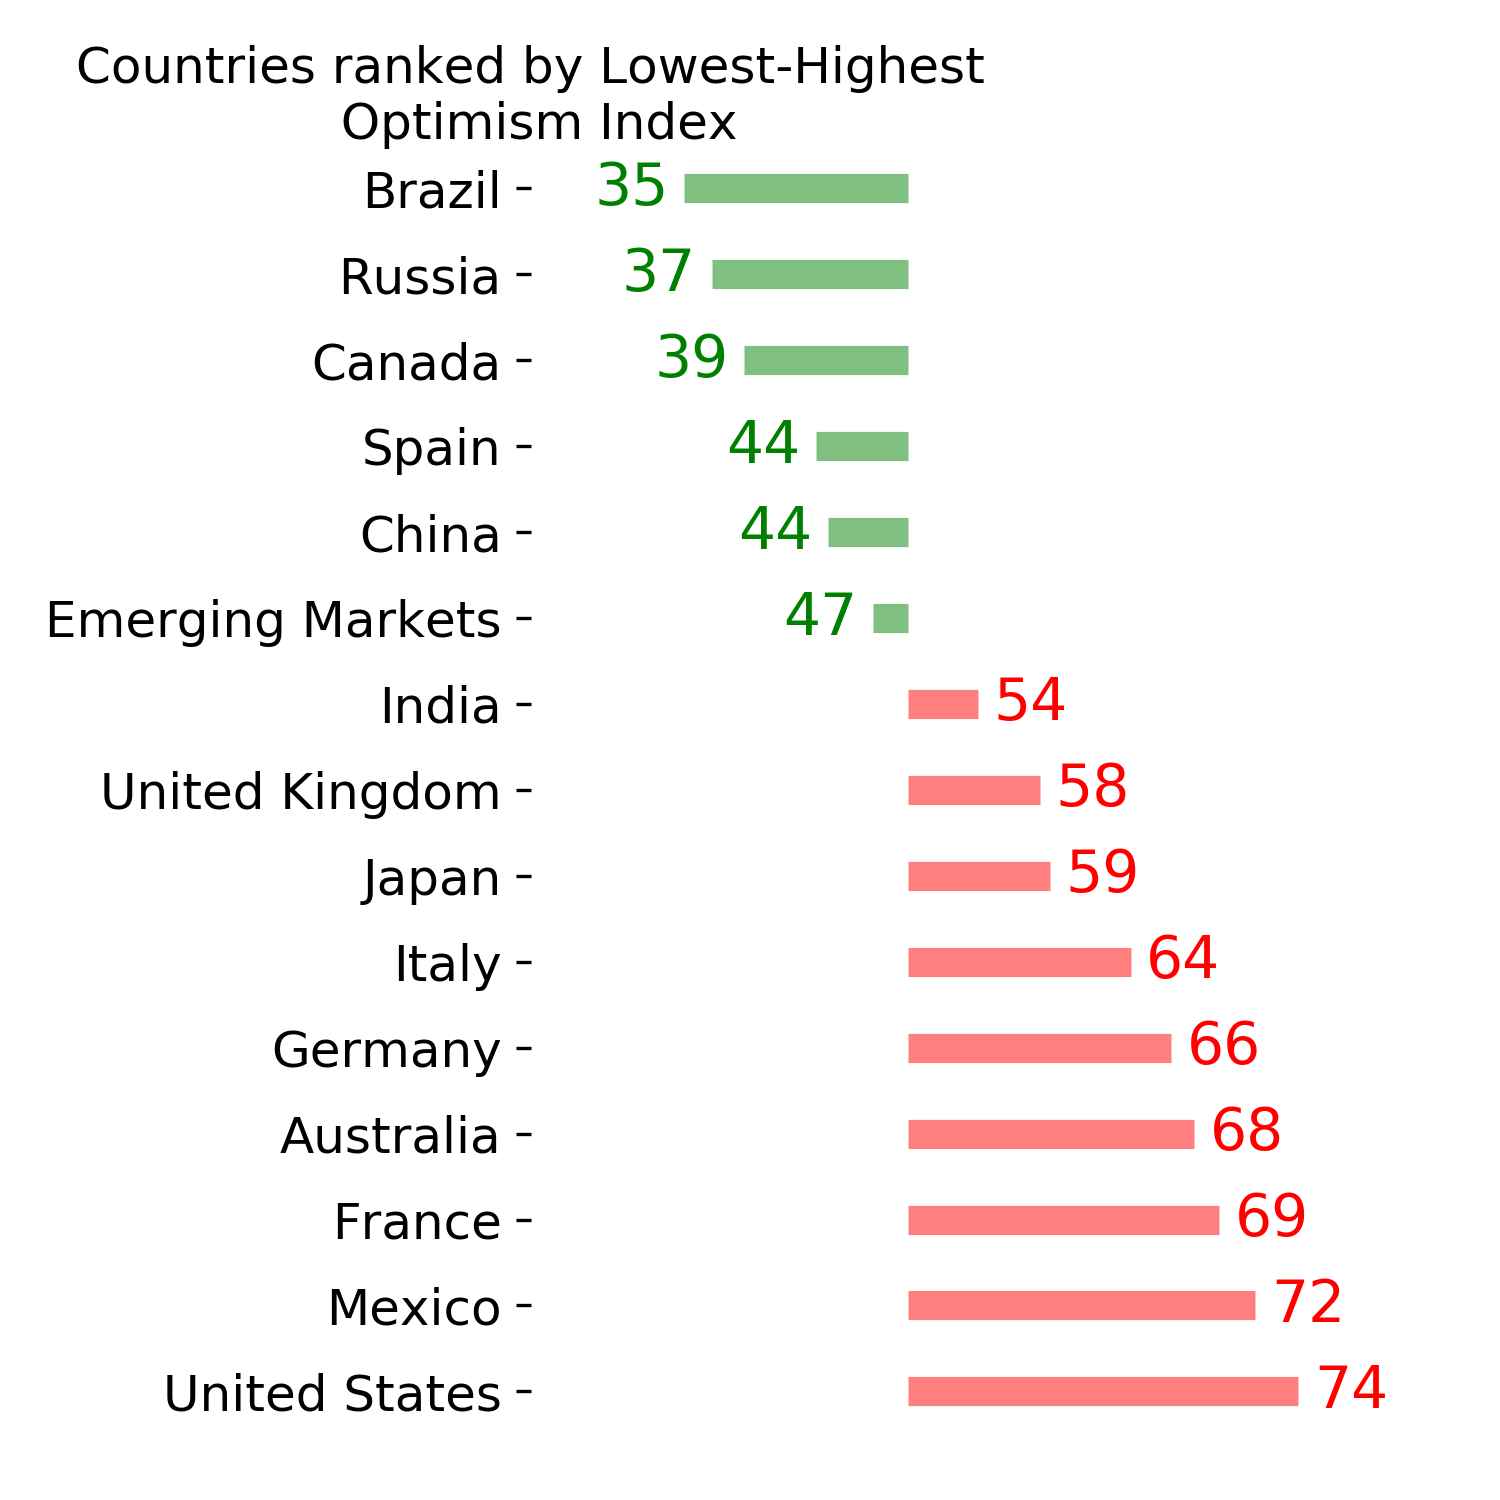
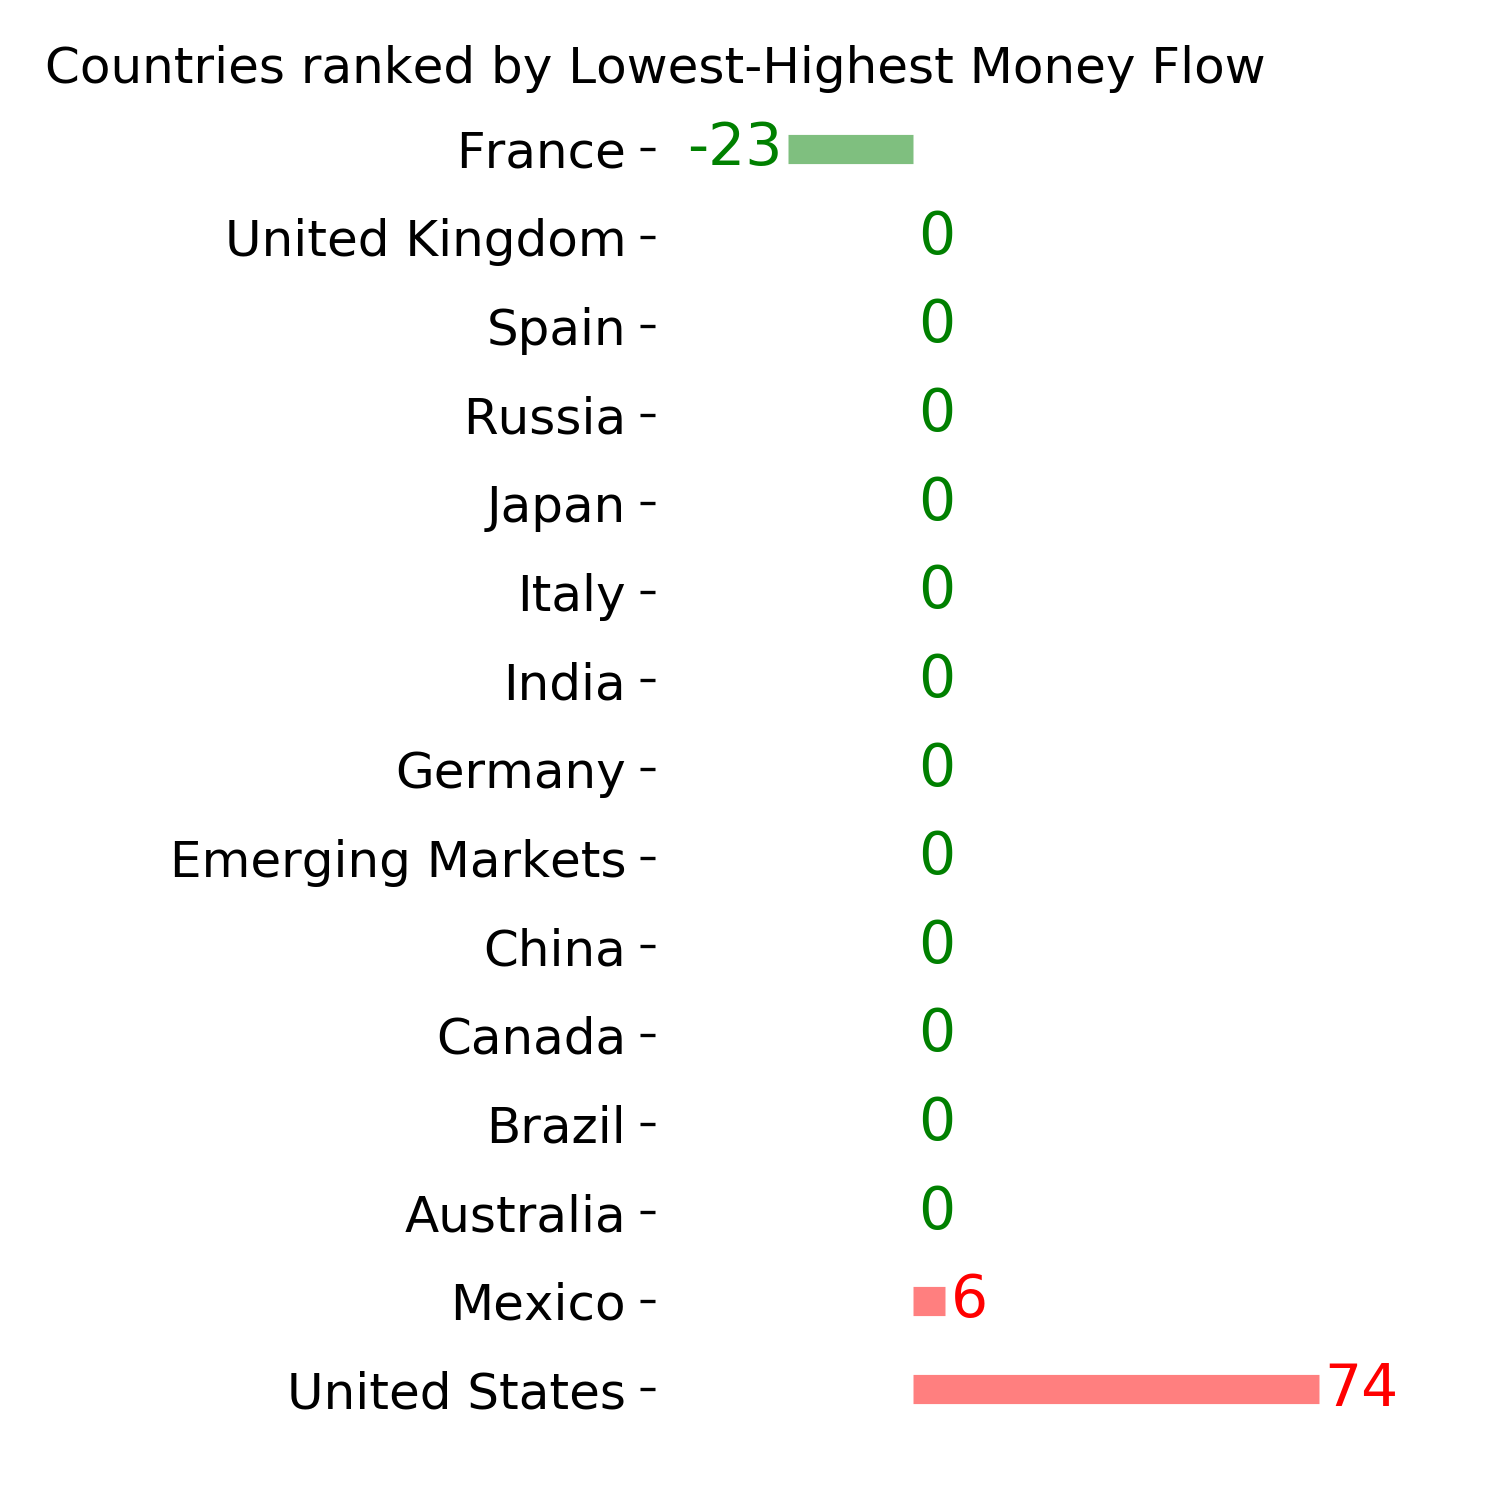
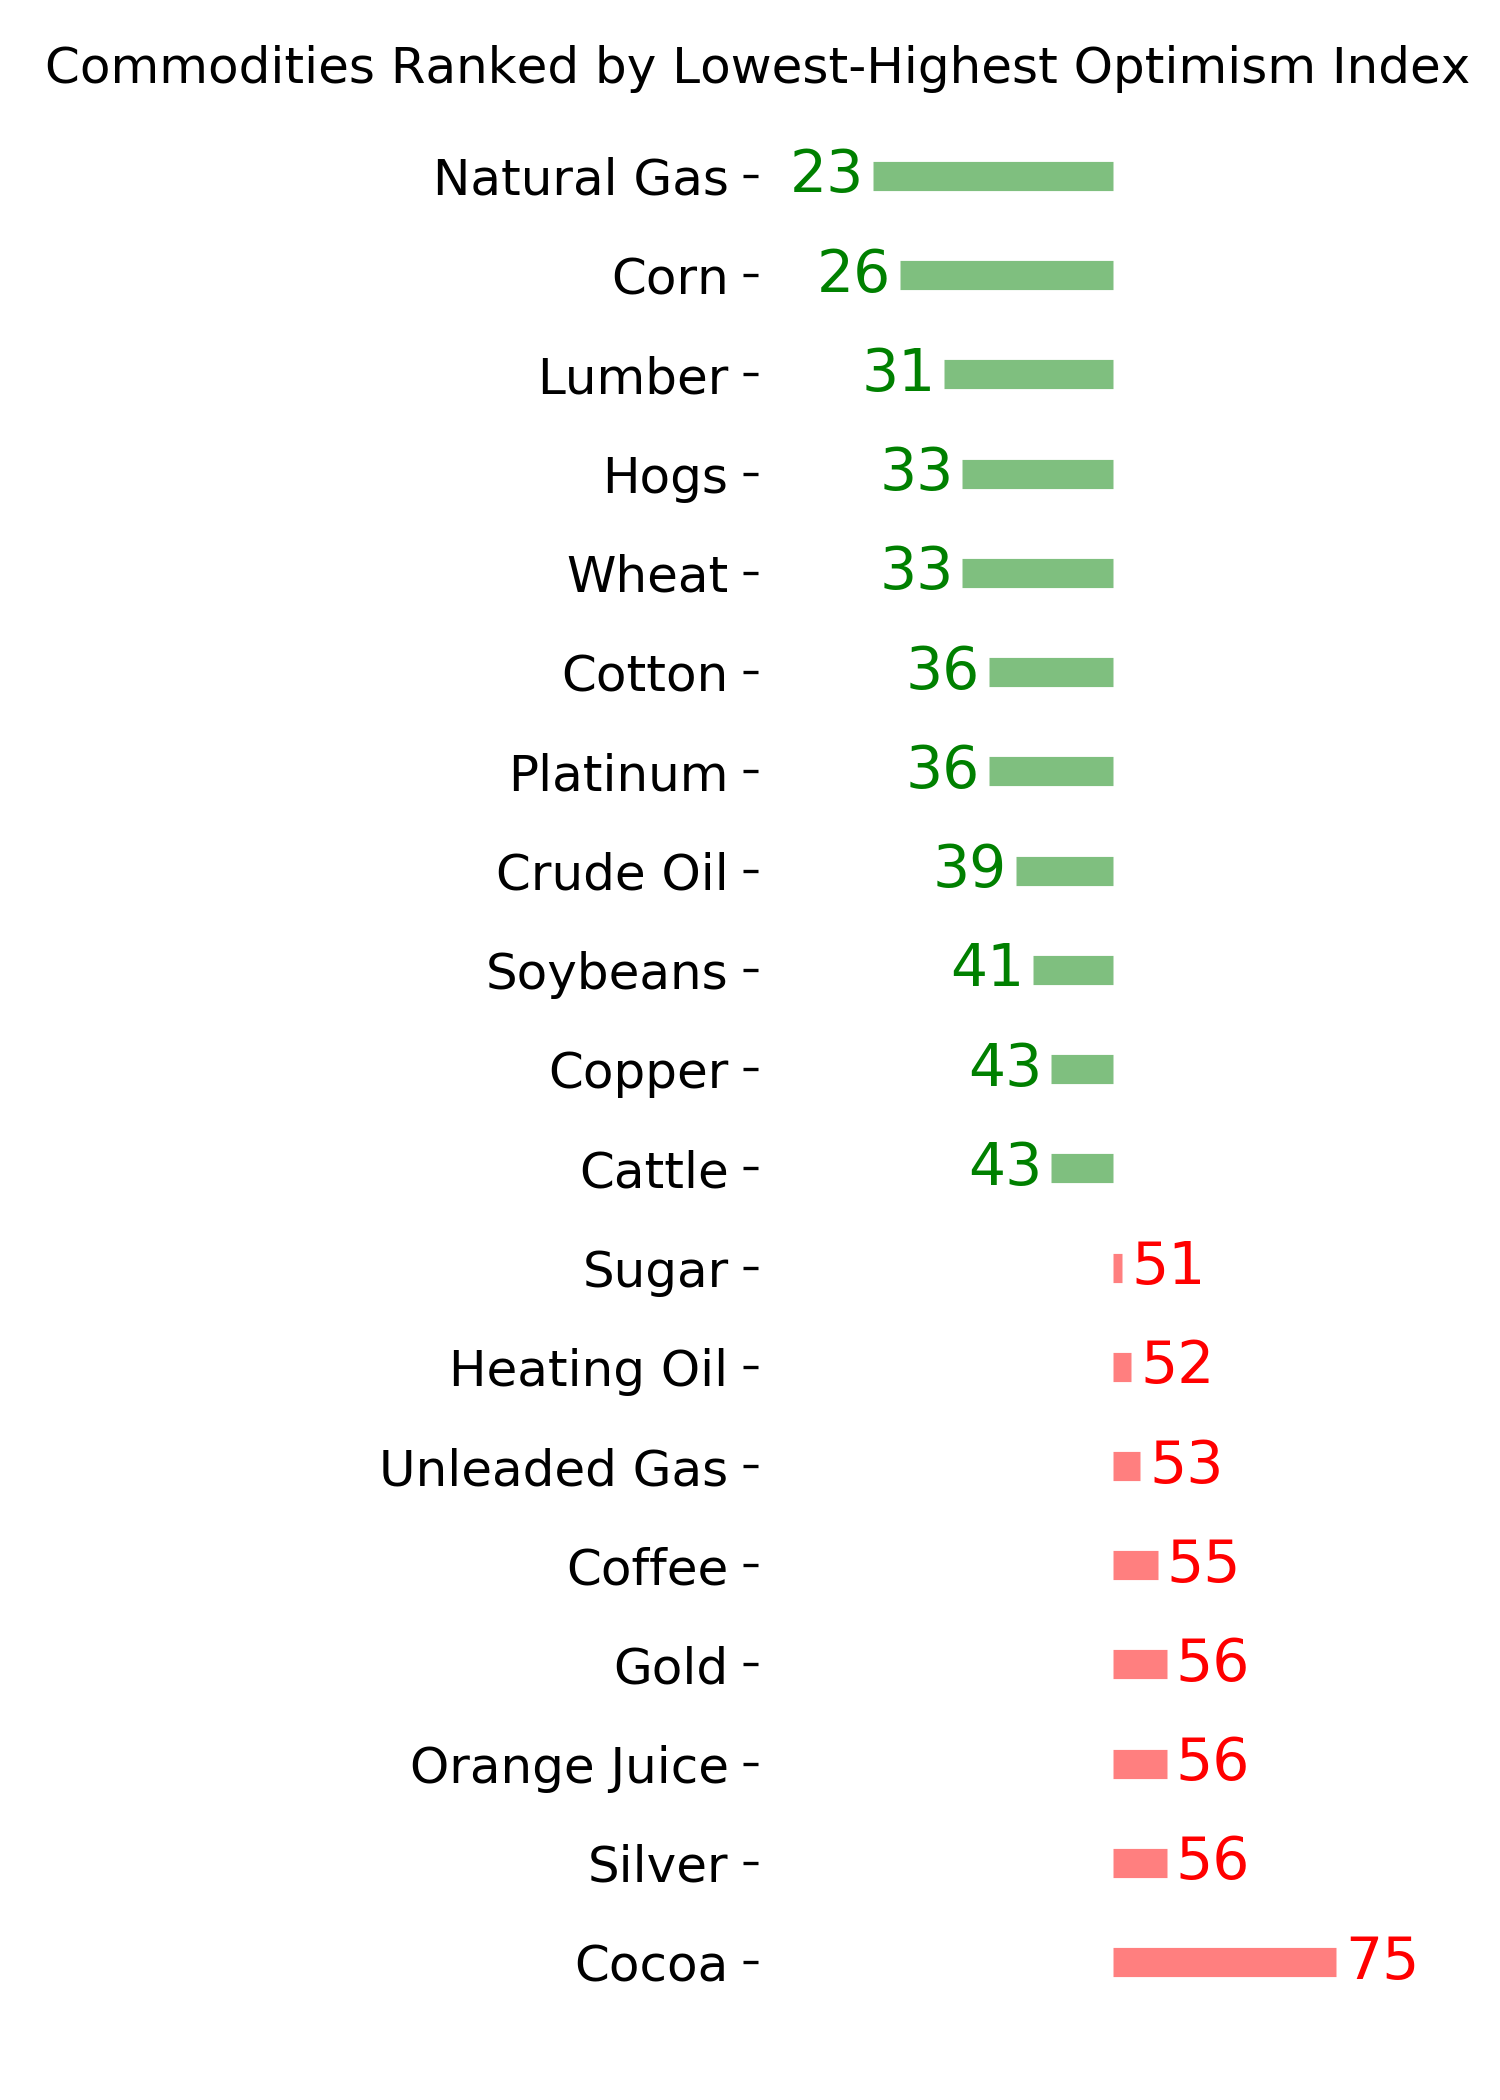
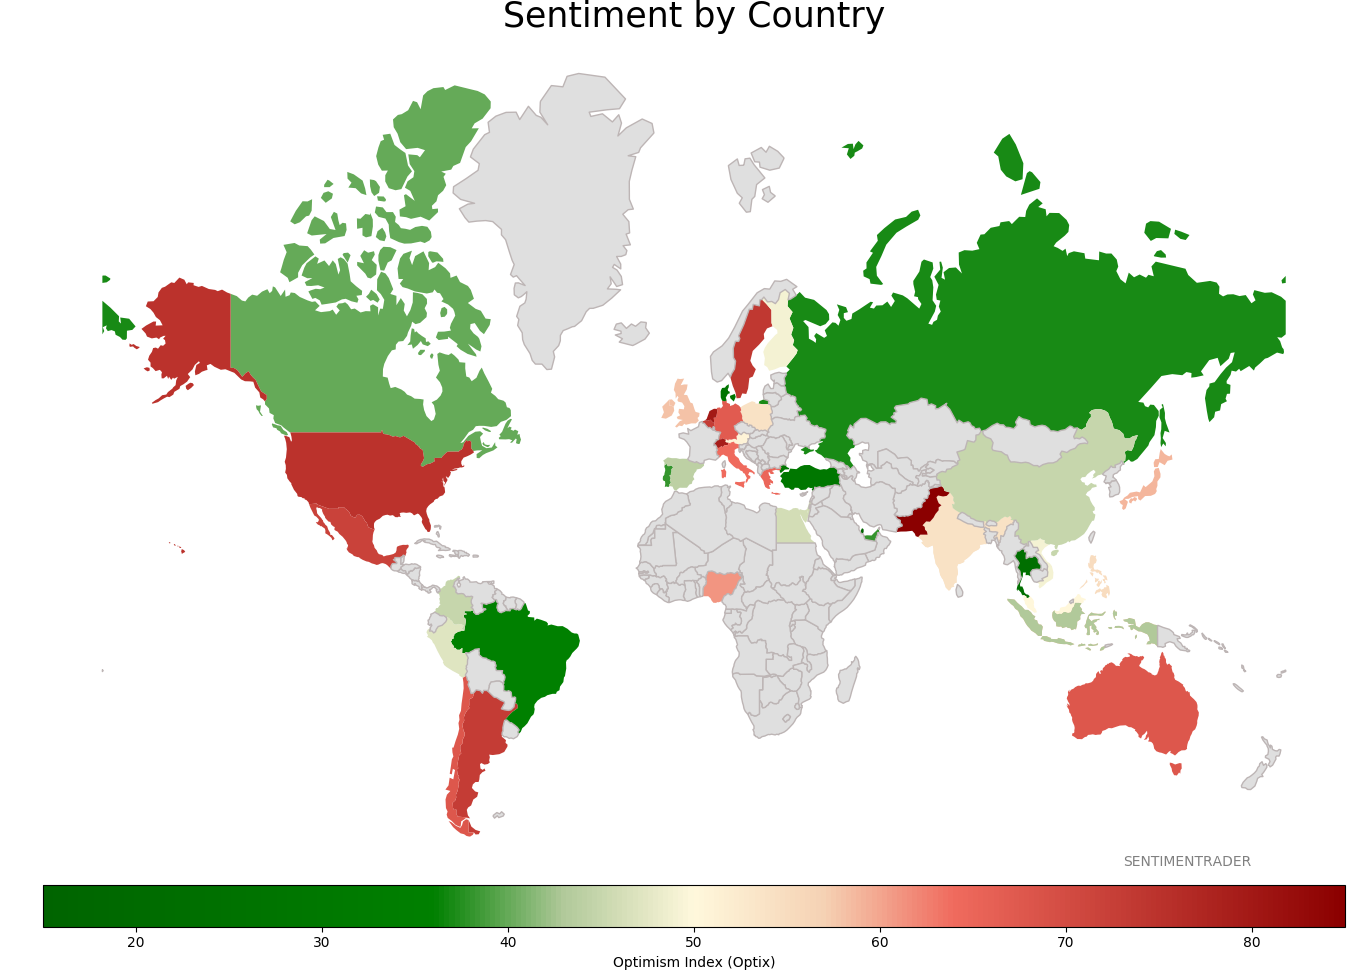
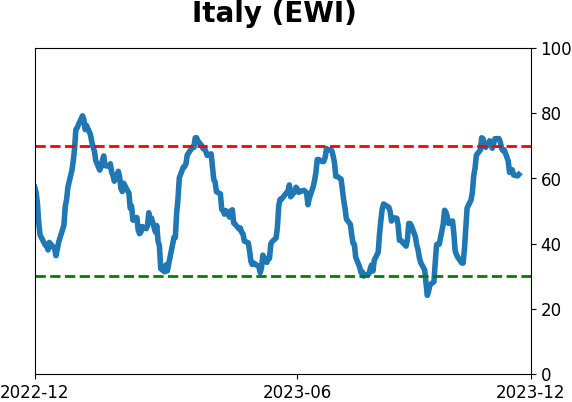
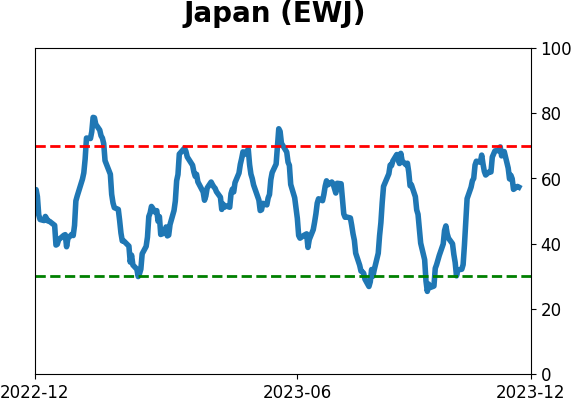
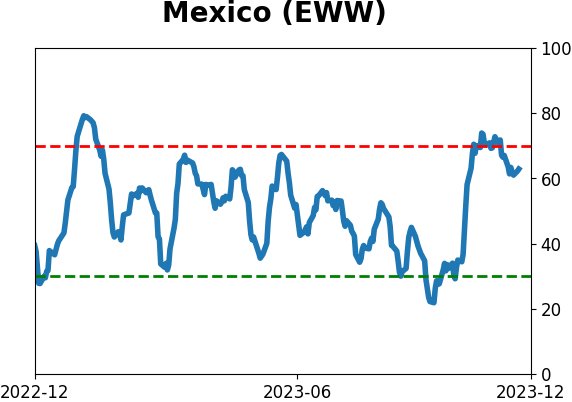
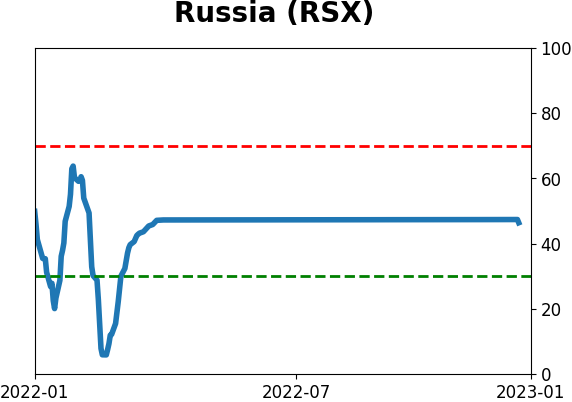
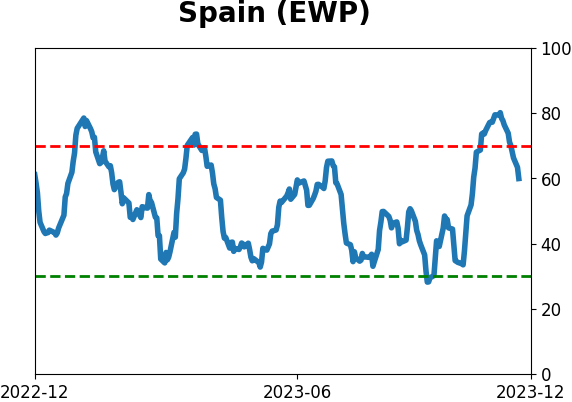
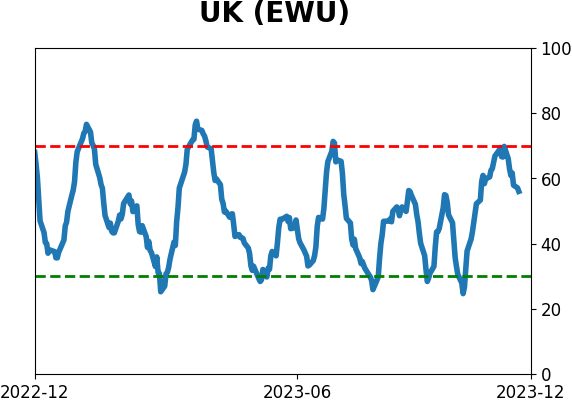
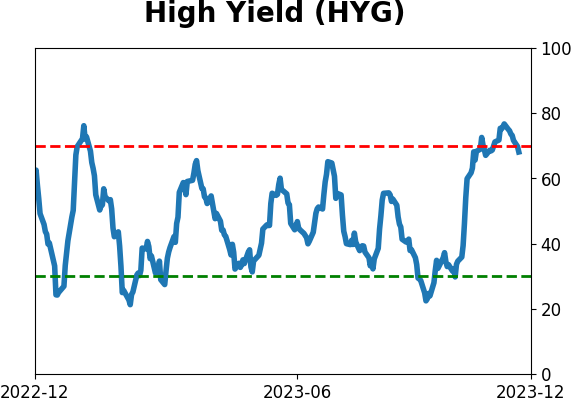
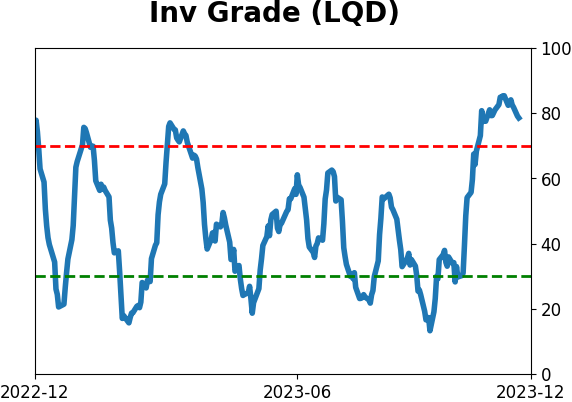
Sentiment Around The World
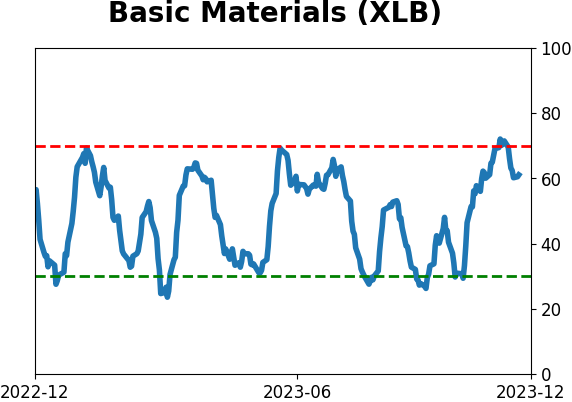
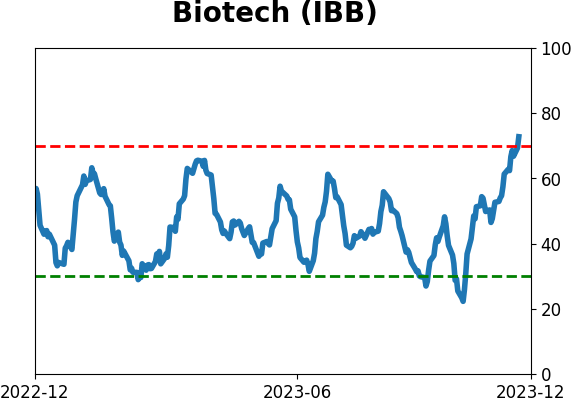
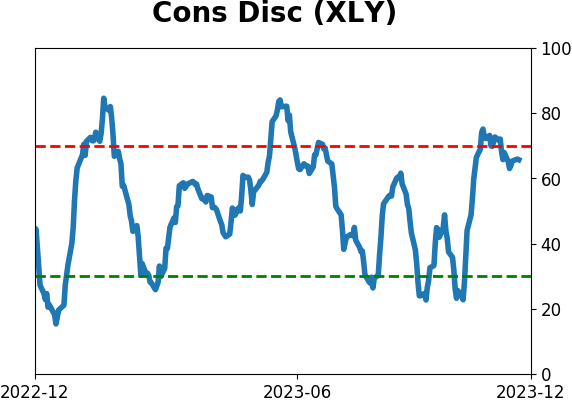
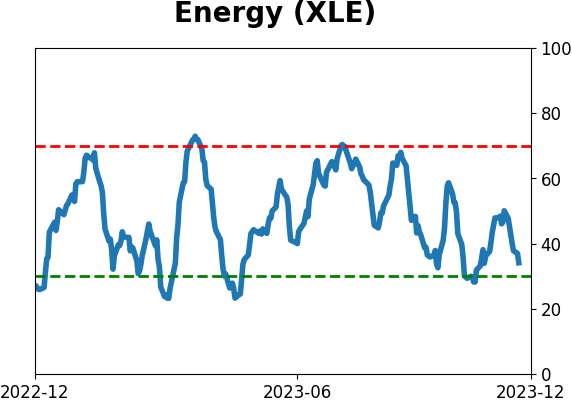
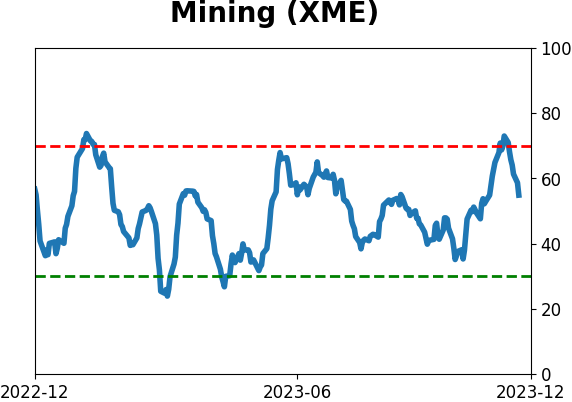
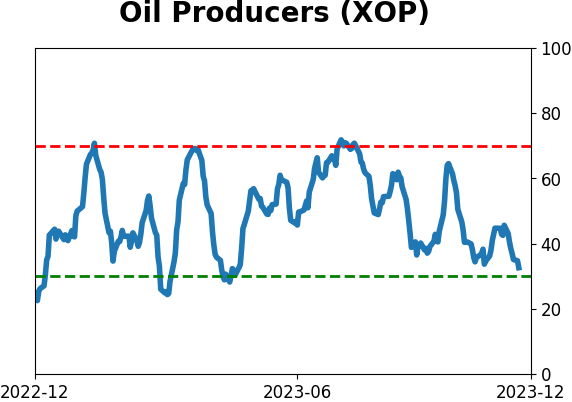
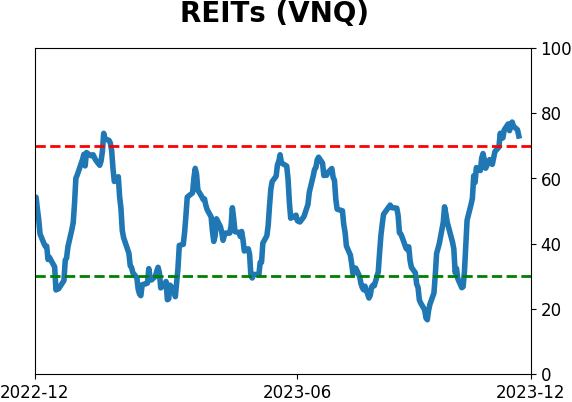
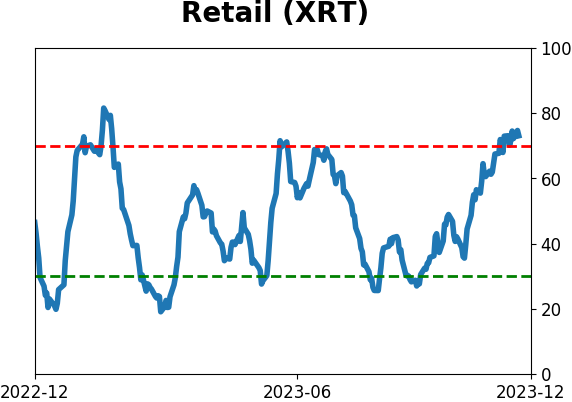
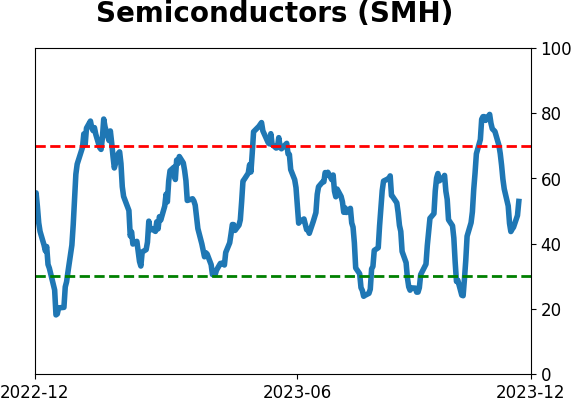
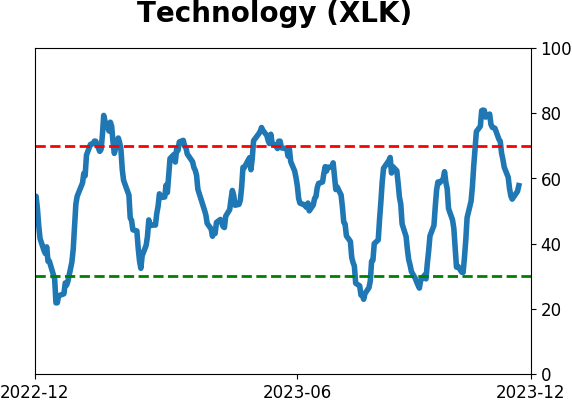
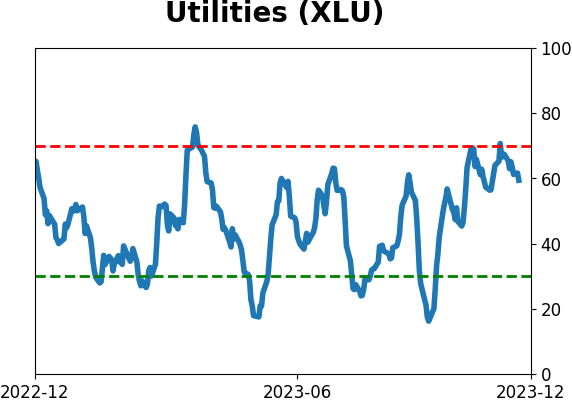
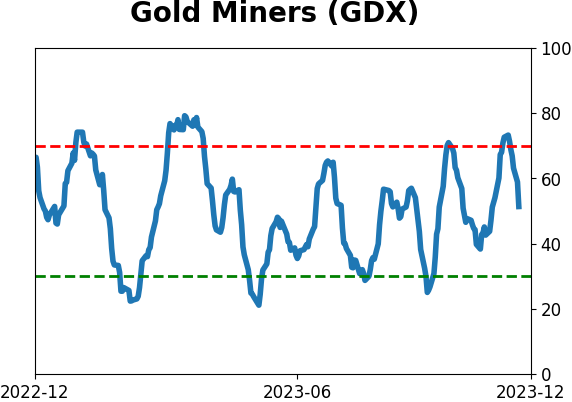
Optimism Index Thumbnails
|
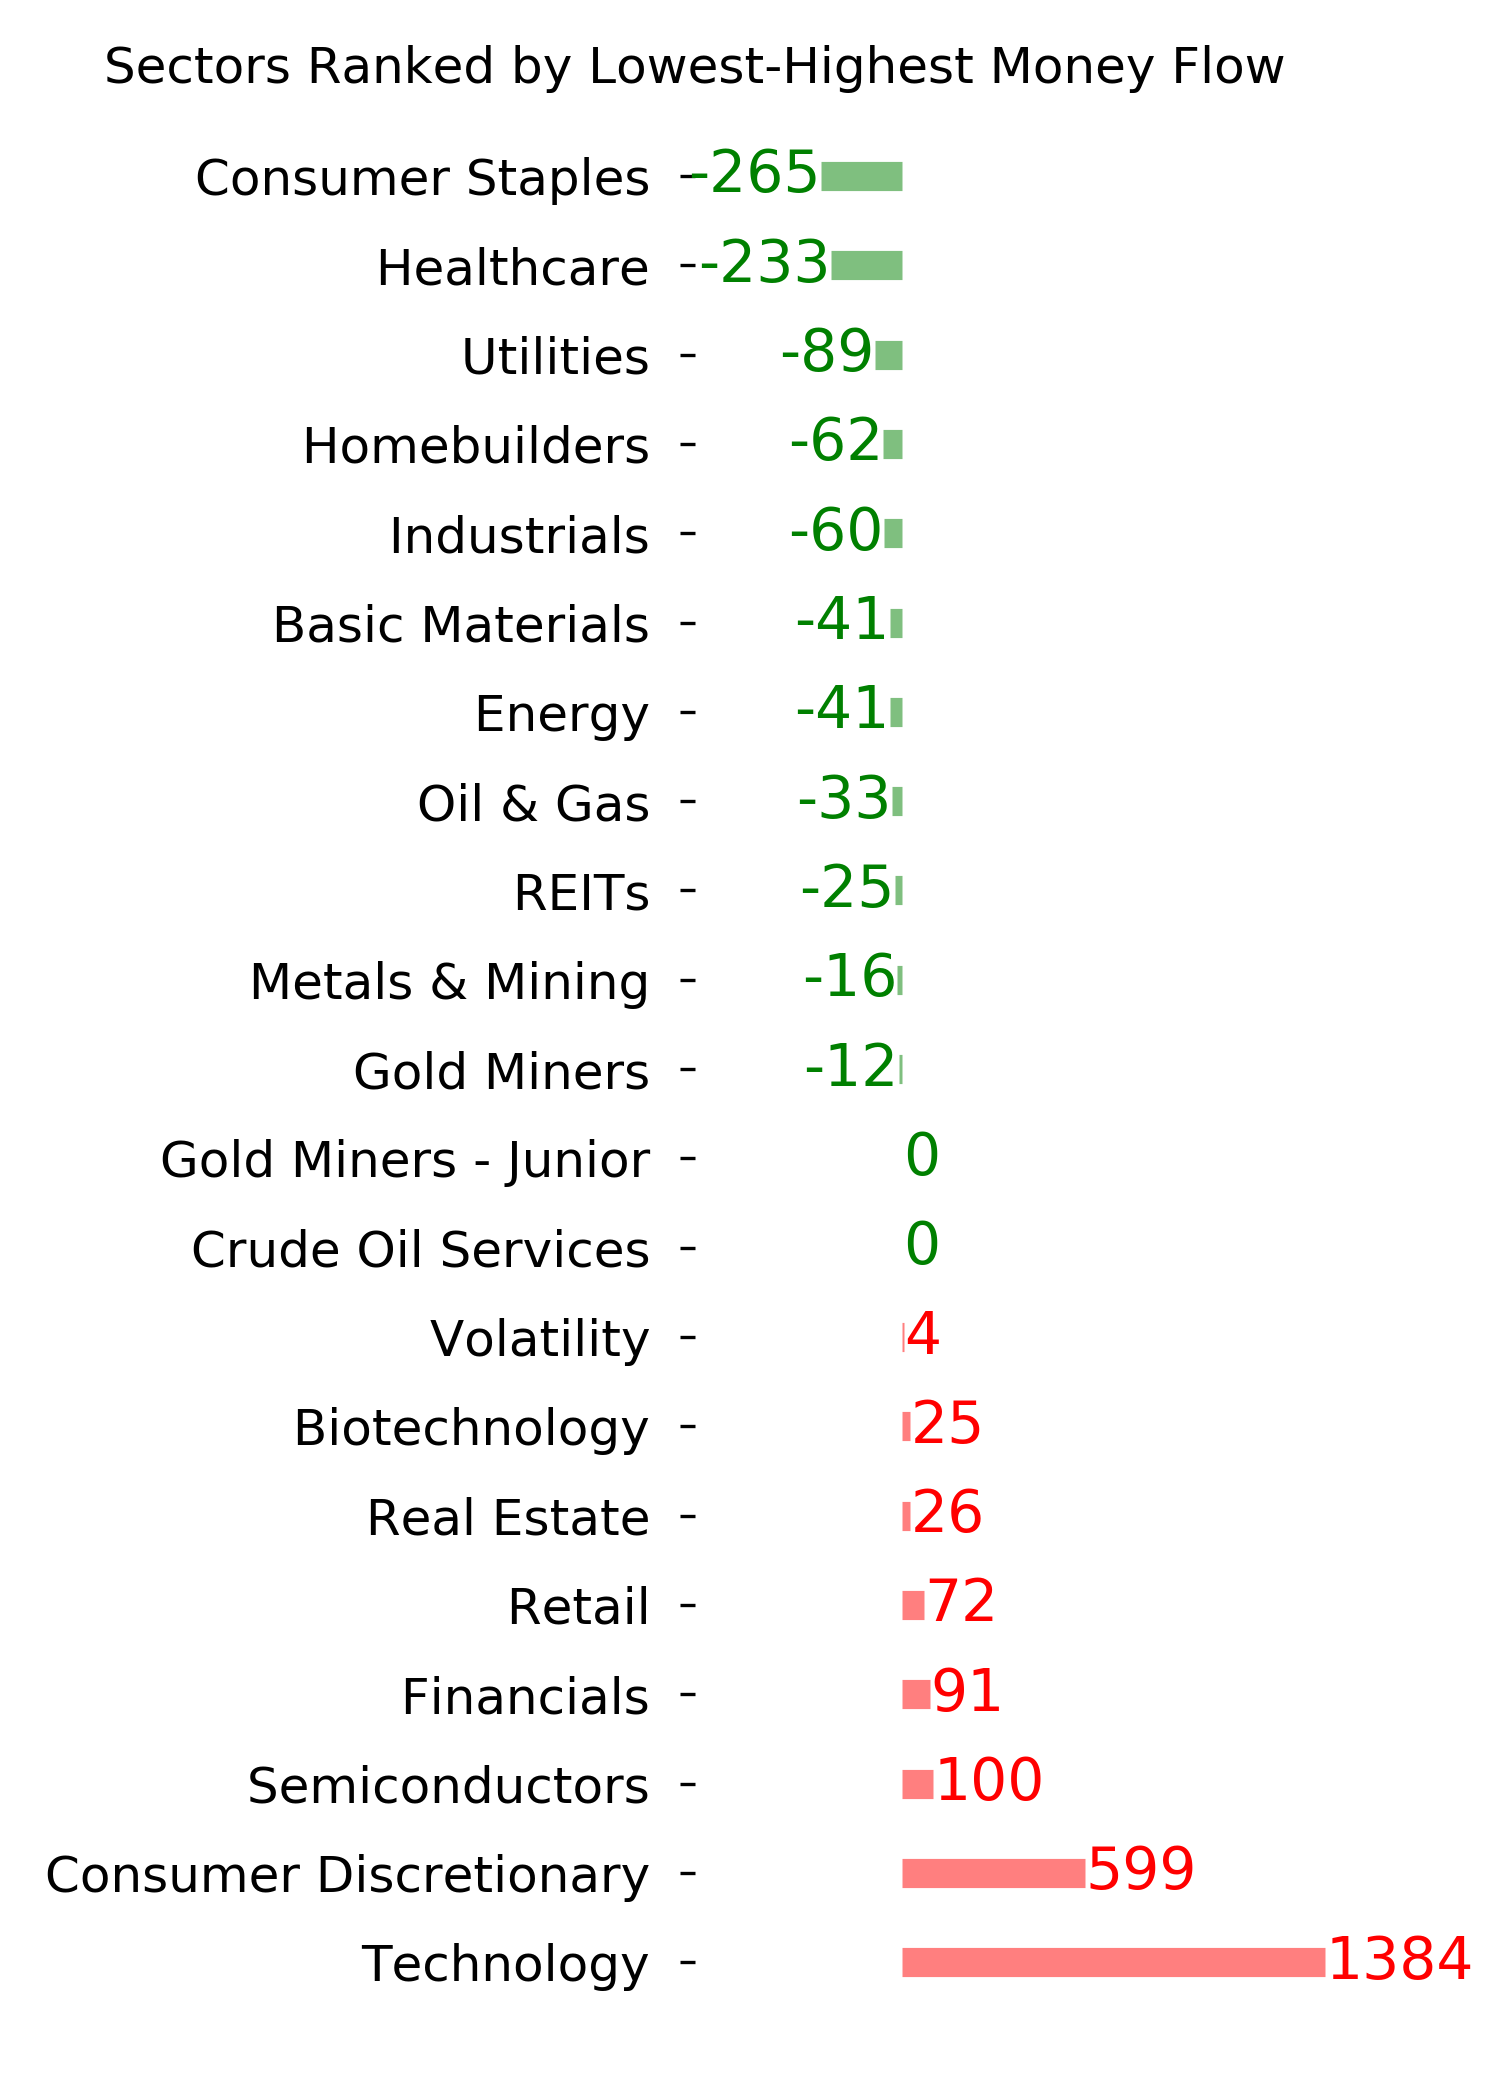
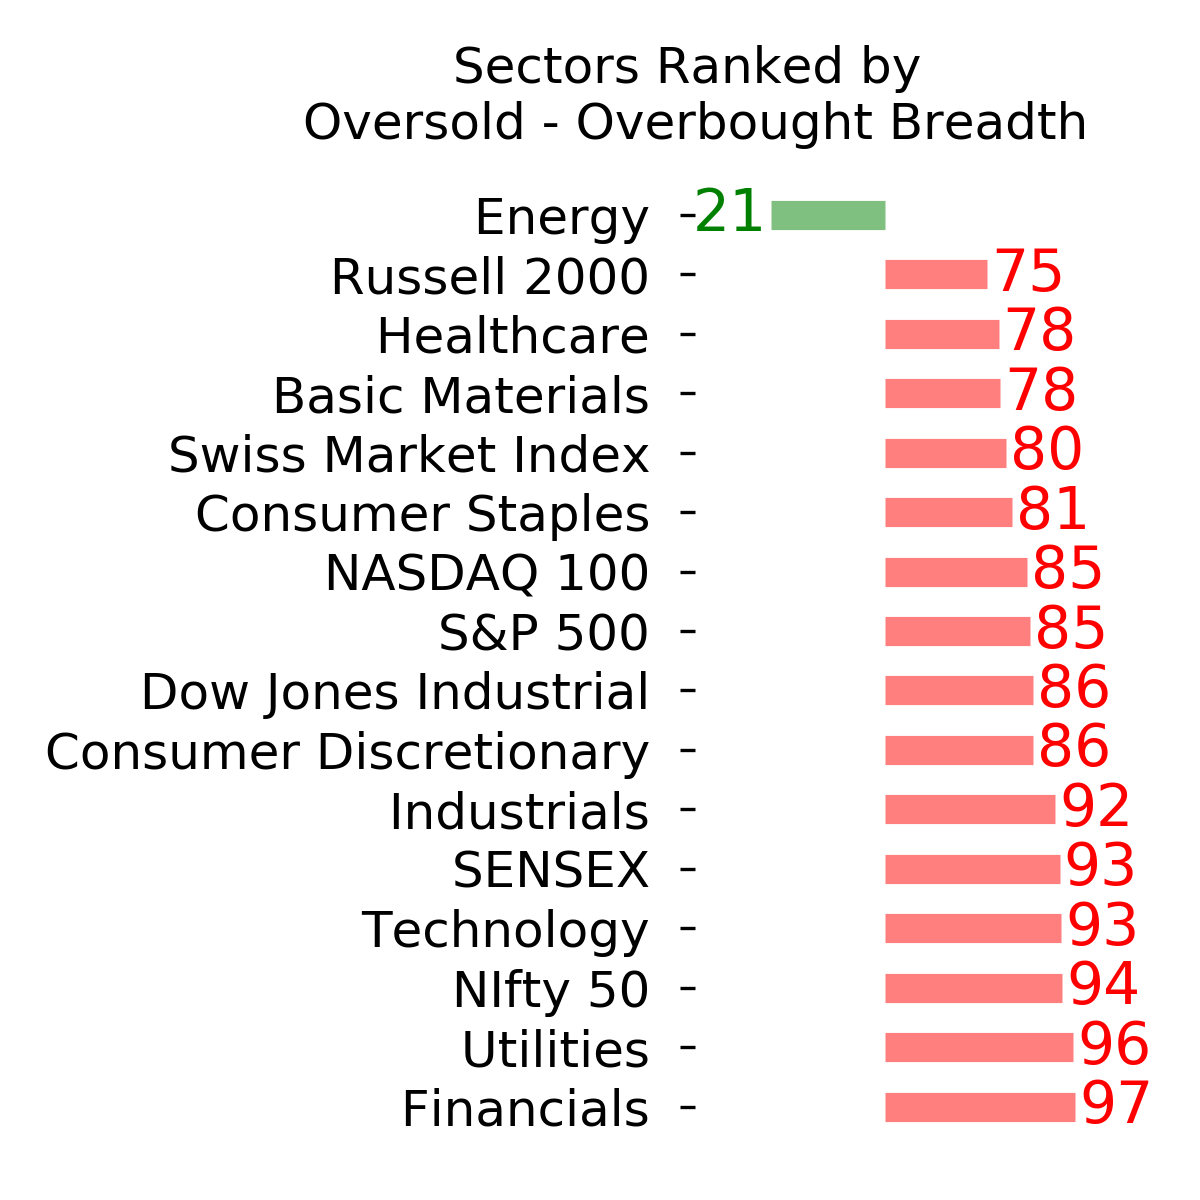
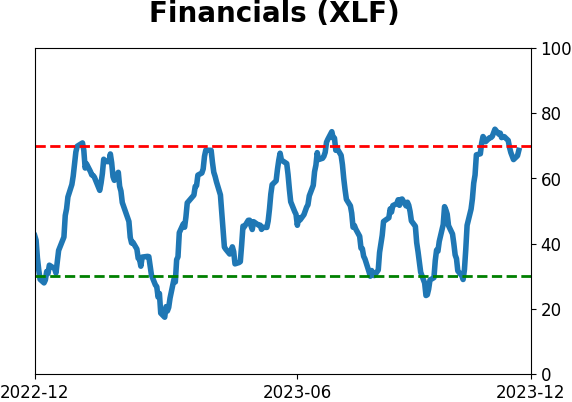
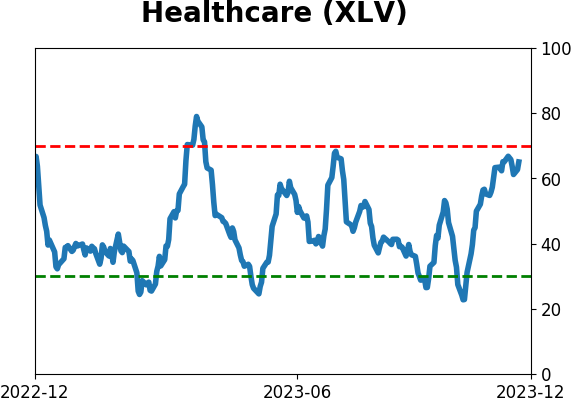
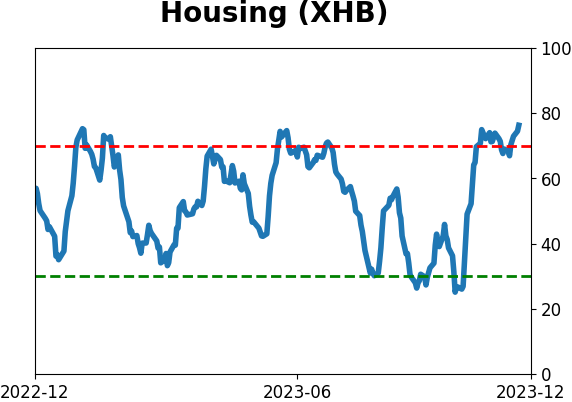
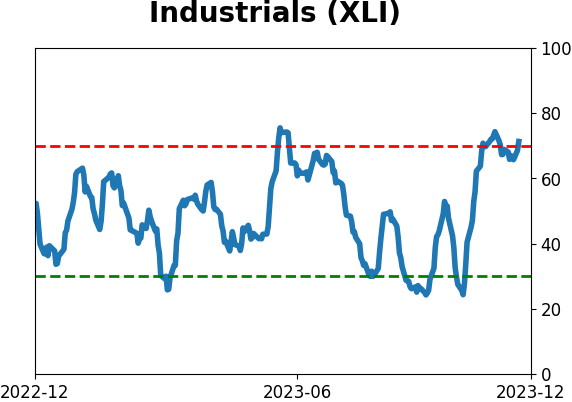
Sector ETF's - 10-Day Moving Average
|
|
|
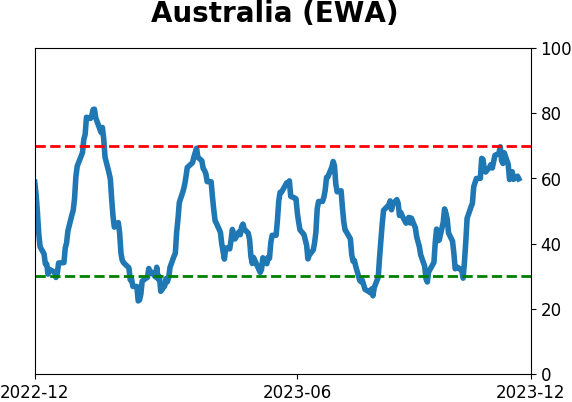
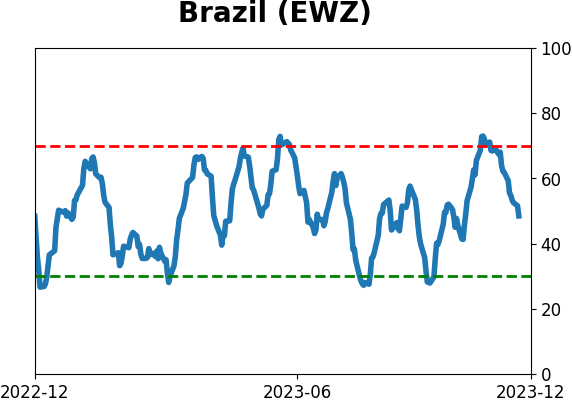
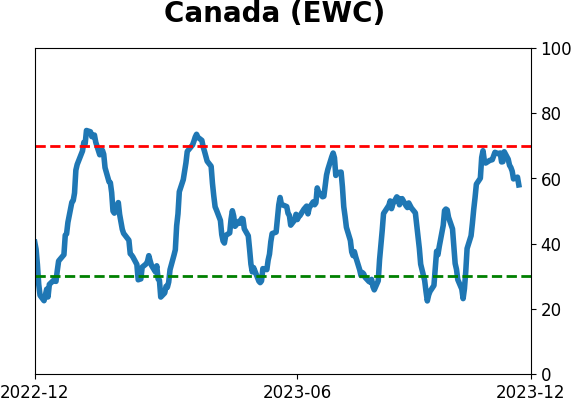
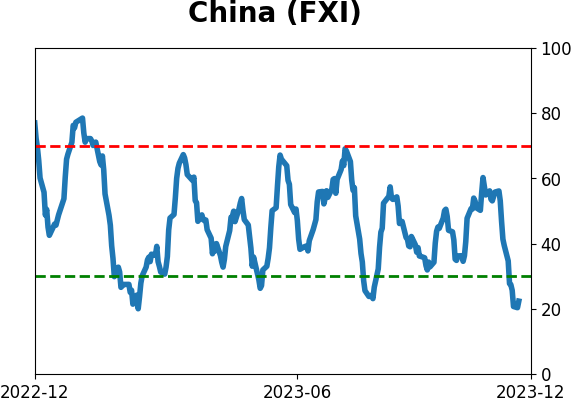
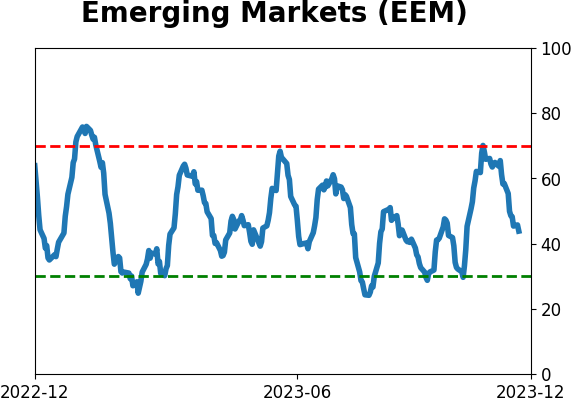
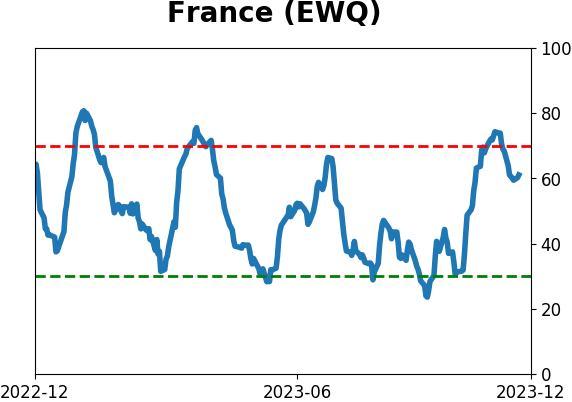
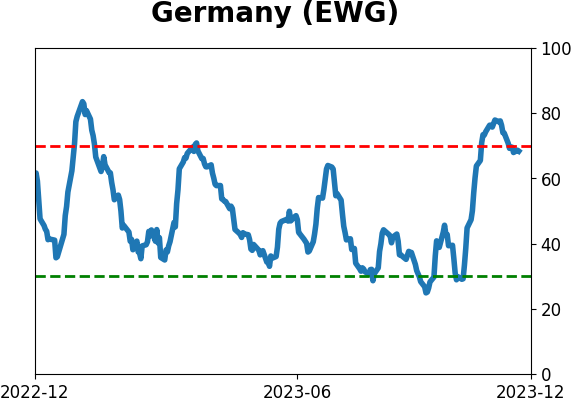
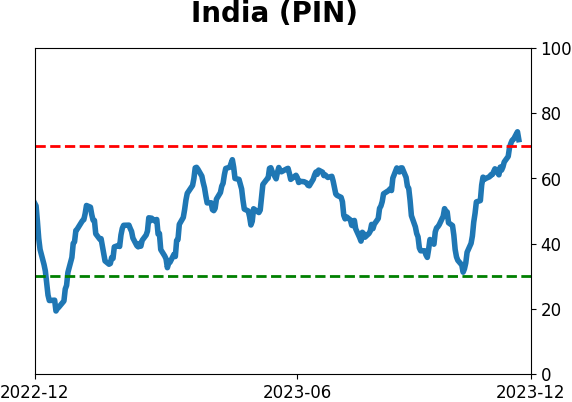
Country ETF's - 10-Day Moving Average
|
|
|
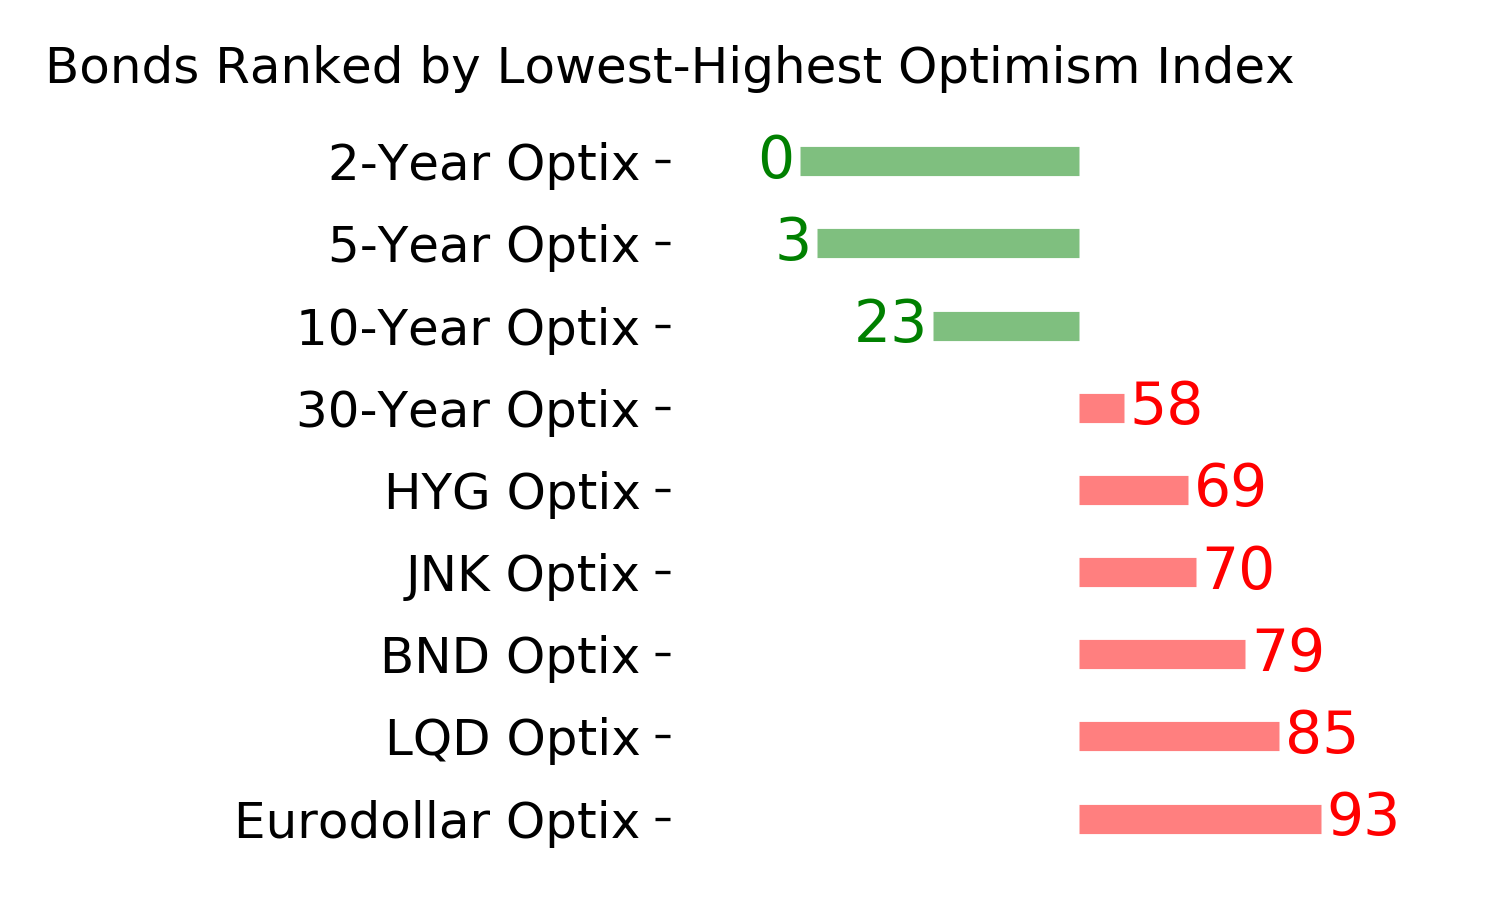
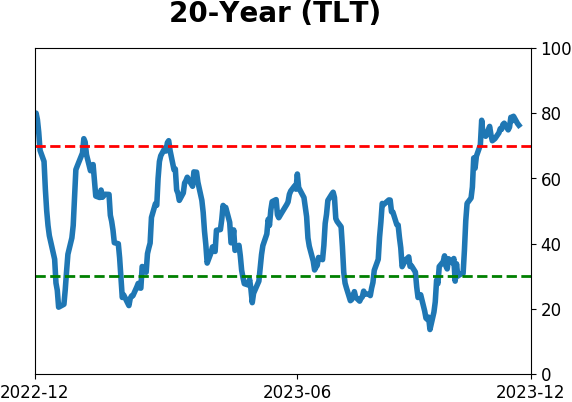
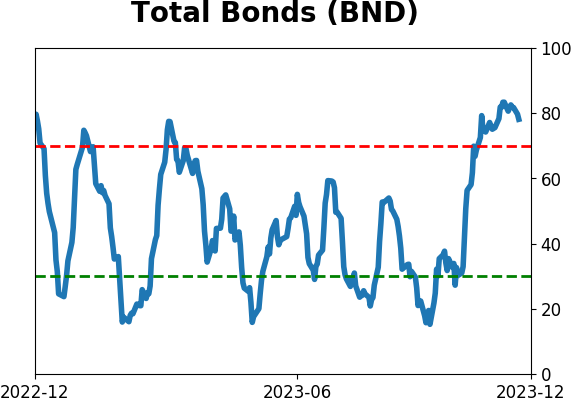
Bond ETF's - 10-Day Moving Average
|
|
|
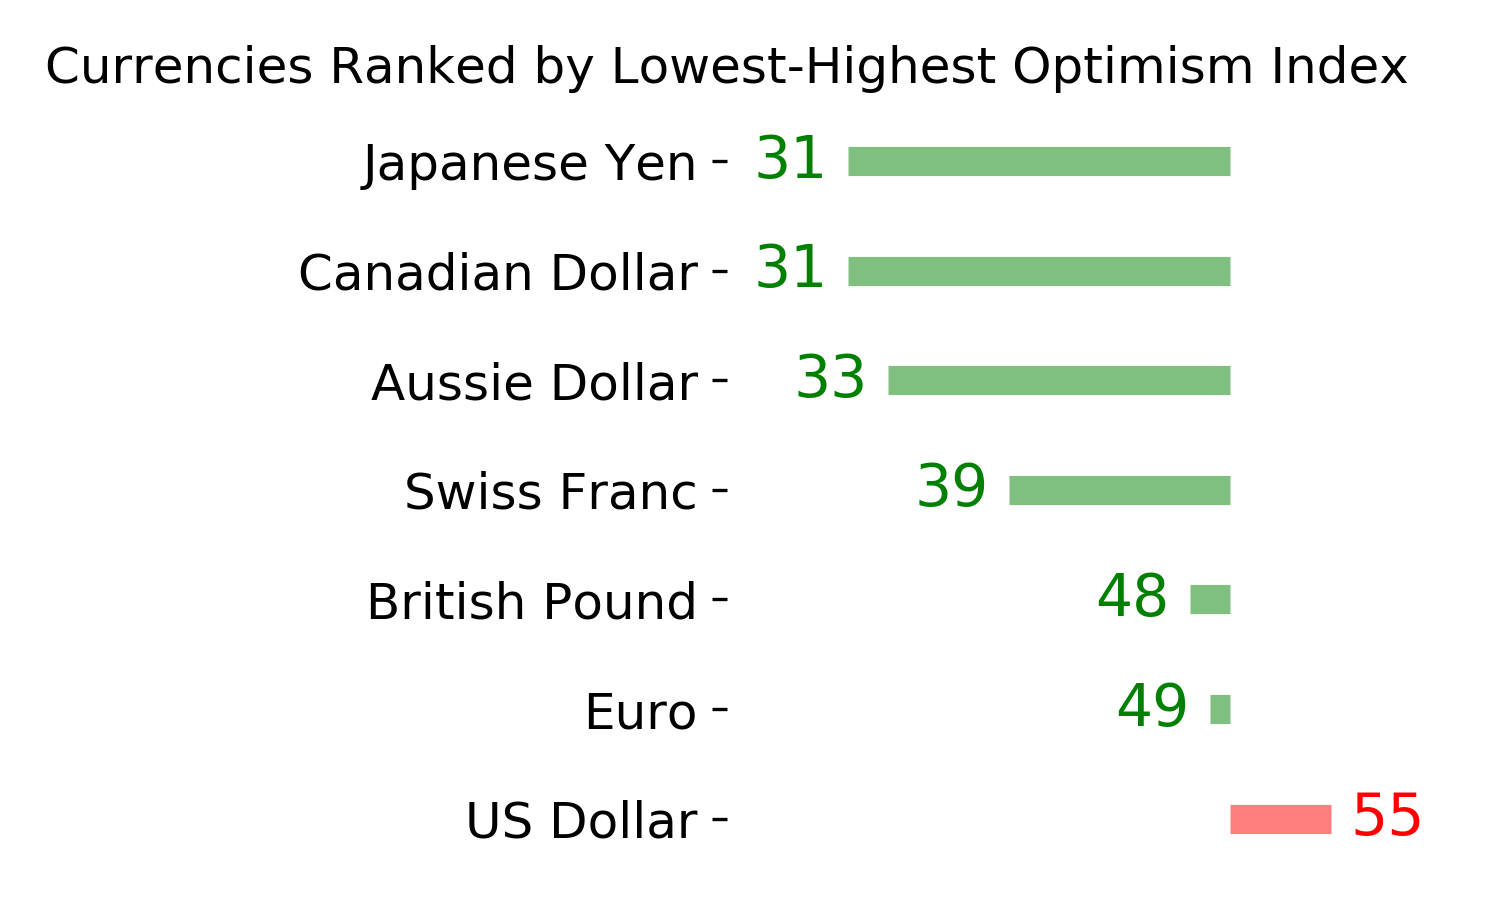
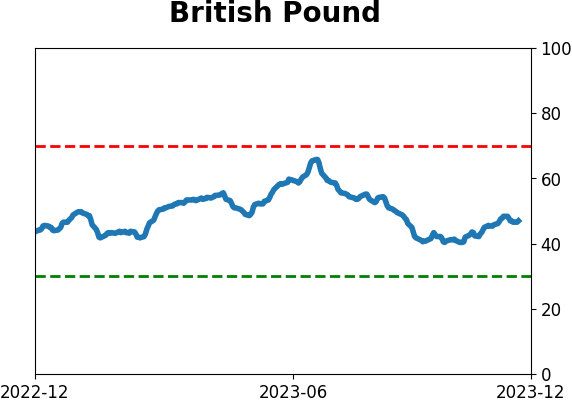
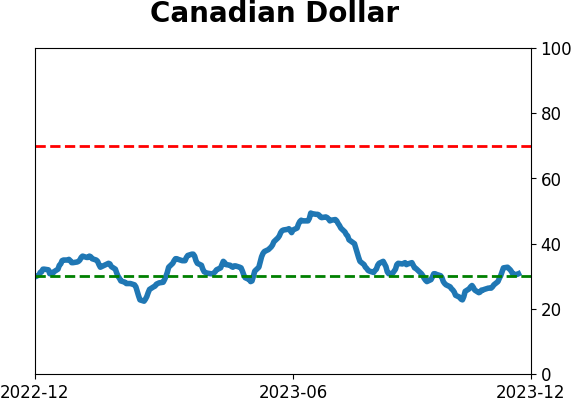
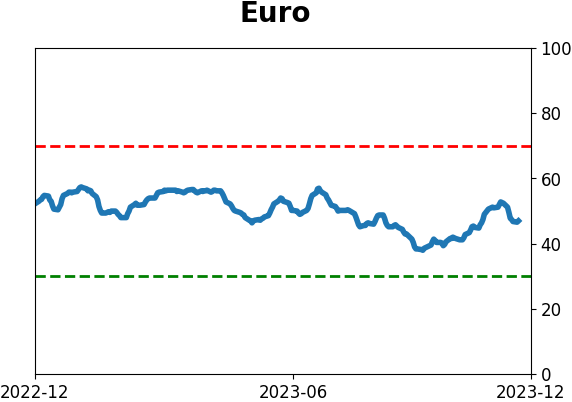
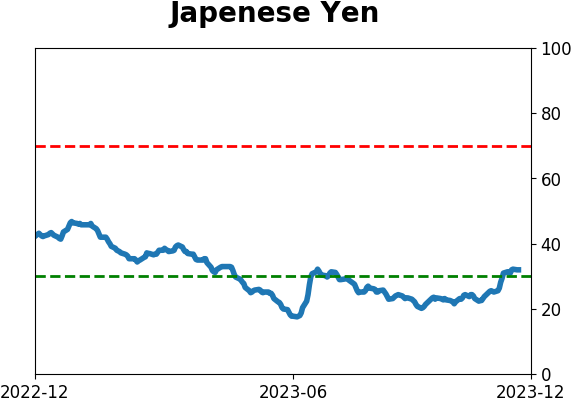
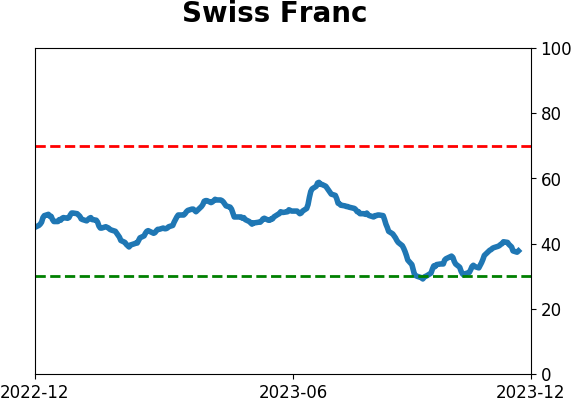
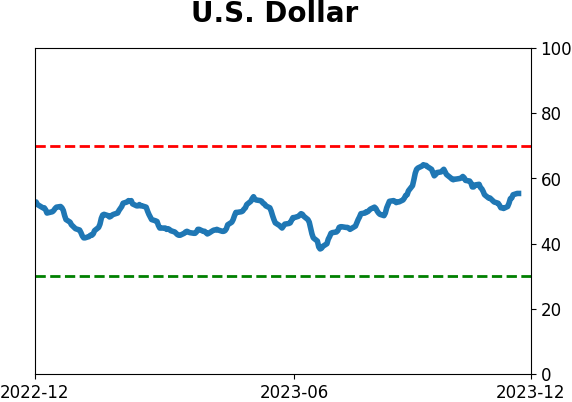
Currency ETF's - 5-Day Moving Average
|
|
|
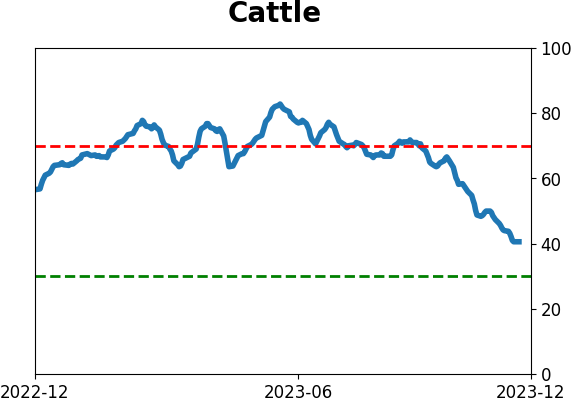
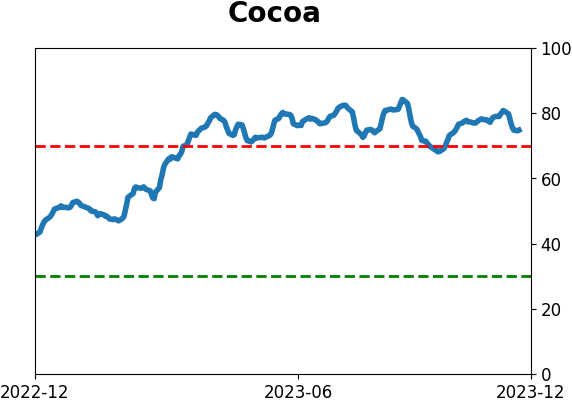
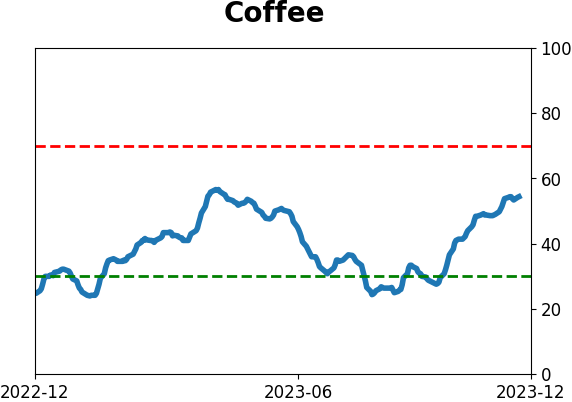
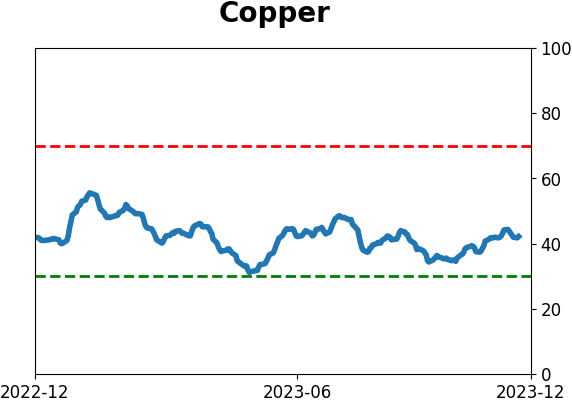
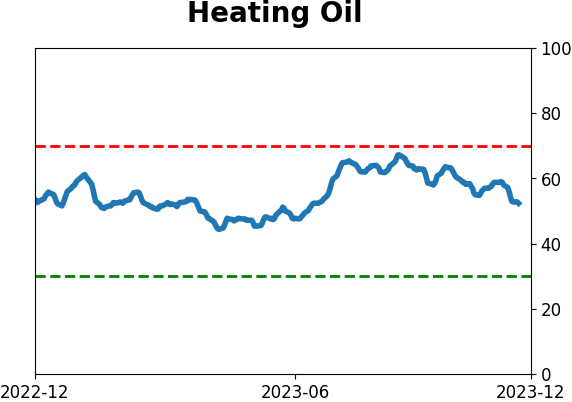
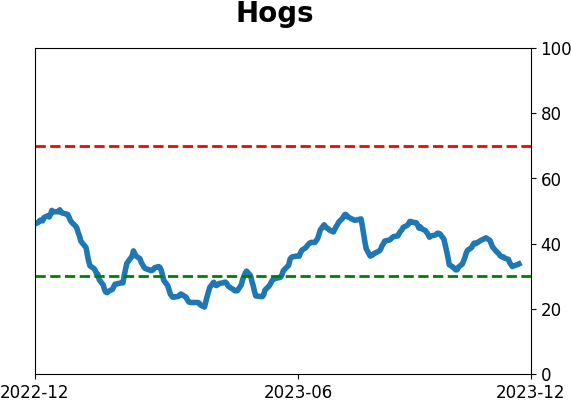
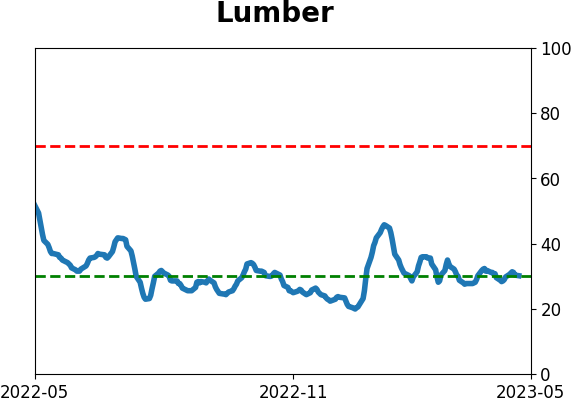
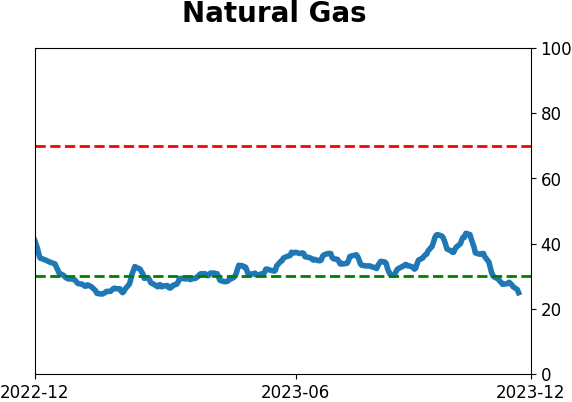
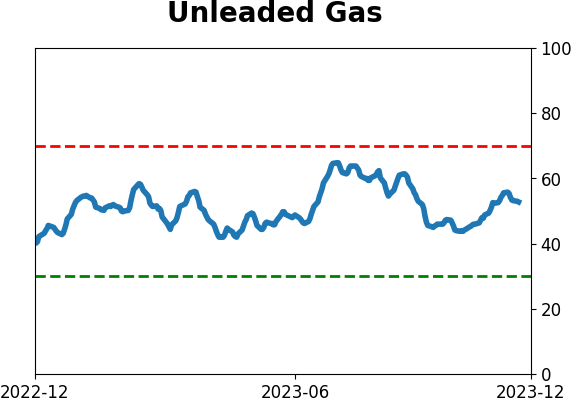
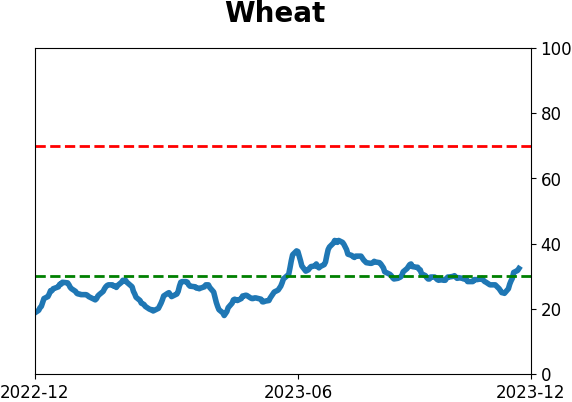
Commodity ETF's - 5-Day Moving Average
|
|