Headlines
|
|
Large options traders again place record bets on a crash:
Last week the largest options traders in the market spent a massive $19 billion on put options to protect against a market crash. That far outweighed the money the spent on upside call options. This hedging activity is among the most aggressive the market has ever seen.
|
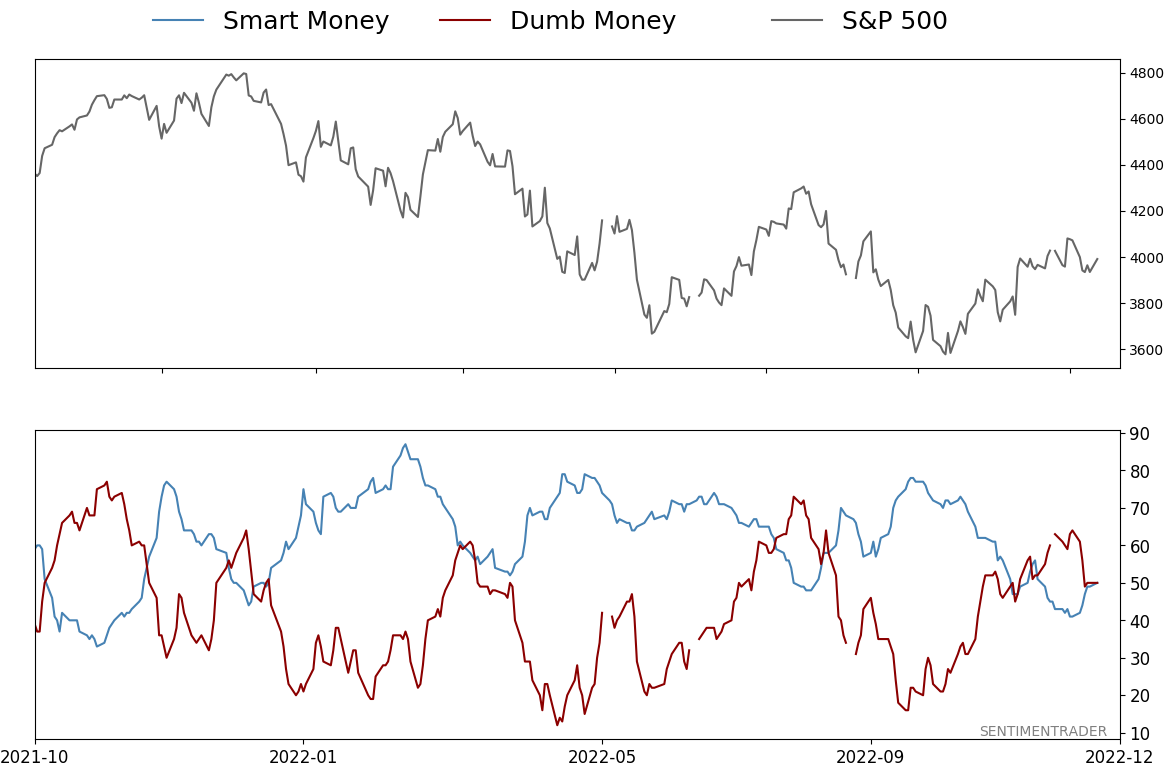
Smart / Dumb Money Confidence
|
Smart Money Confidence: 50%
Dumb Money Confidence: 50%
|
|
Risk Levels
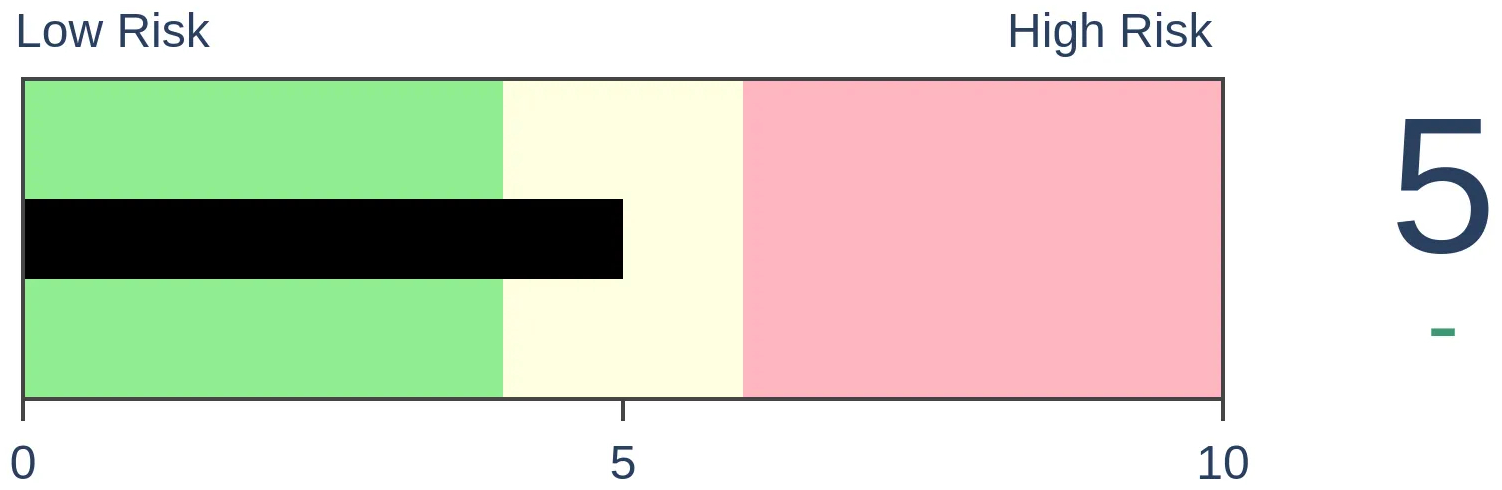
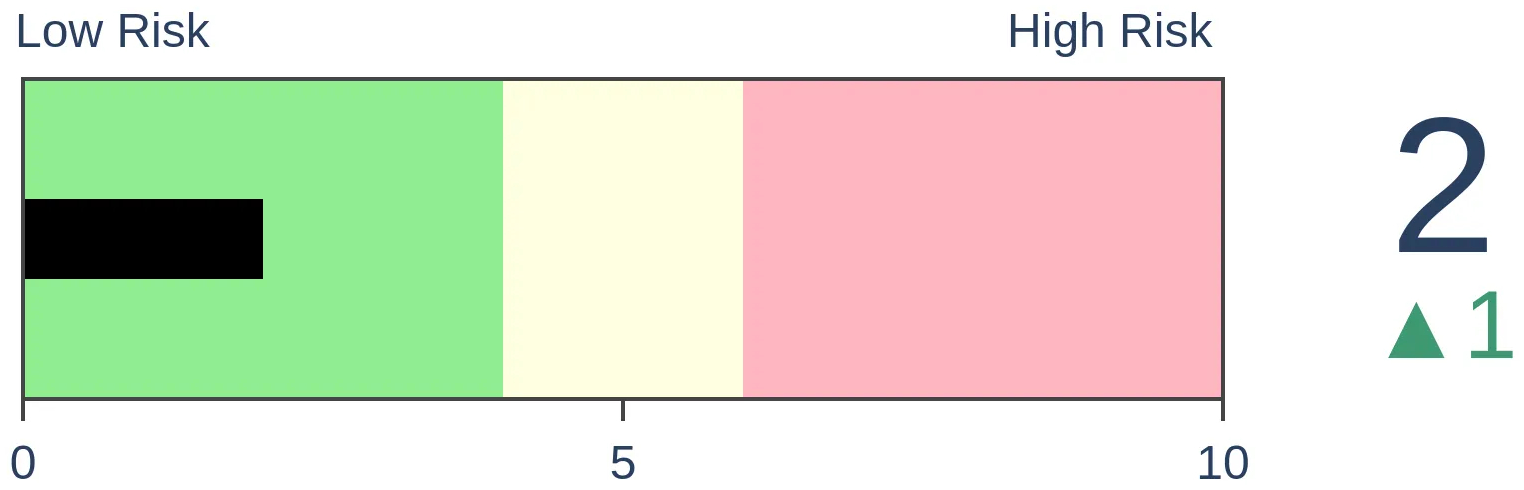
Stocks Short-Term
|
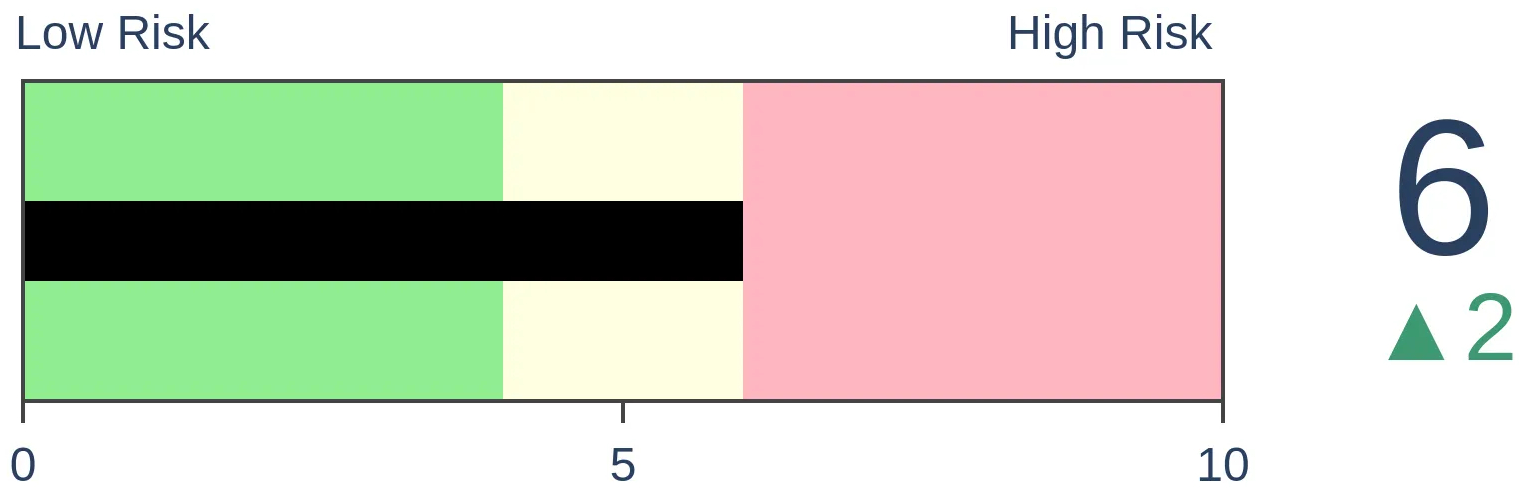
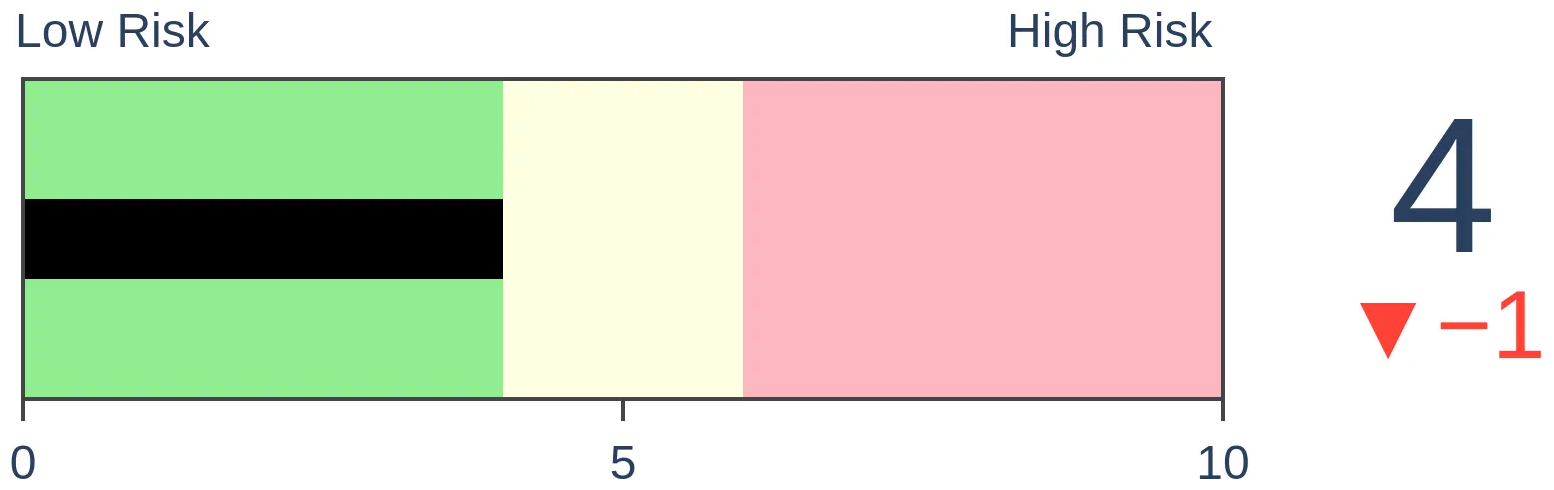
Stocks Medium-Term
|
|
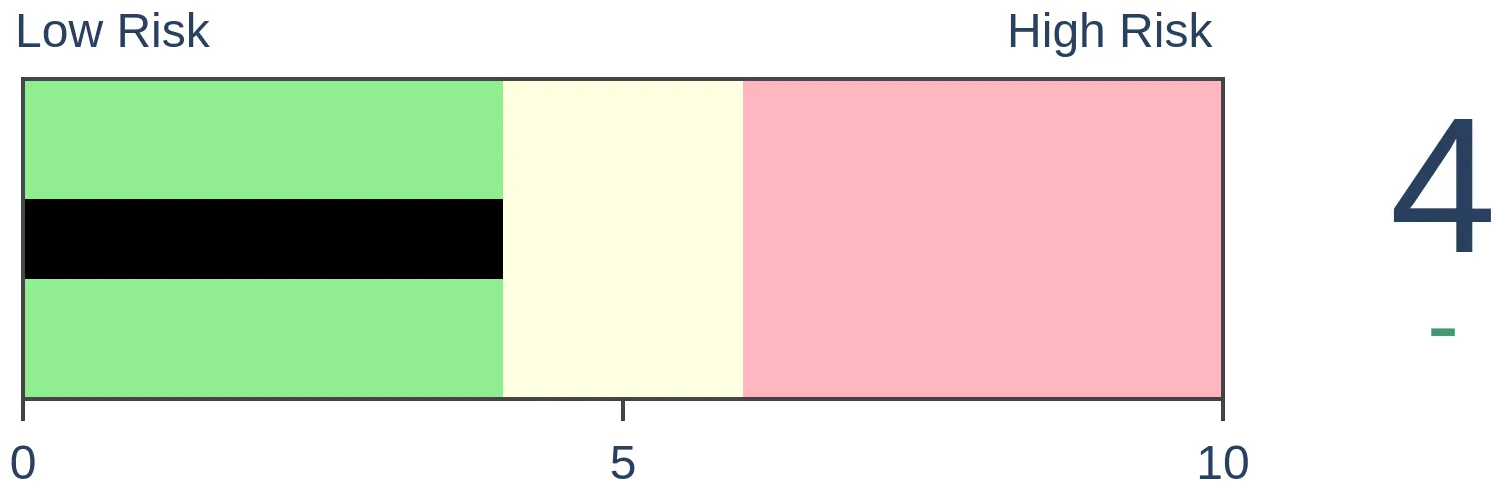
Bonds

|
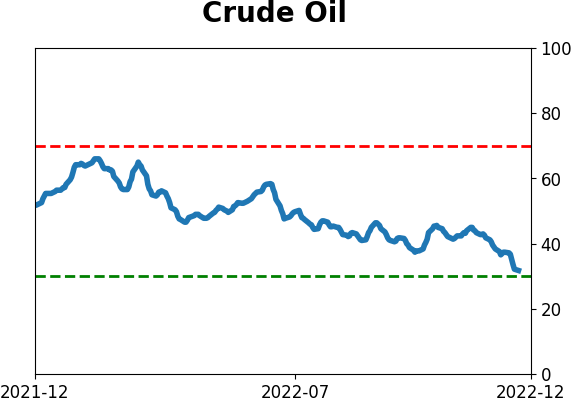
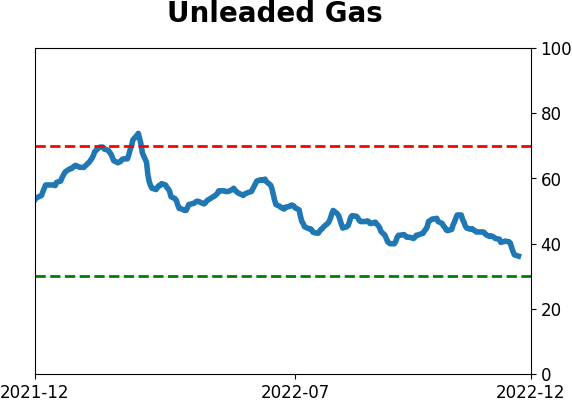
Crude Oil
|
|
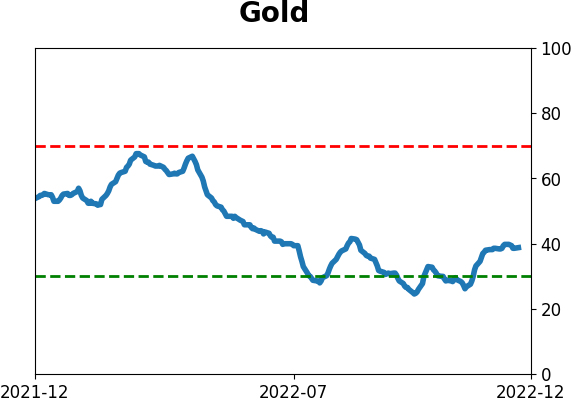
Gold
|
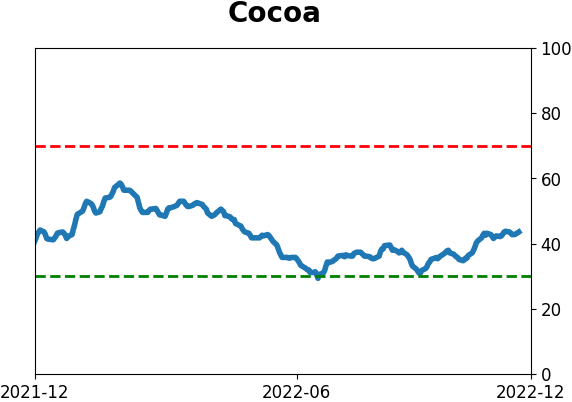
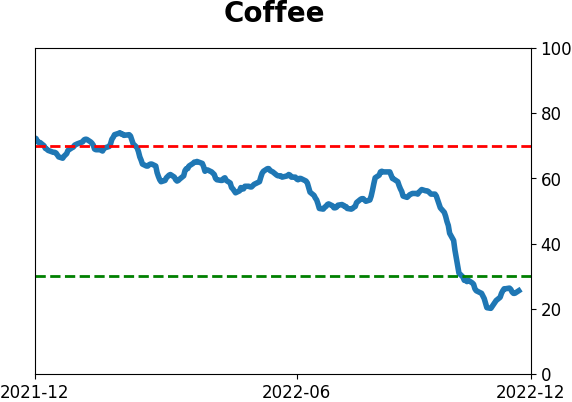
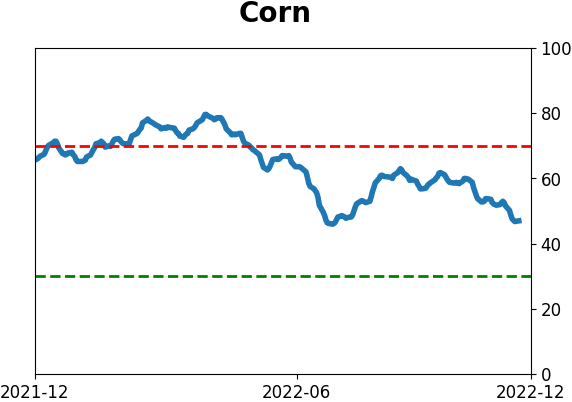
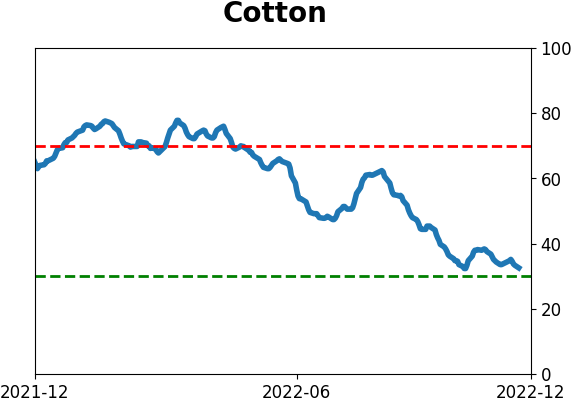
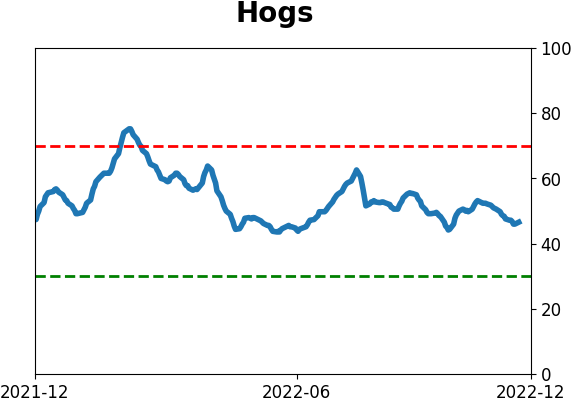
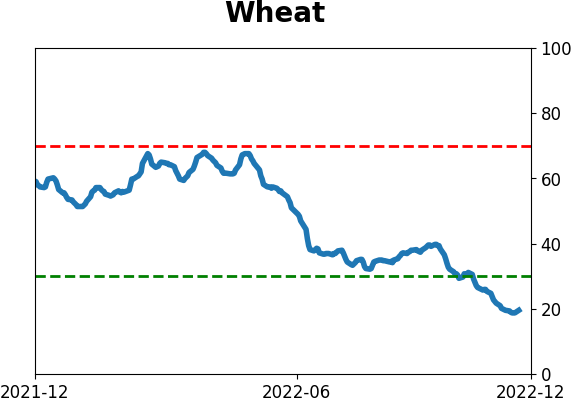
Agriculture
|
|
Research
By Jason Goepfert
BOTTOM LINE
Last week the largest options traders in the market spent a massive $19 billion on put options to protect against a market crash. That far outweighed the money the spent on upside call options. This hedging activity is among the most aggressive the market has ever seen.
FORECAST / TIMEFRAME
None
|
Key points:
- Large options traders have once again been paying up for protection against a crash
- Last week, they spent more than $19 billion on opening put purchases, the 2nd-highest amount ever
- As a percentage of market cap, we've never really seen hedging activity this aggressive
Institutions are hedging heavily again
Two months ago, we looked at the historic surge in institutional traders' options bets against stocks. We'd never seen anything like it other than during the financial crisis, and the data has a consistent tendency to be a contrary indicator. It was a bullish sign for stocks.
In conversations with clients, and especially with financial media journalists, I was repeatedly told that it was wrong. First, that the data points were incorrect. After triple-checking, providing the source, and confirming it, then I was told it was misleading. That it was due to a lone institution placing a large, sophisticated trade on a single stock. After pointing out that that wasn't influencing the data because it wasn't part of the data set, then I was told it didn't matter because contacts at large investment banks "who should know" said they didn't believe it.
The S&P 500 rallied more than 13% since that point. I've learned one thing over and over and over (and over and over and over...) again over the past 20 years: people believe what they want to believe, and there's no point in trying to convince them otherwise.
This is all a lead-up to what will assuredly generate similar skepticism from two months ago. Institutional traders are once again placing near-record bets against stocks.
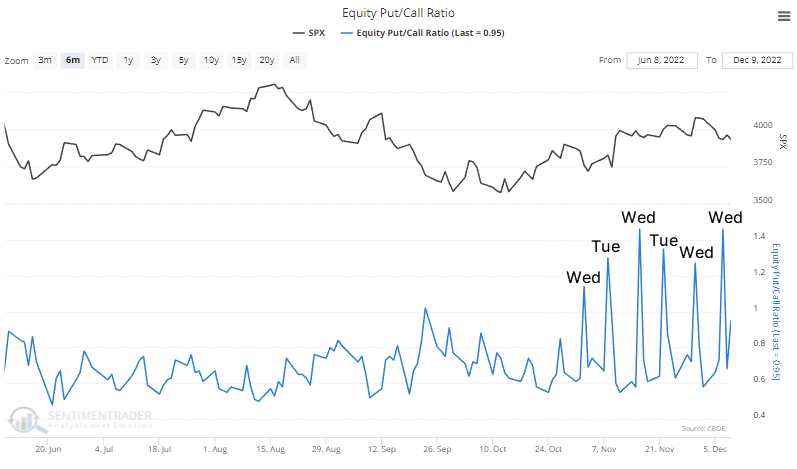
Something weird is definitely happening. Over the past six weeks, there has been a sudden one-day spike in the Equity Put/Call Ratio, and it has either happened on a Tuesday or Wednesday. It is almost certainly related to the surge in same-day or near-day option expirations.
While we never like to make excuses for indicators, this is so odd, it has never happened in nearly 30 years of history. That makes it tough to glean any conclusions. The trouble with this ratio is we don't know what kind of transactions are driving the spikes in the ratio - it could be opening or closing transactions, and it could be buying or selling activity. We just don't know.
That's why looking at the weekly report of options activity across all U.S. exchanges can be so helpful. It weeds out the weird stuff and allows us to narrow down who is doing what. And last week, the largest traders in the market bought to open the fewest equity call options relative to put options since 2009.
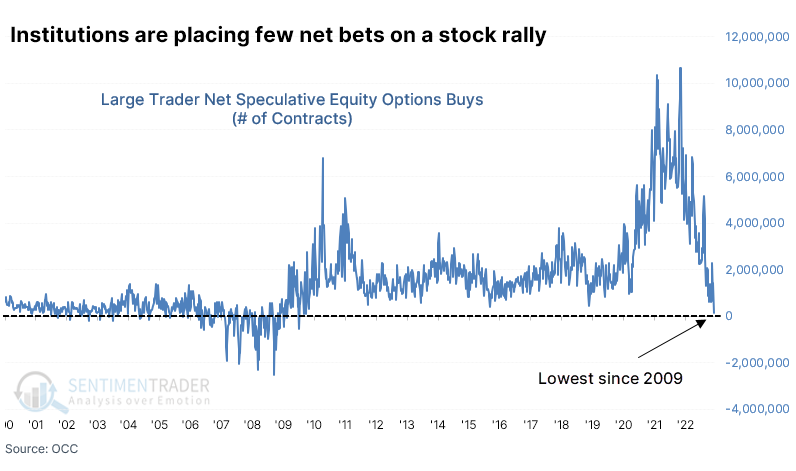
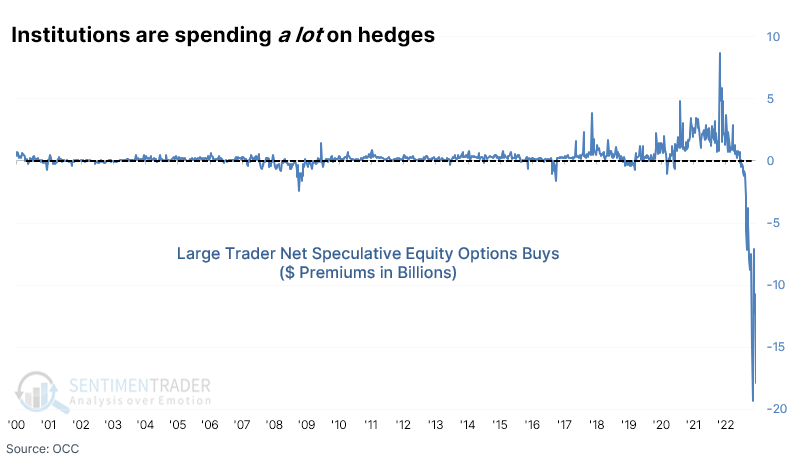
More importantly, they're paying up for the right to buy those puts as hedges against a decline. Large traders bought to open $1.1 billion worth of call options but a massive $19.0 billion of put options for a net speculative volume of -$17.8 billion.
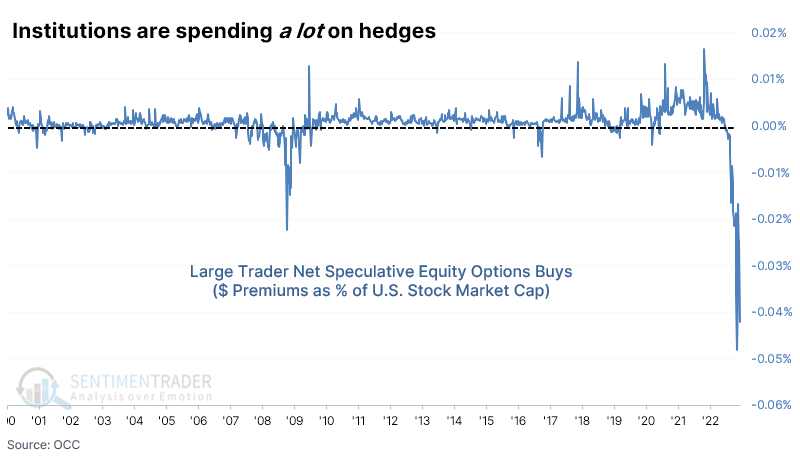
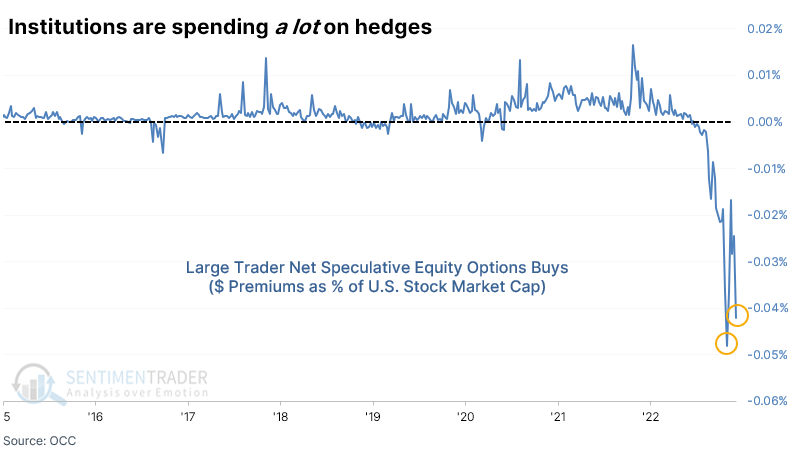
Of course, the equity market's value has grown over the decades. As a percentage of total market capitalization, last week's put bonanza isn't all the much, but that ignores the knock-on effects of downstream hedging activity from dealers. And it's still among the largest net speculative bets against stocks in history.
It was second only to the put buying in the couple of months prior.
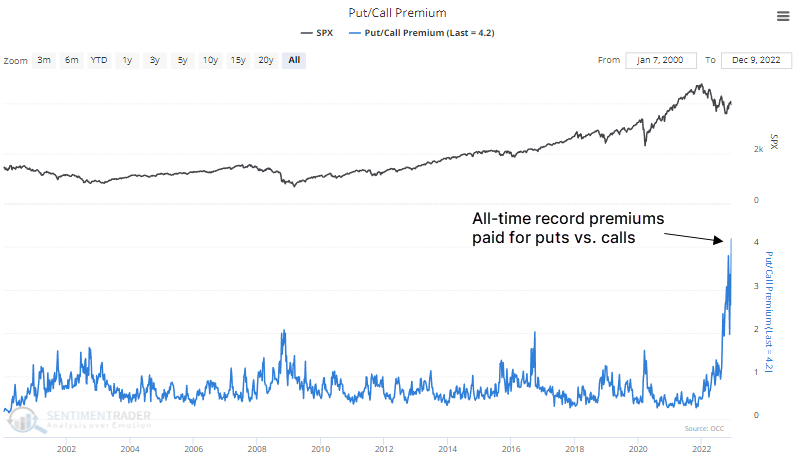
If we look at the total amount of premiums spent on puts divided by the amount spent on calls among all traders across all U.S. exchanges, we've just reached a new record. Last week, there was $4.20 spent on puts for every $1 spent on calls among equities and ETFs. This excludes closing and selling-to-open transactions, so it's a pretty pure reflection of traders' immediate thoughts on the direction of the stock market.
What the research tells us...
We don't like weird. When an indicator starts doing something it has never done, it's time to put less weight on it as a predictor. Sometimes, market dynamics or structure changes, and indicators lose their effectiveness. Maybe that's what's happening right now in the options market - it's almost certainly the case with the popular version of the daily put/call ratio.
When we dig further into the data, though, there doesn't seem to be any particular thing skewing it enough to consider it invalid. And maybe big institutions paying so much for protection right now have the right idea. All we know is that when they have behaved like this in the past, stocks may have dipped short-term, but they rose over the medium- to long-term every time.
Indicators at Extremes
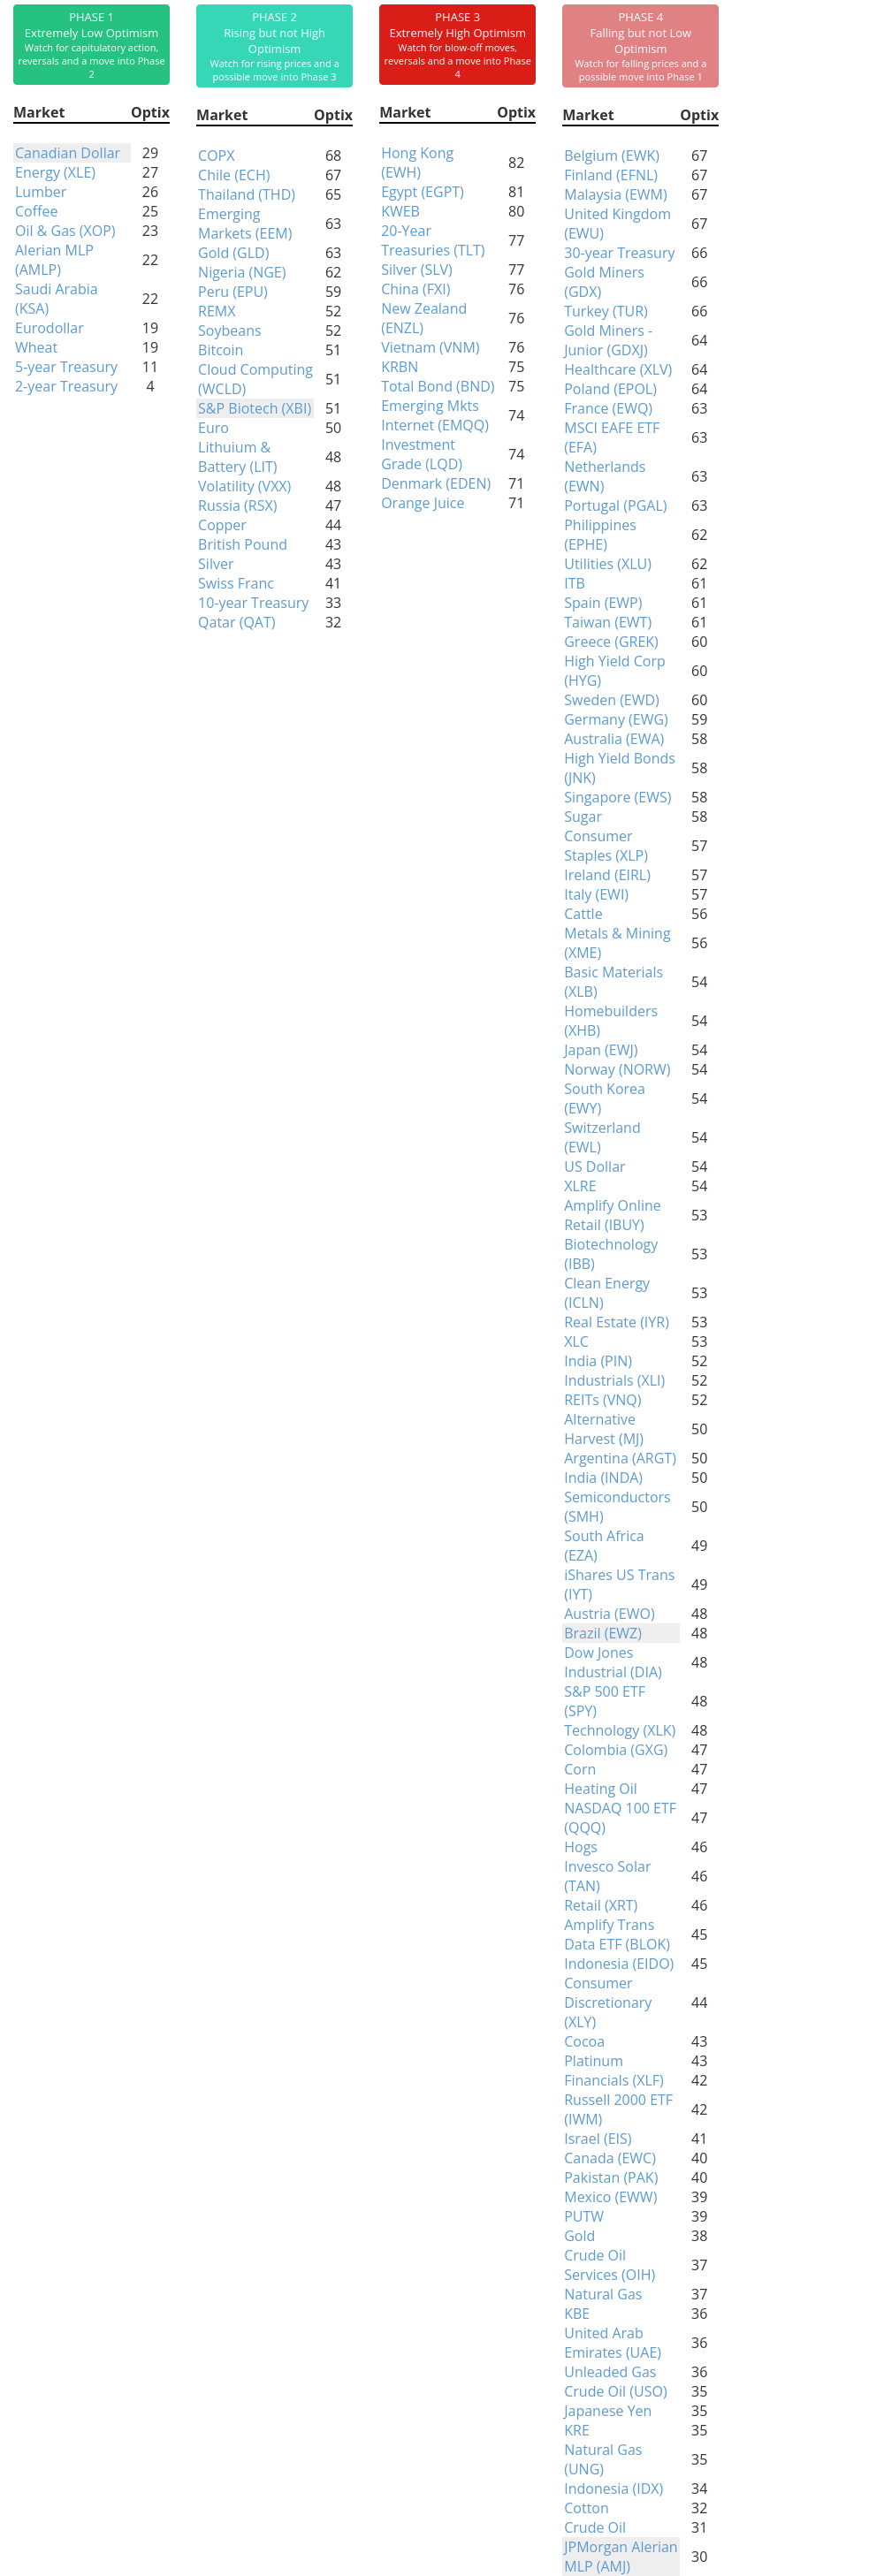
Phase Table
Ranks
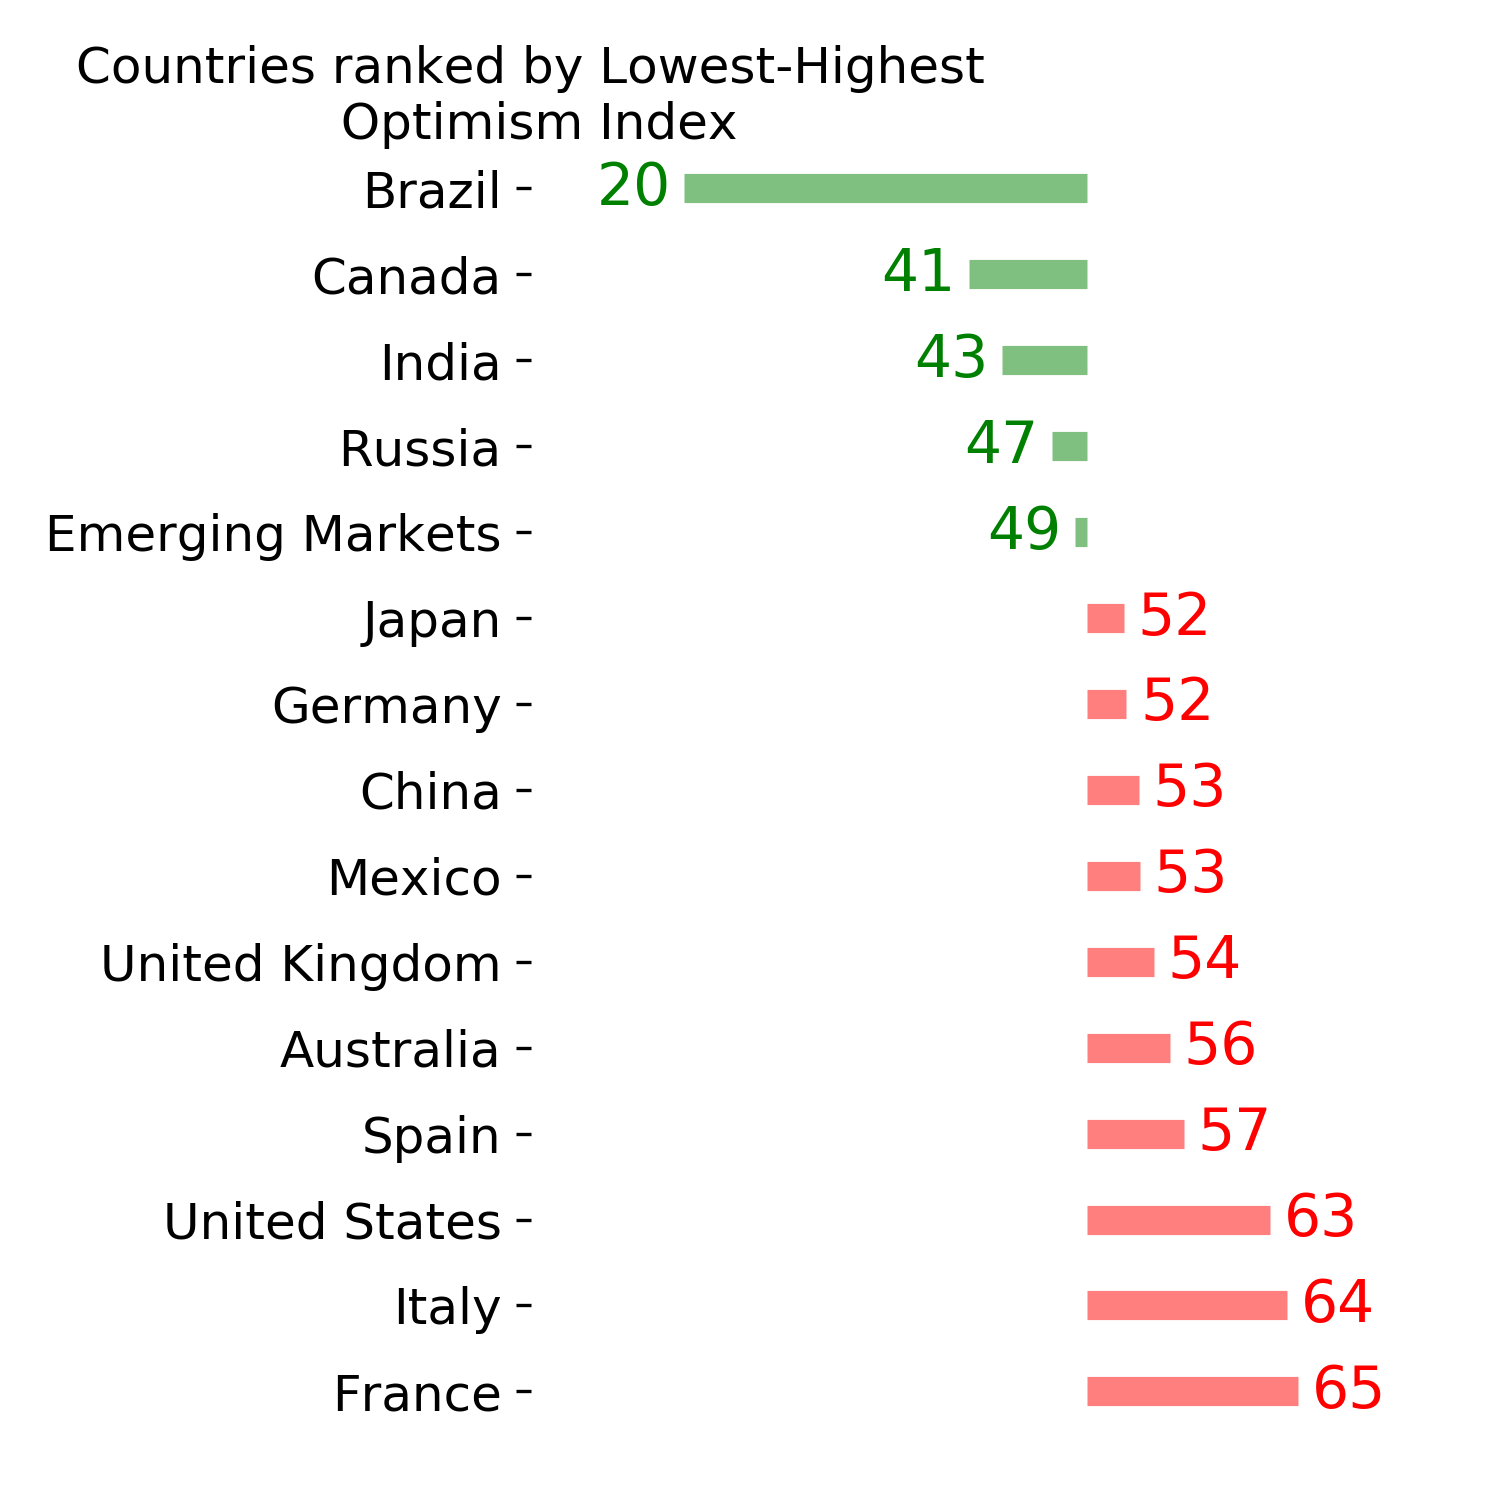
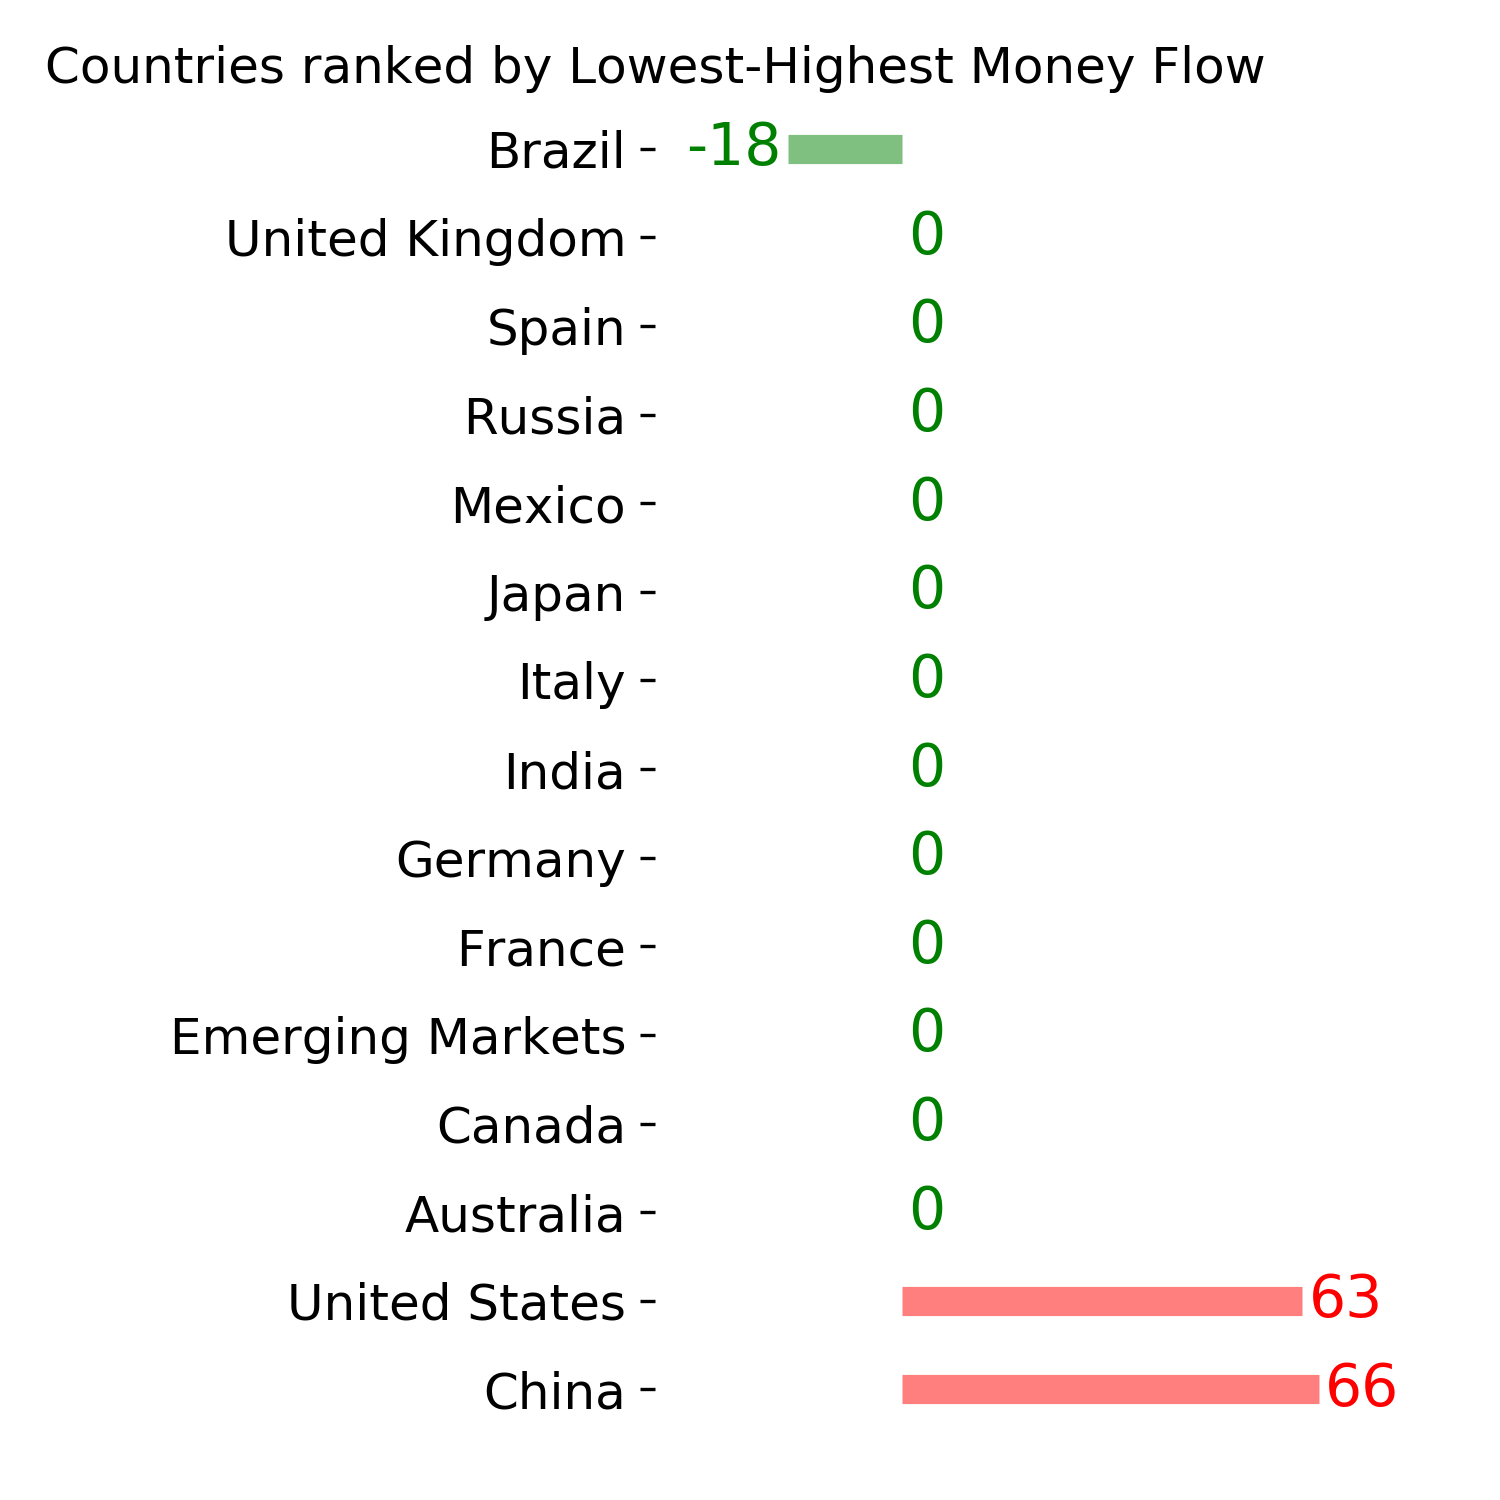
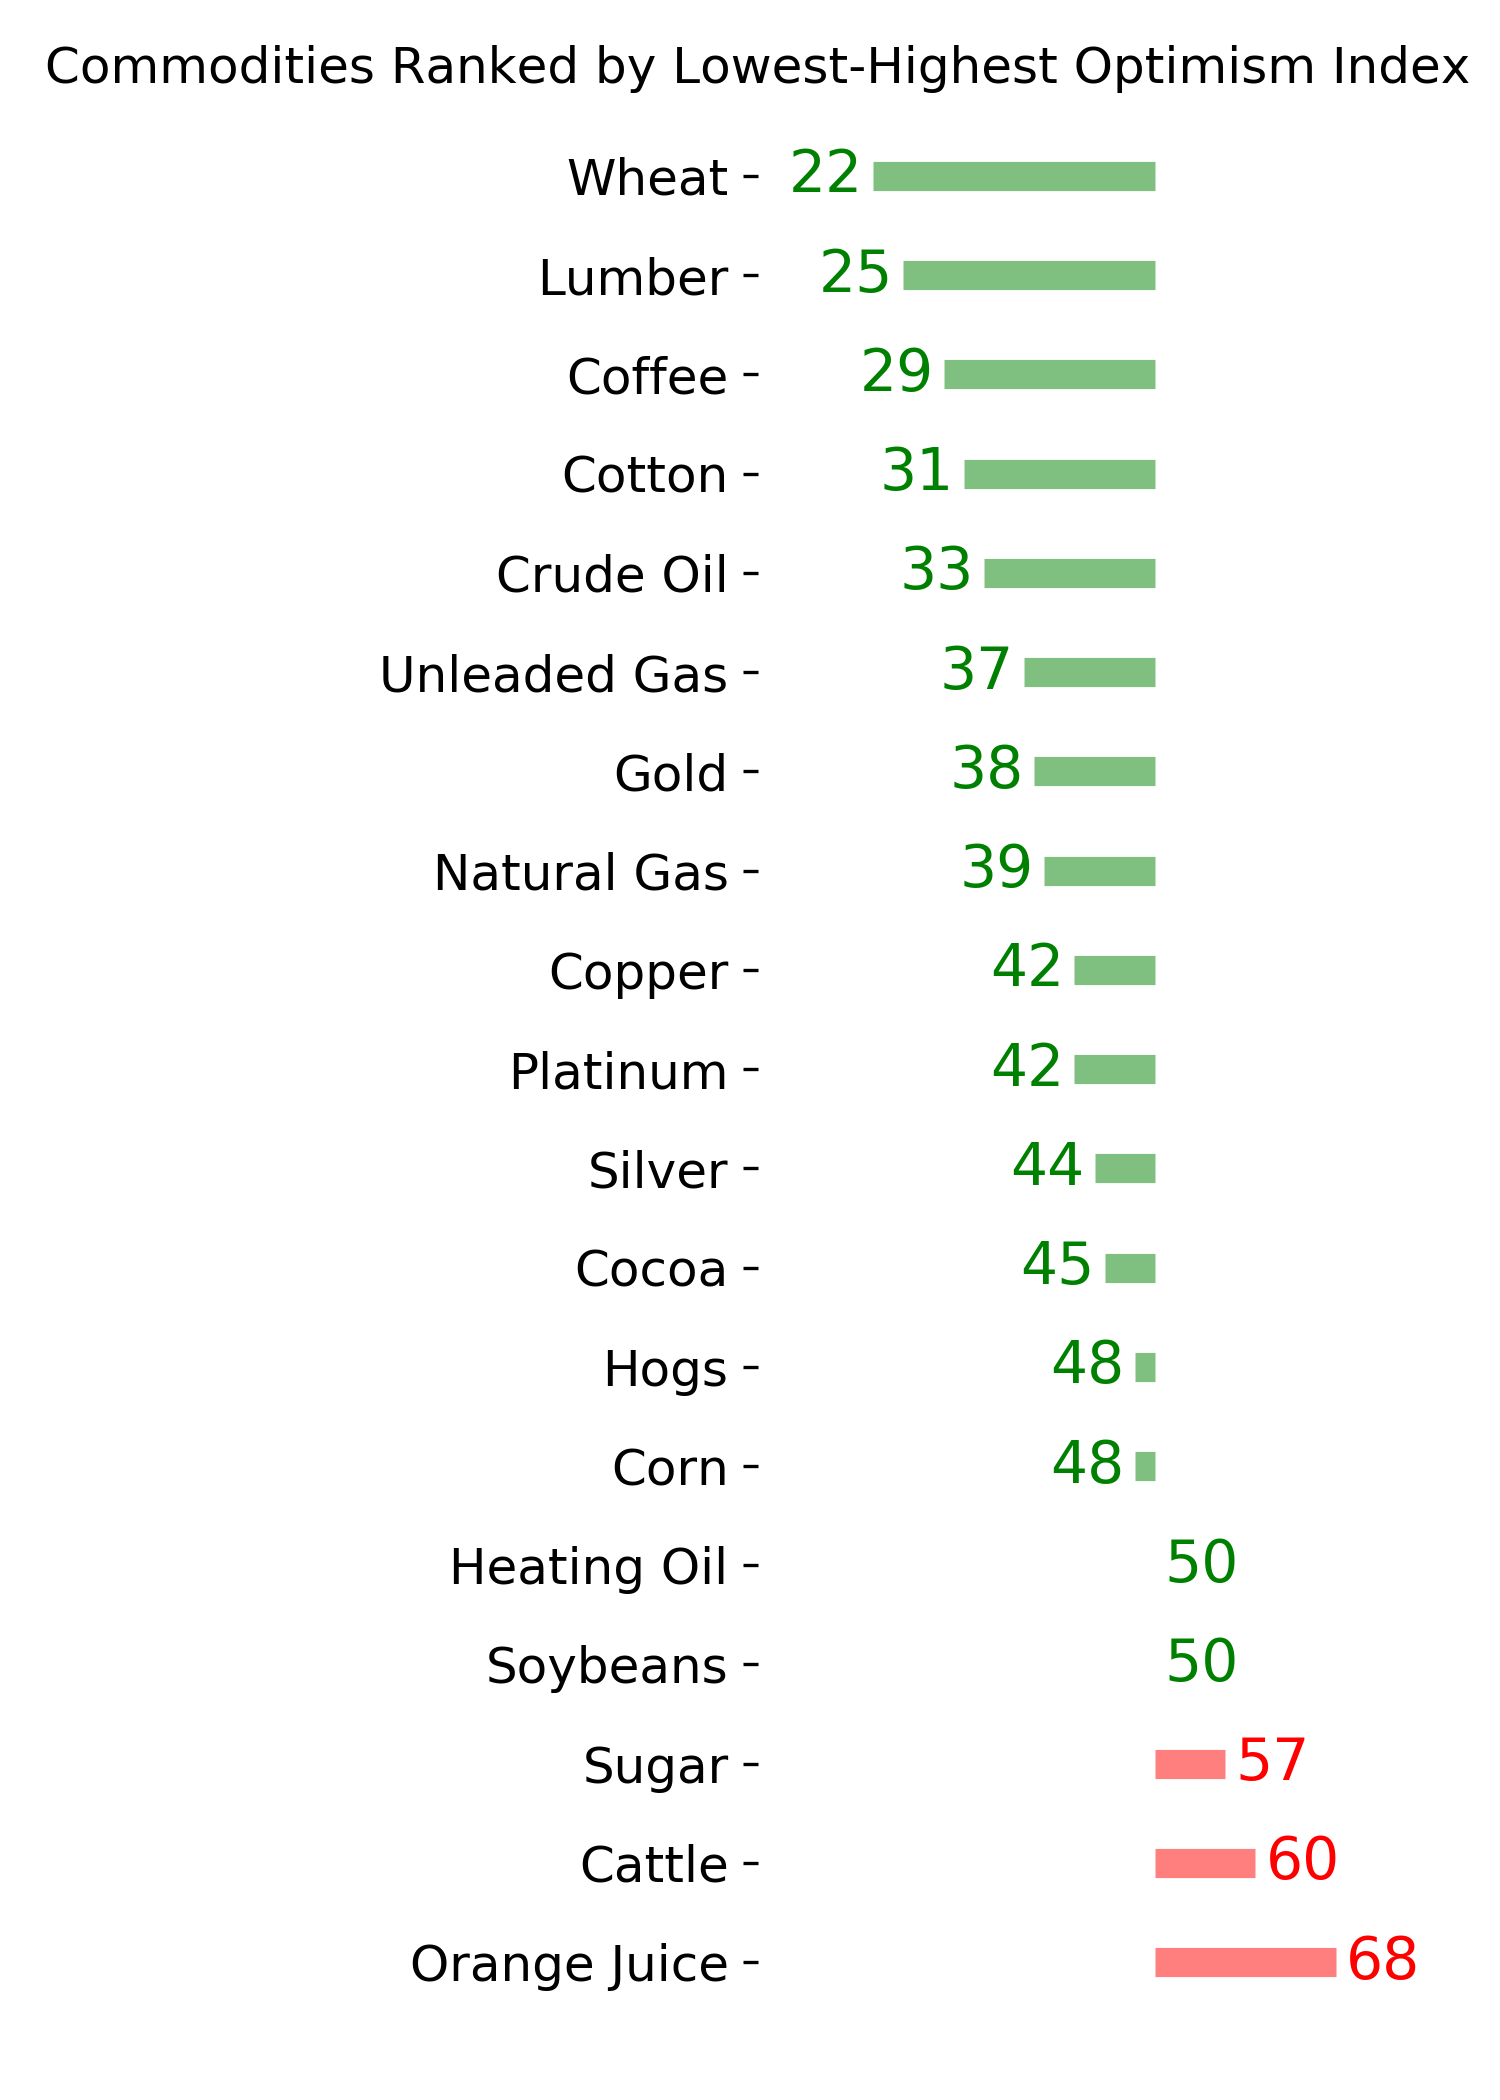
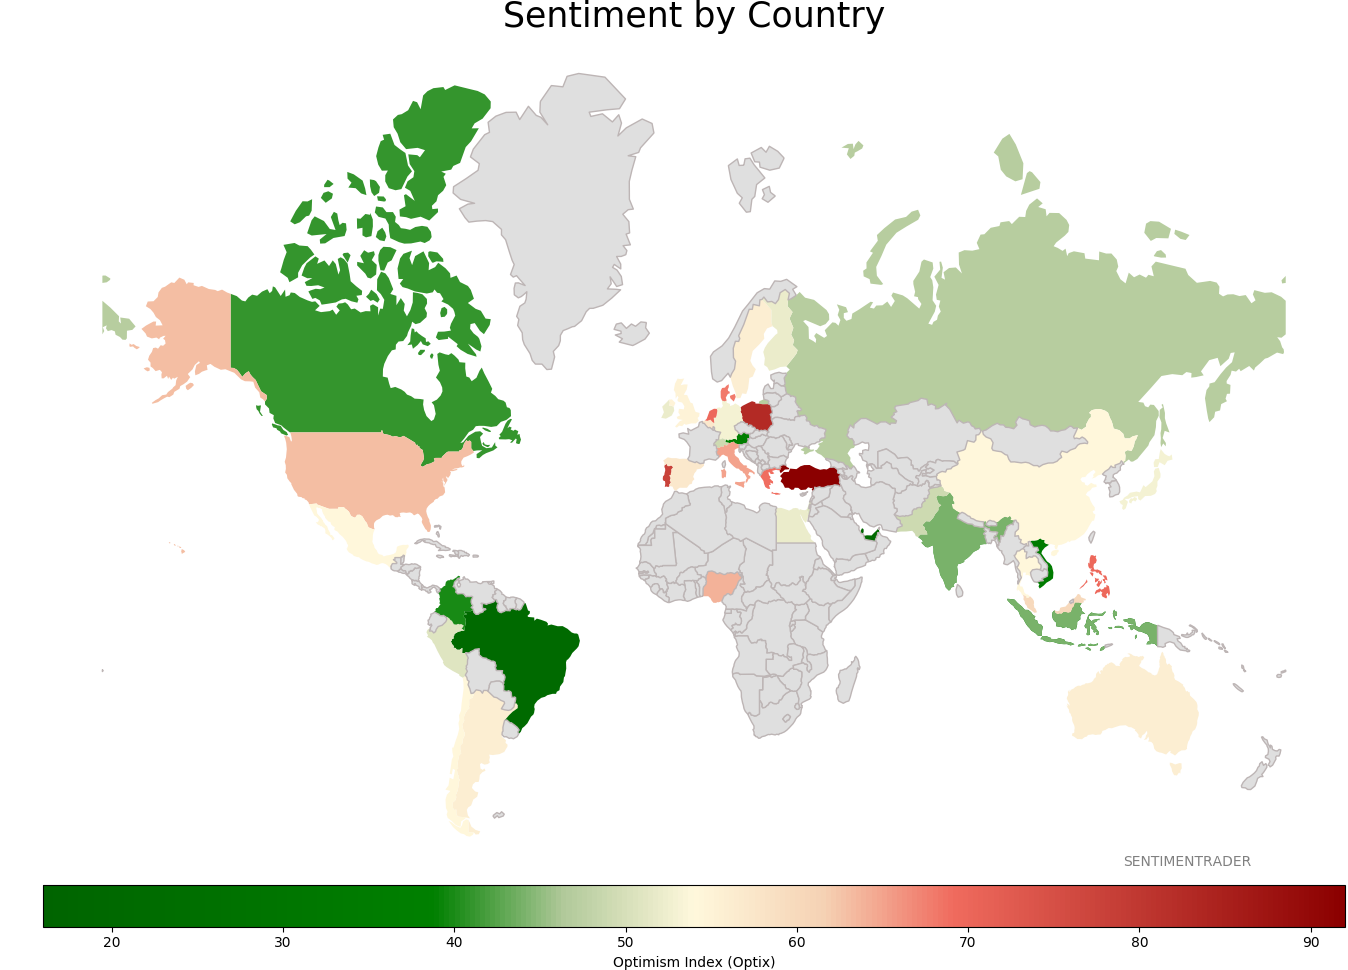
Sentiment Around The World
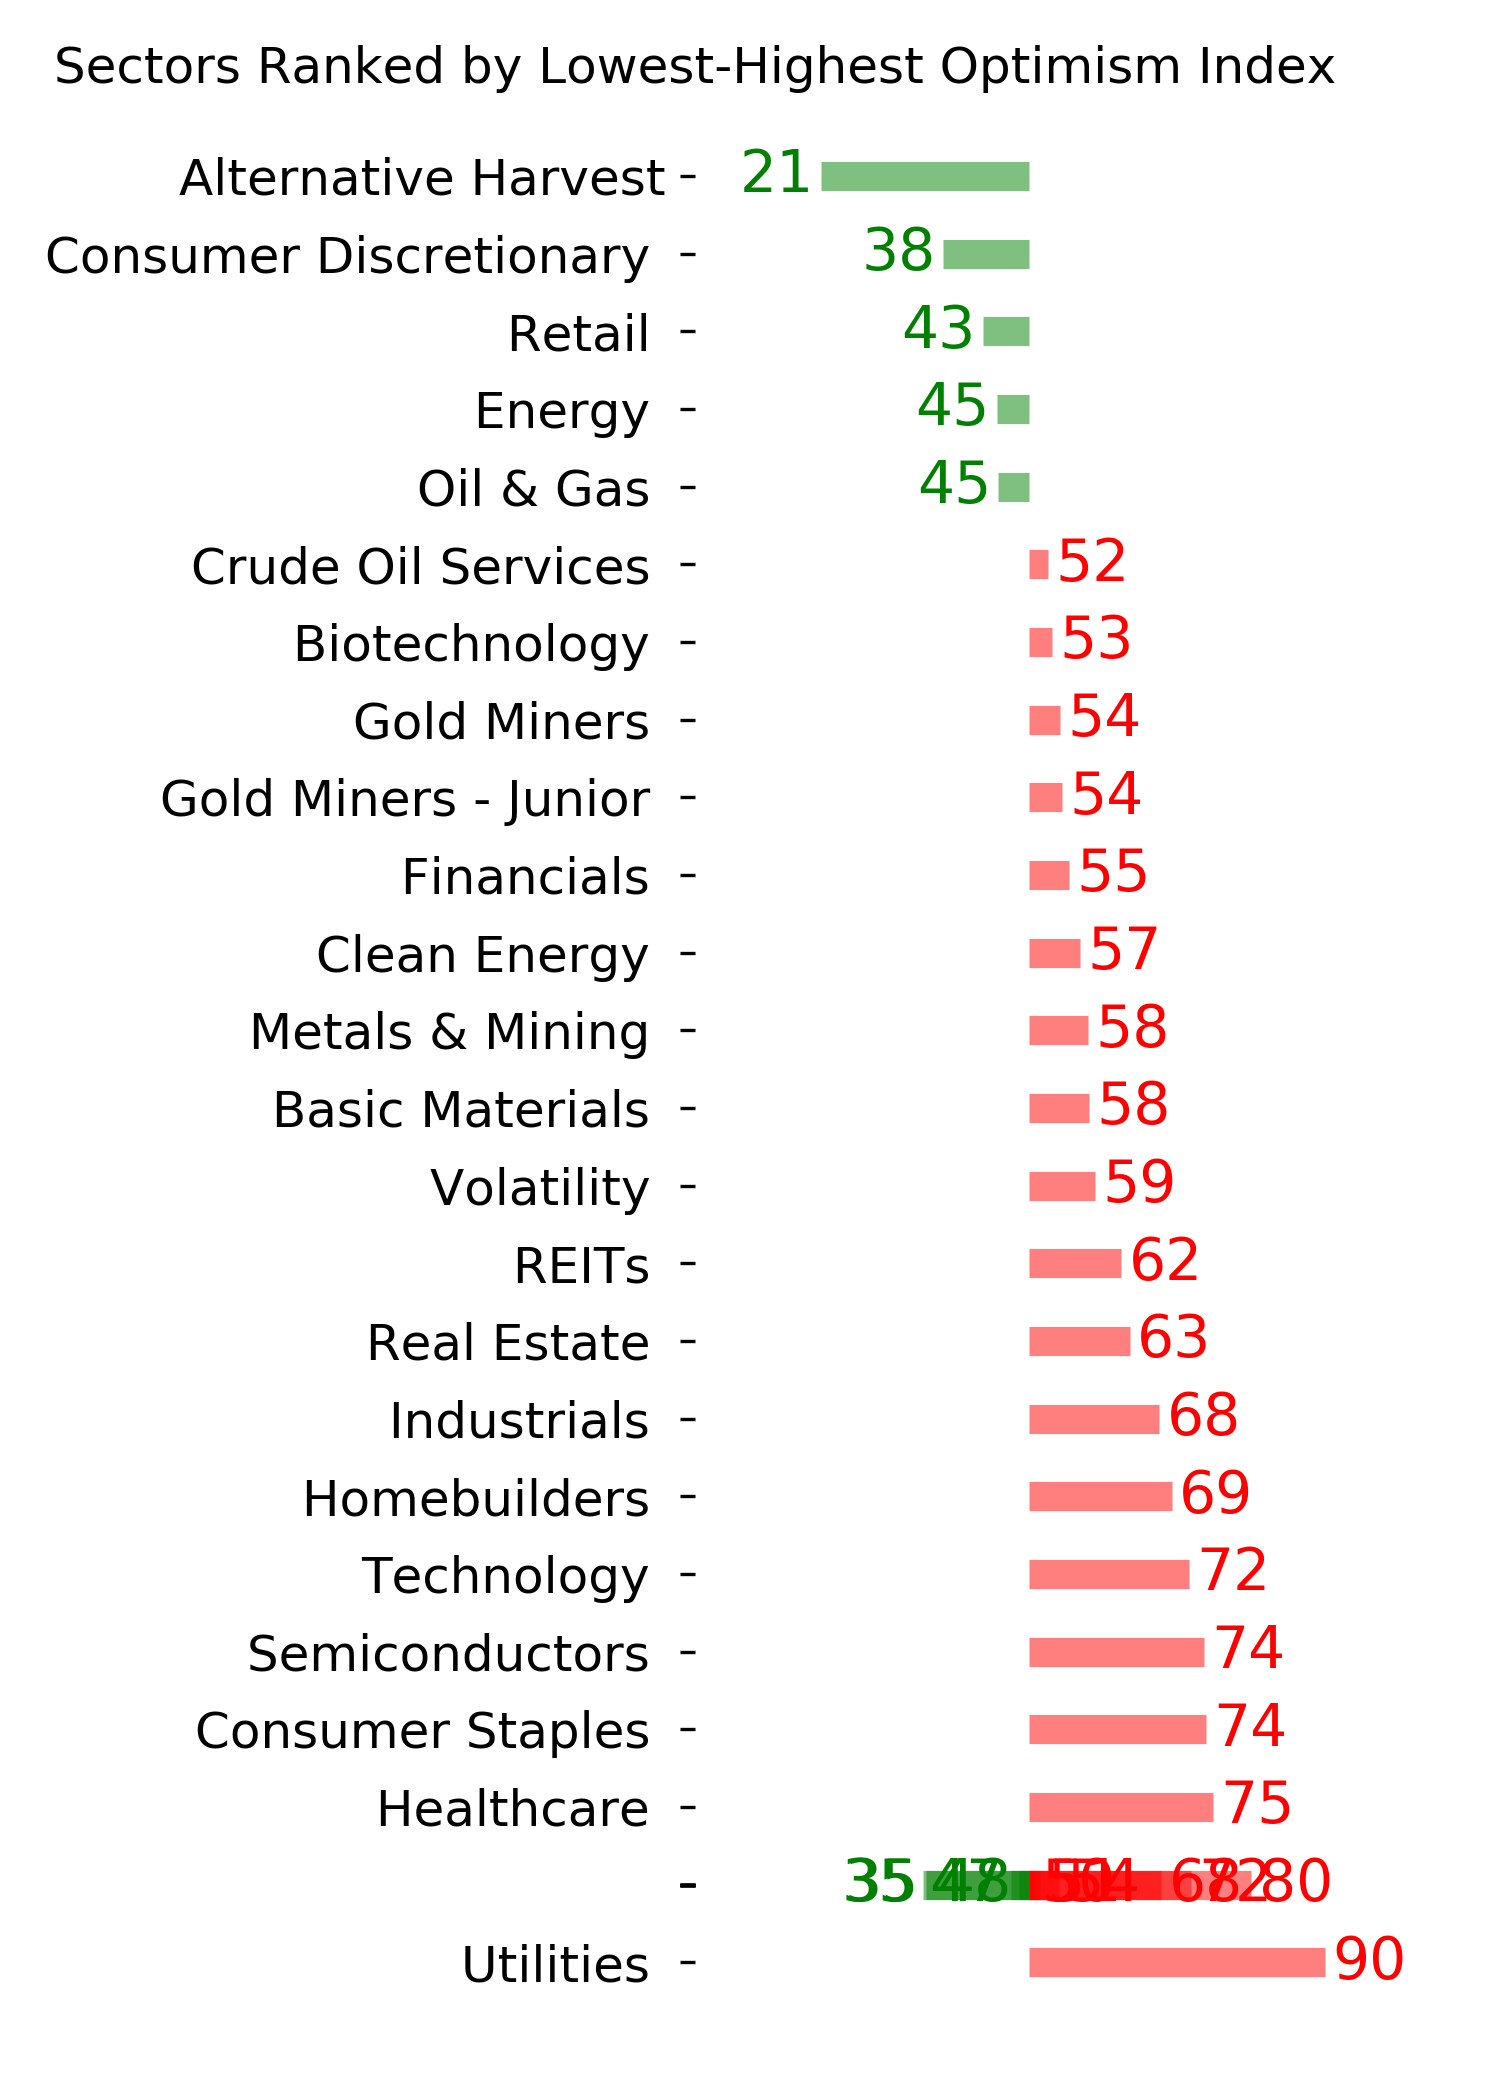
Optimism Index Thumbnails
|
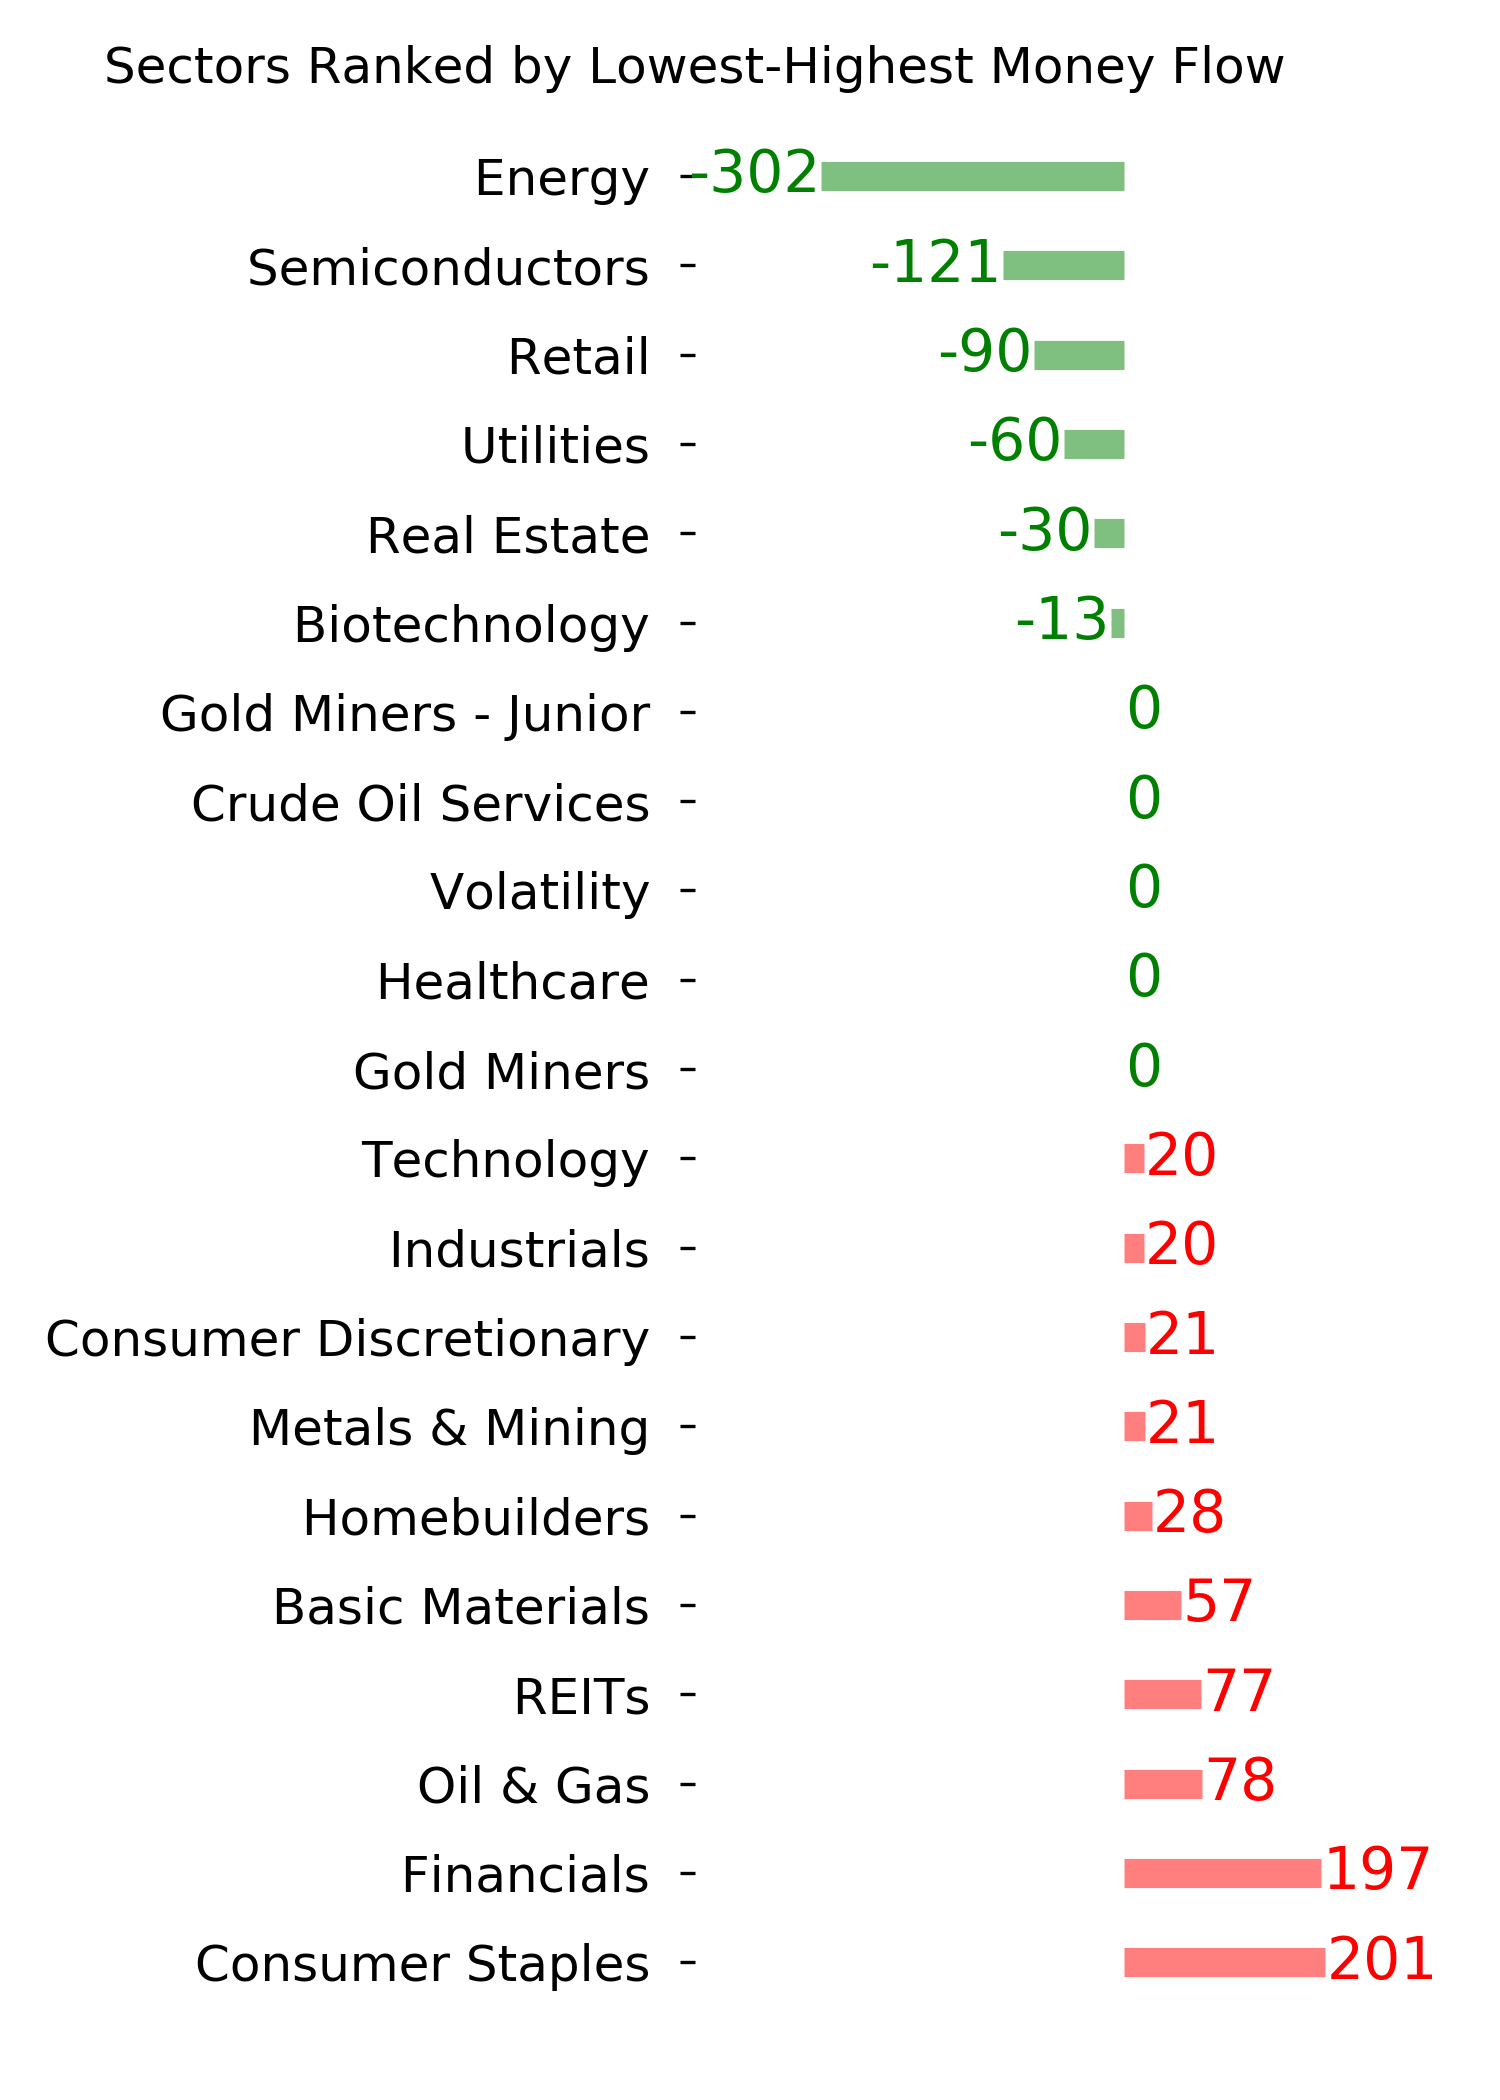
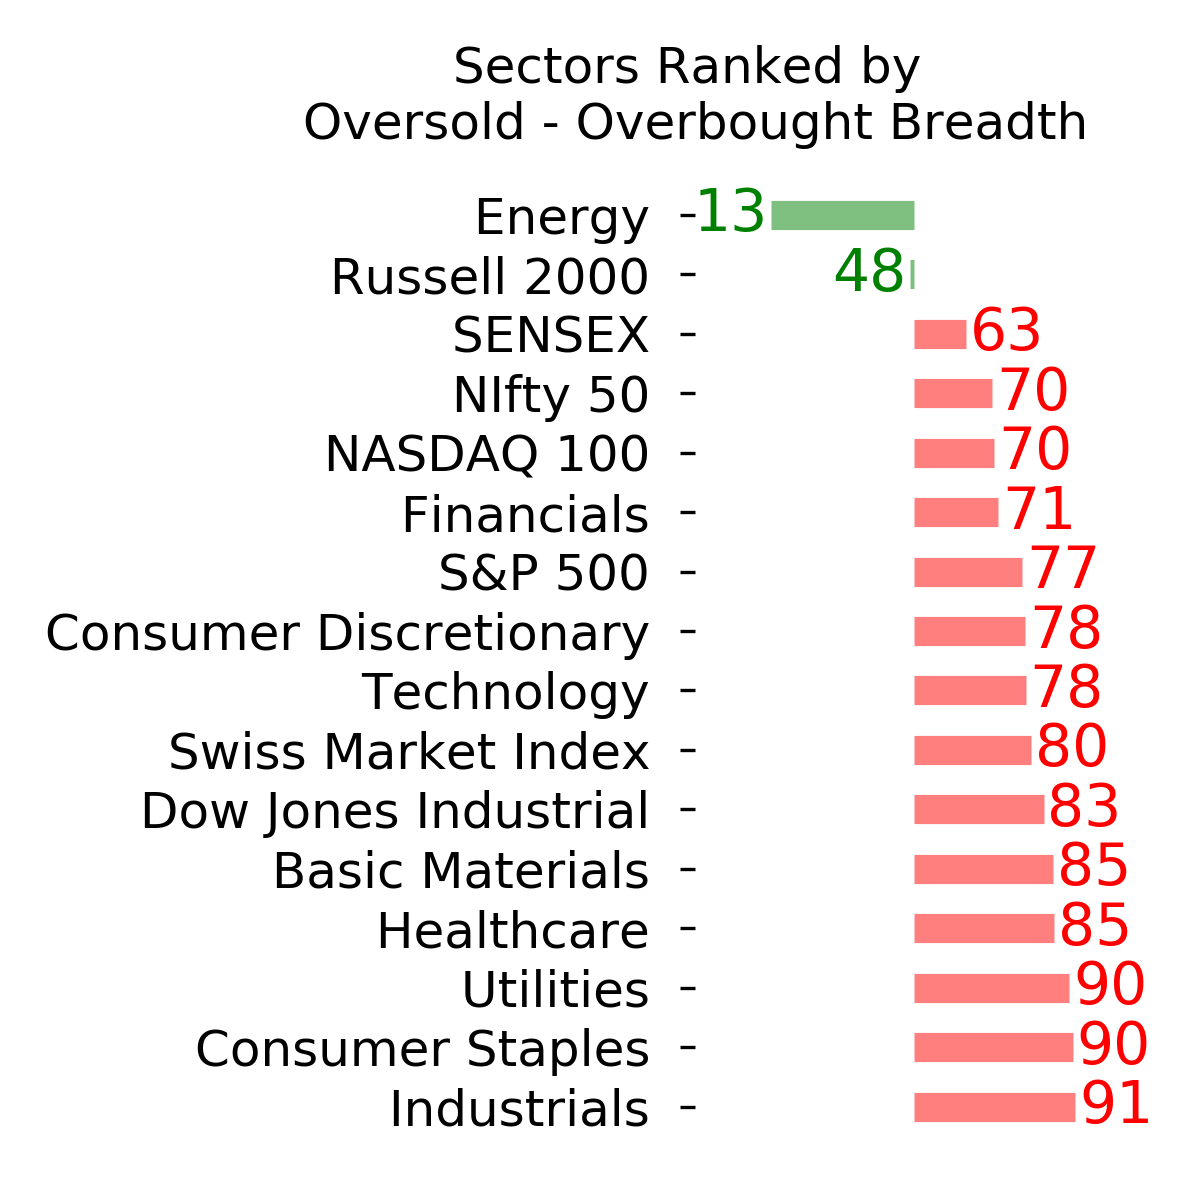
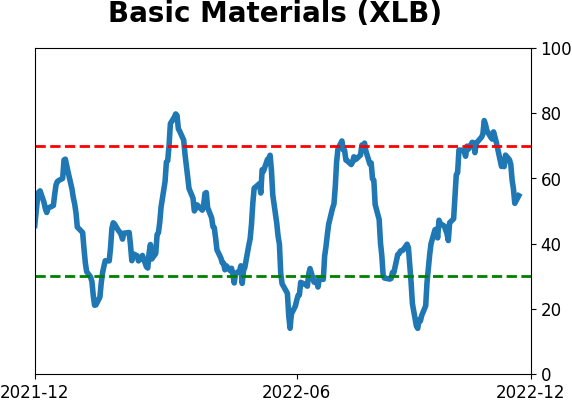
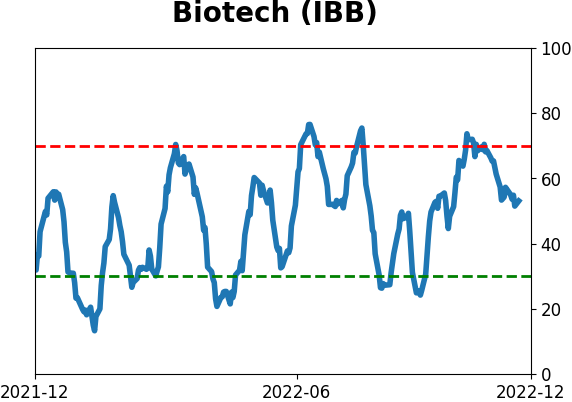
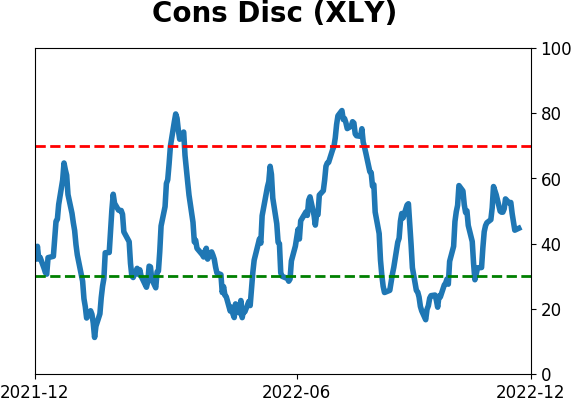
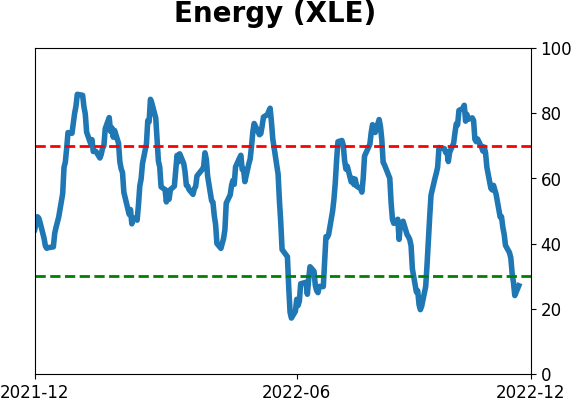
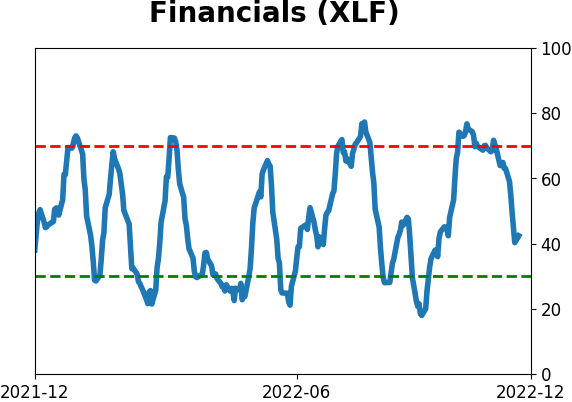
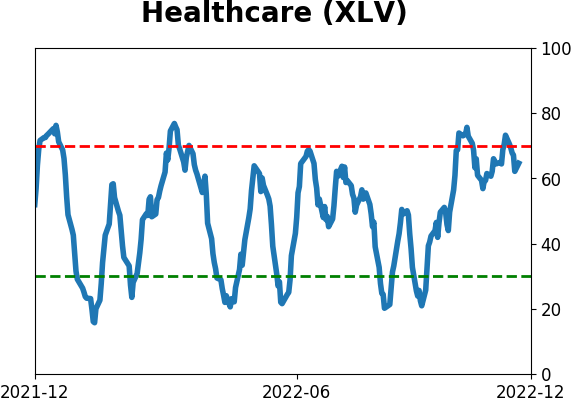
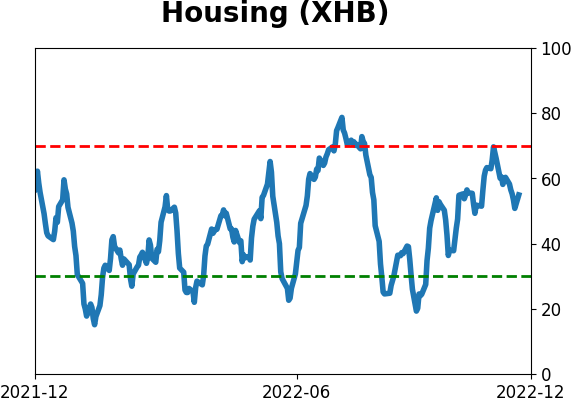
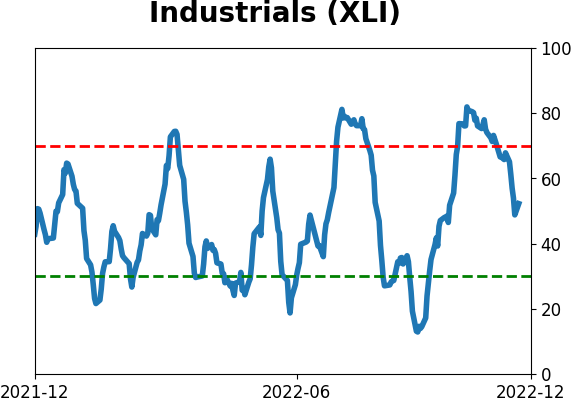
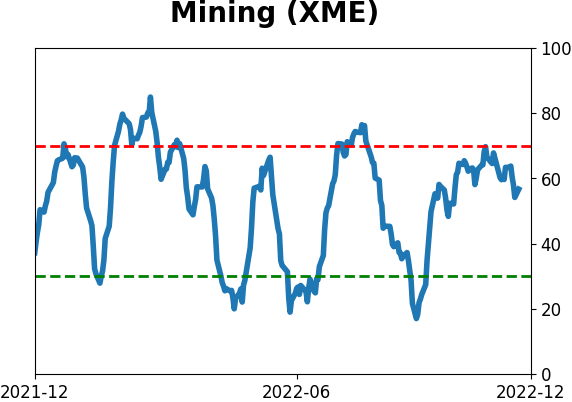
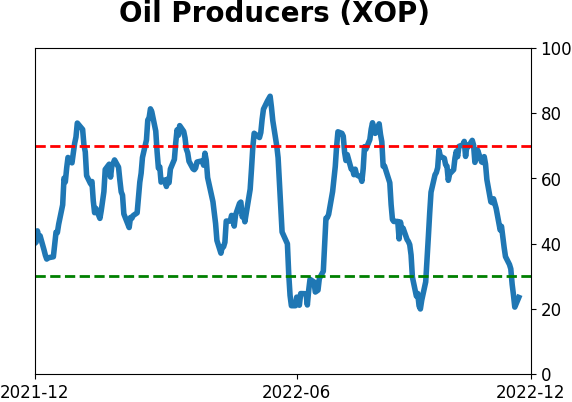
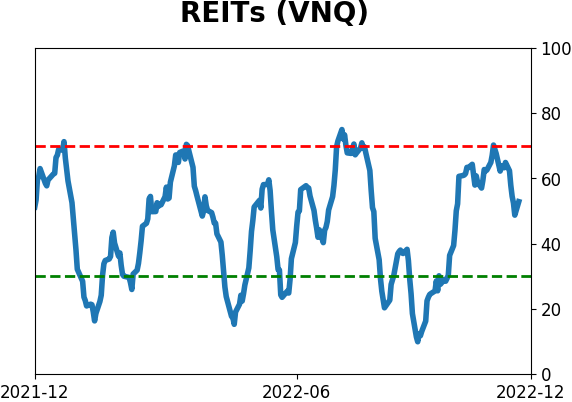
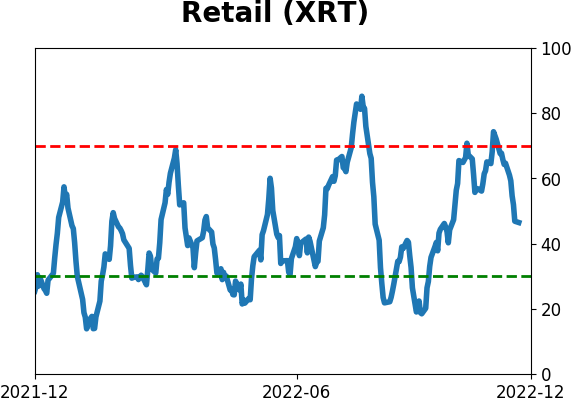
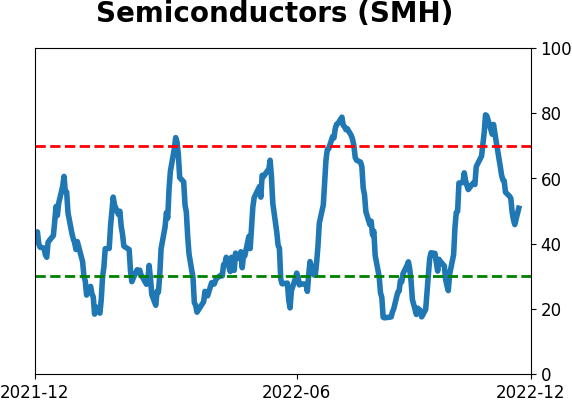
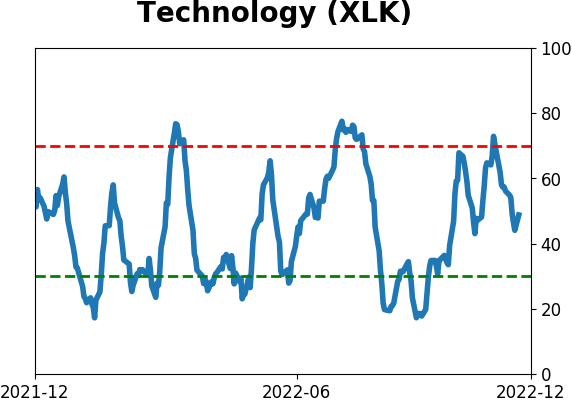
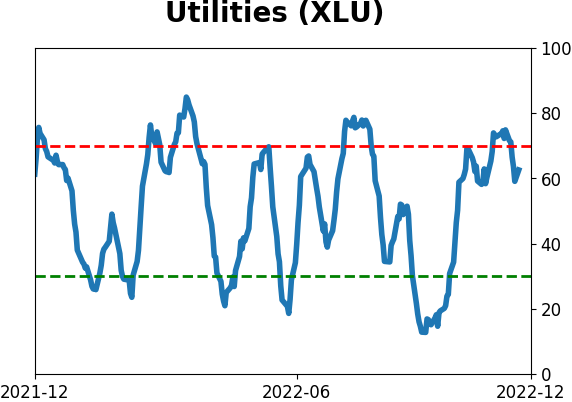
Sector ETF's - 10-Day Moving Average
|
|
|
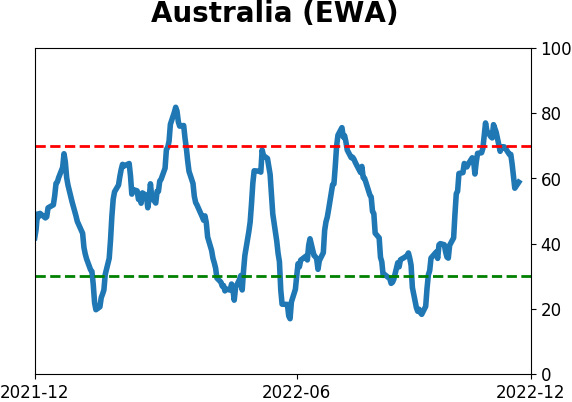
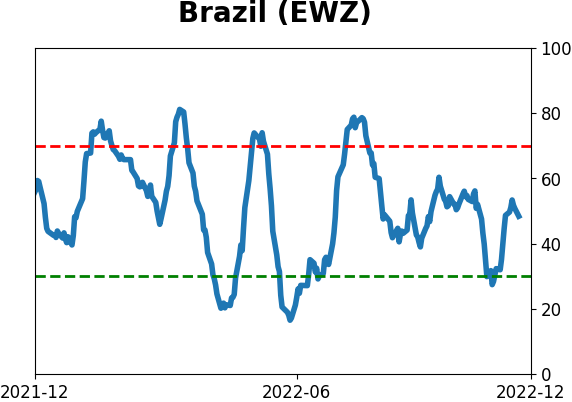
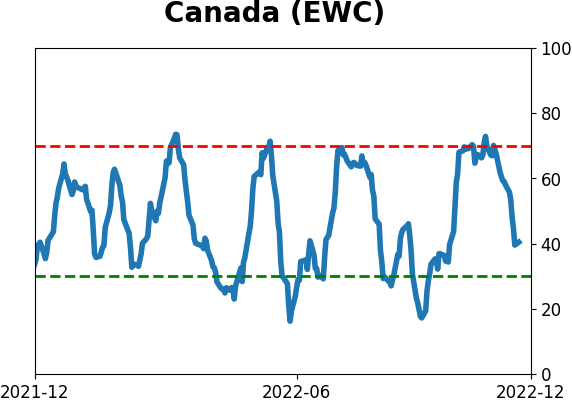
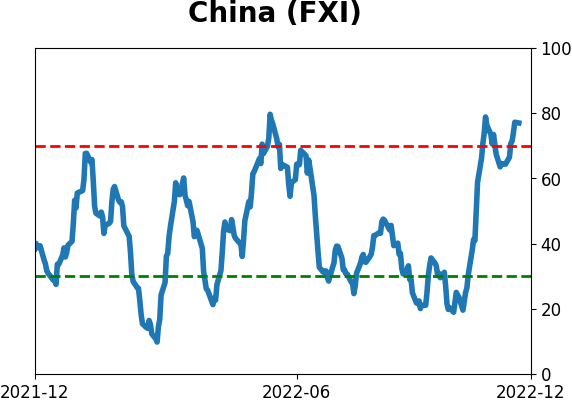
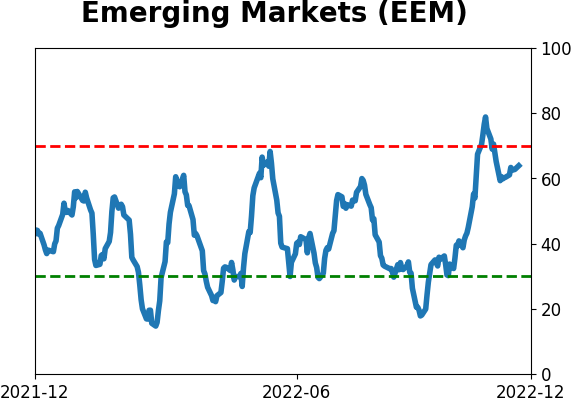
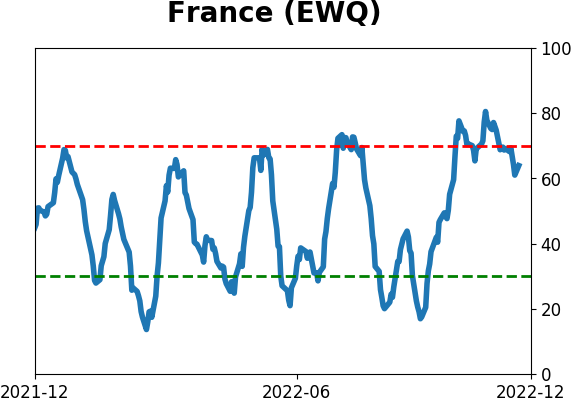
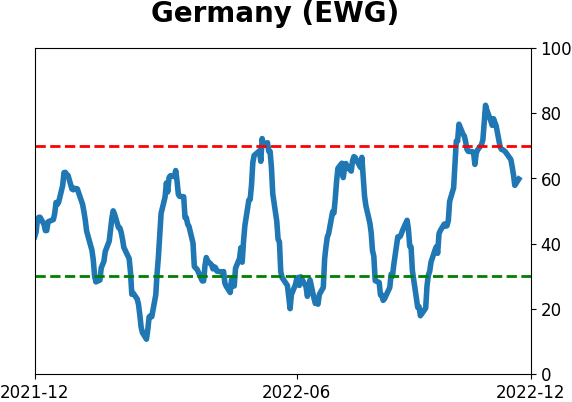
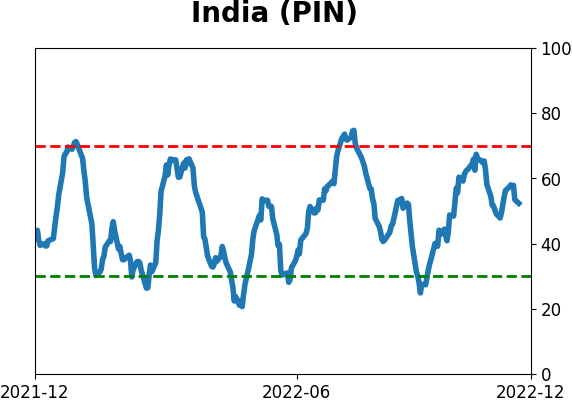
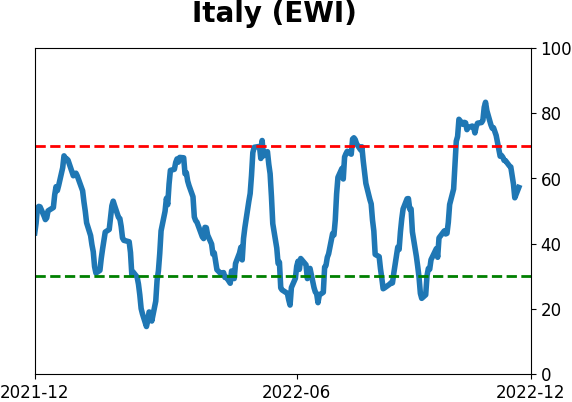
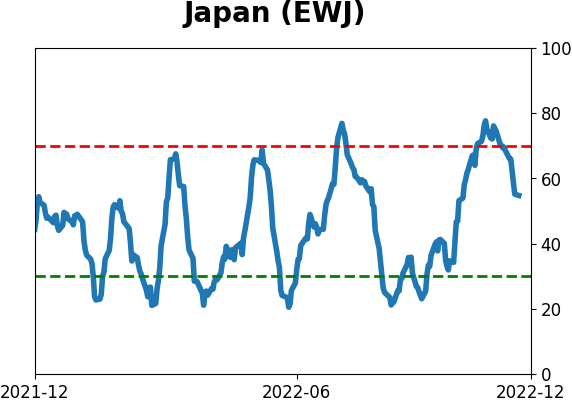
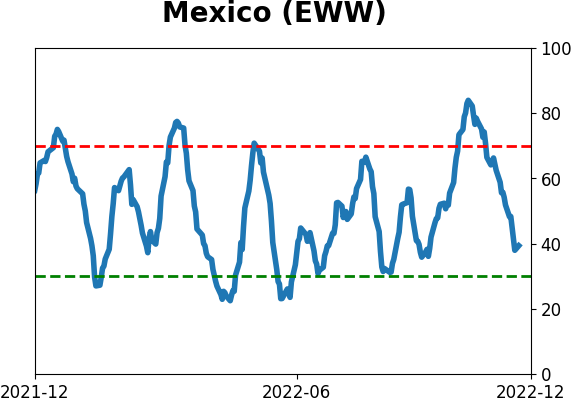
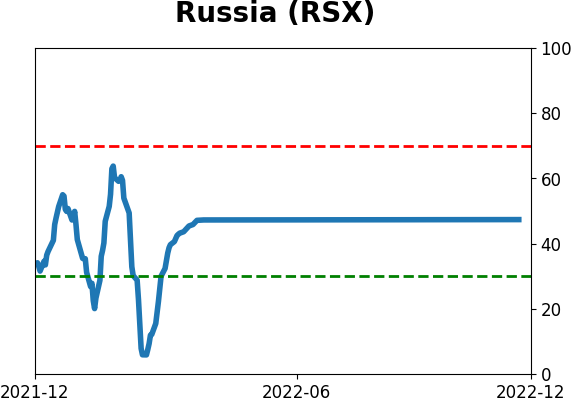
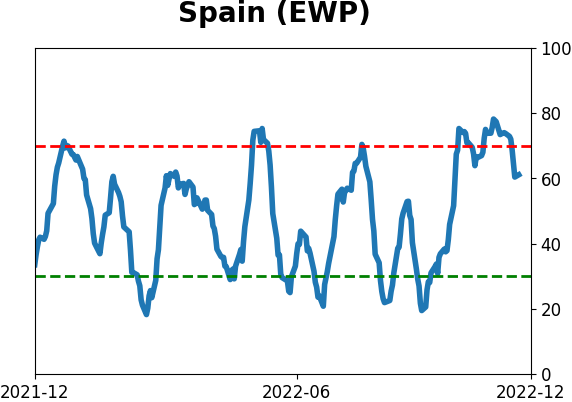
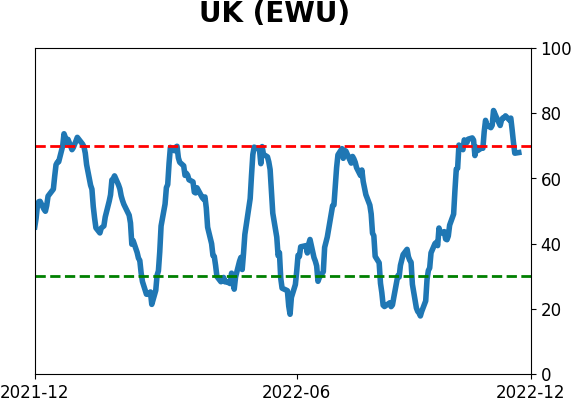
Country ETF's - 10-Day Moving Average
|
|
|
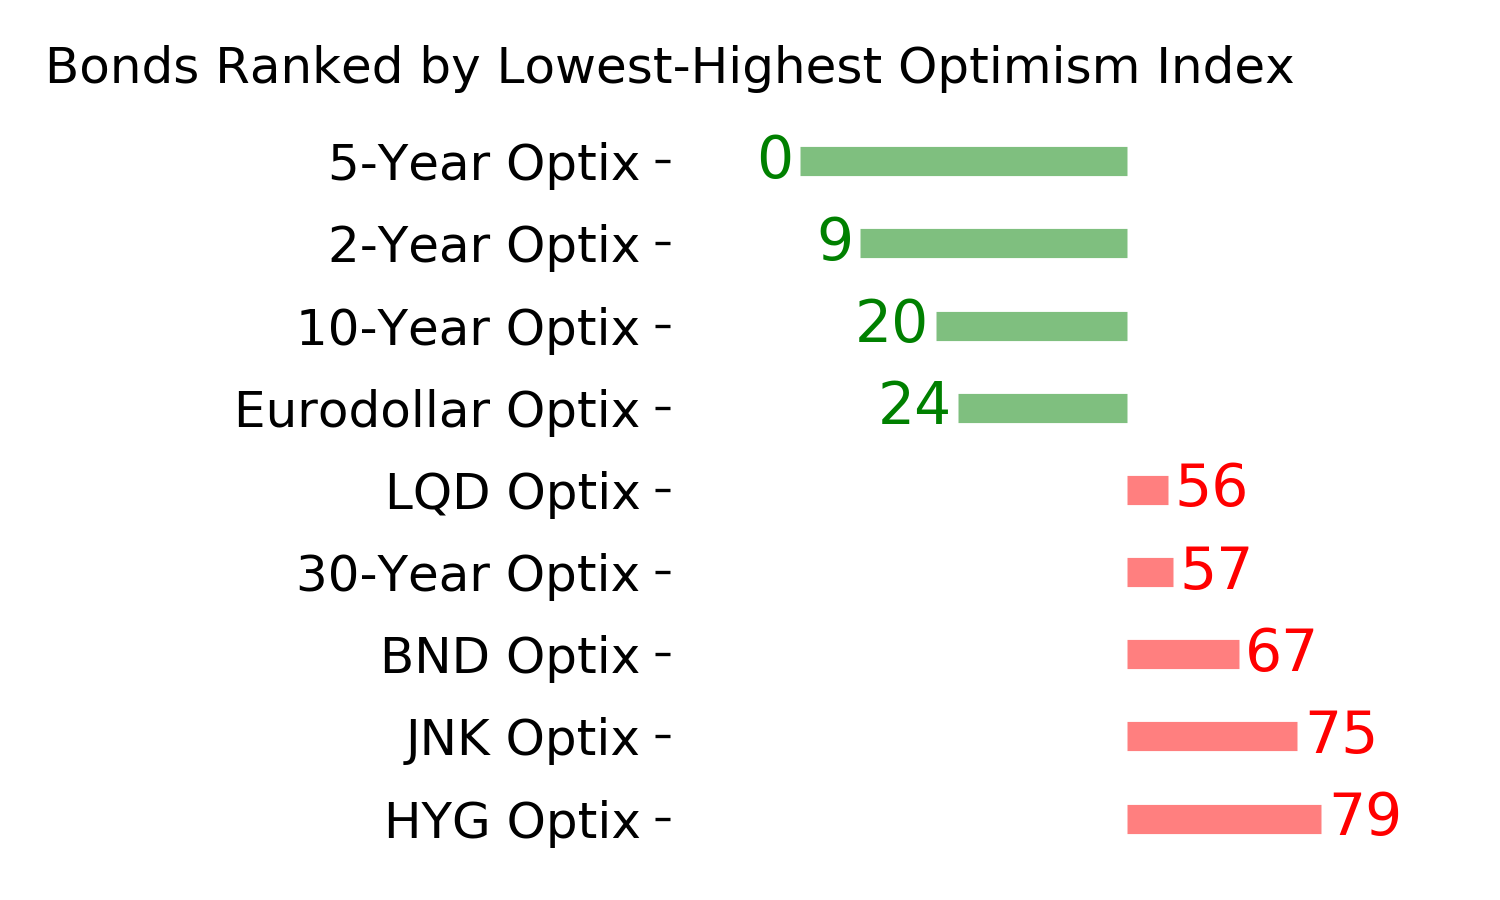
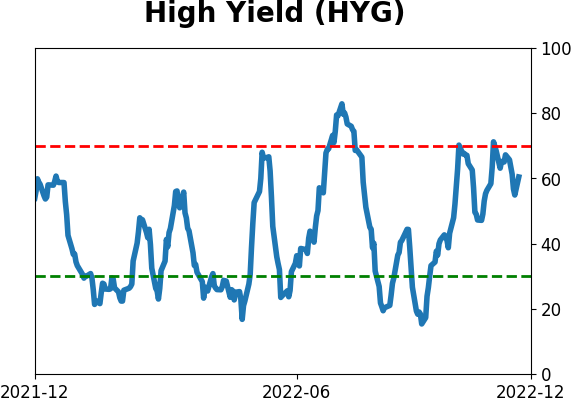
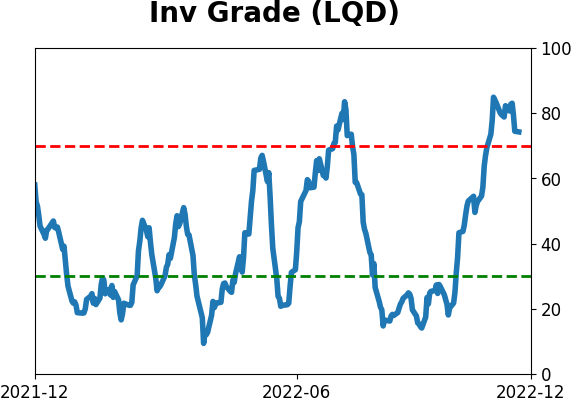
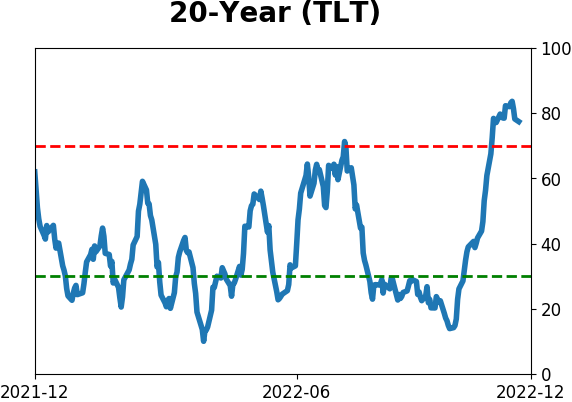
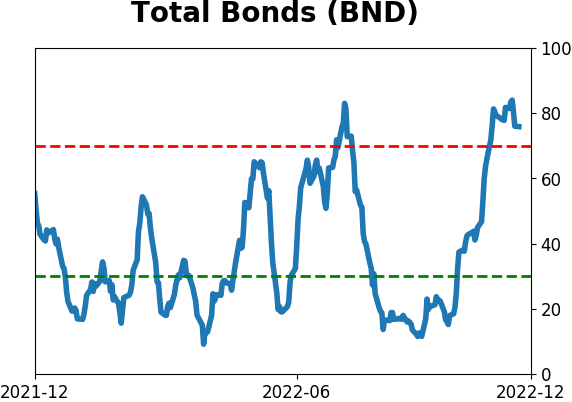
Bond ETF's - 10-Day Moving Average
|
|
|
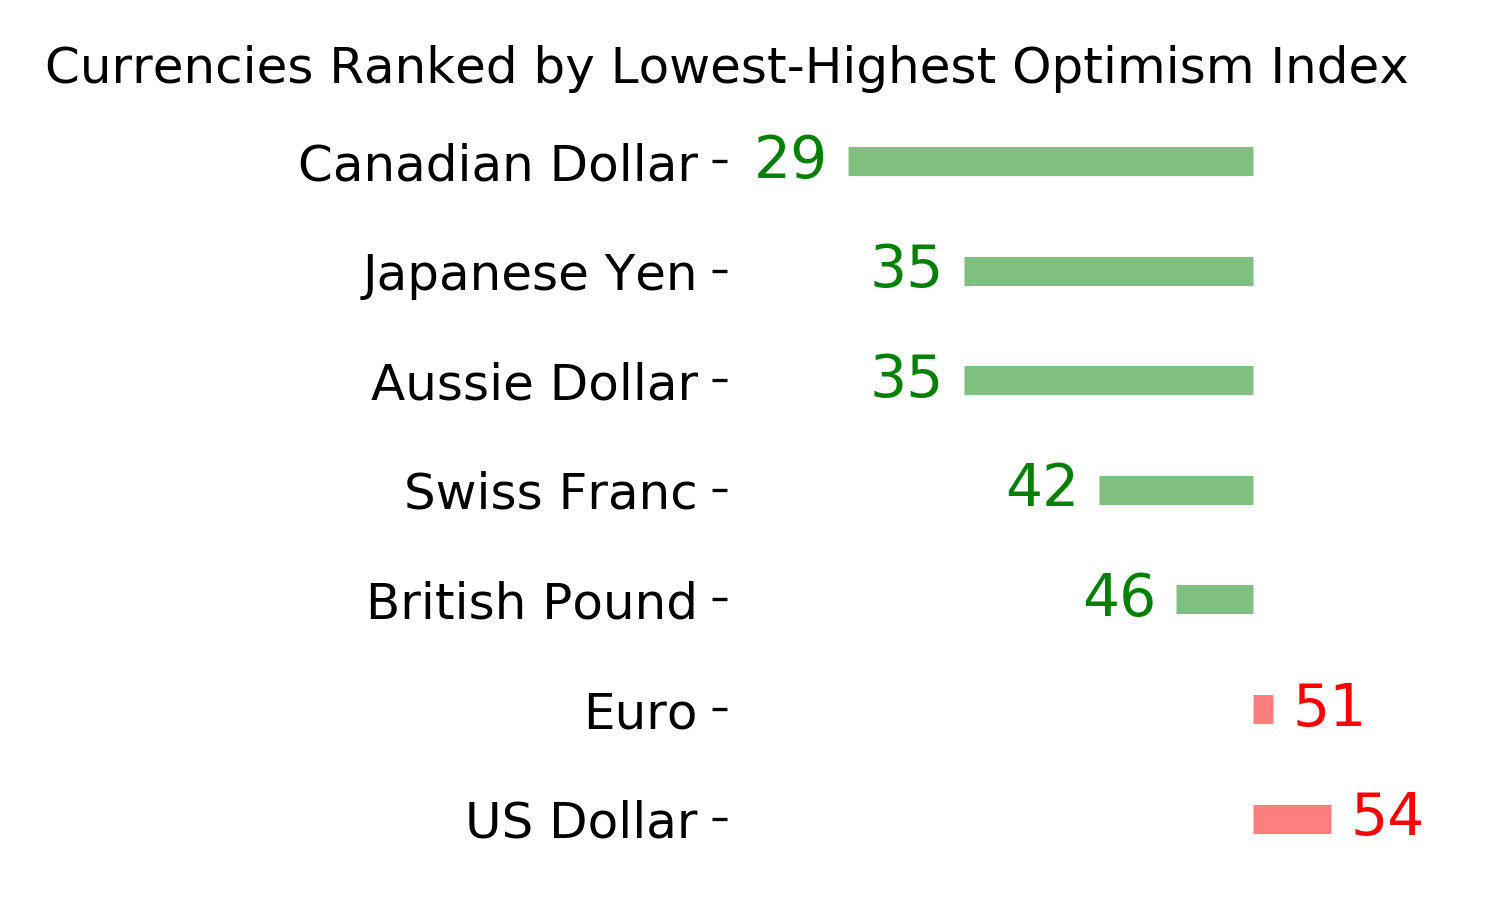
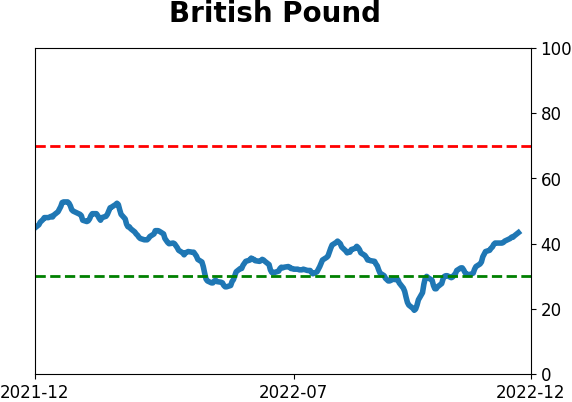
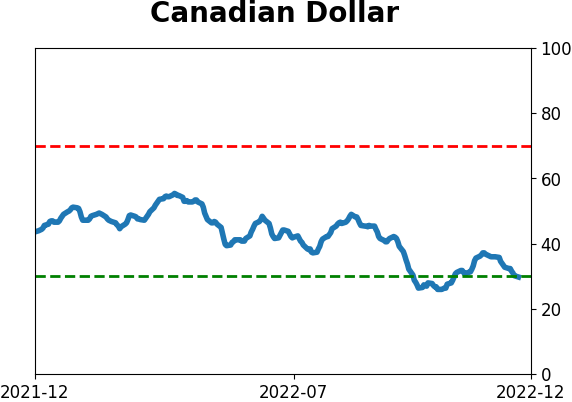
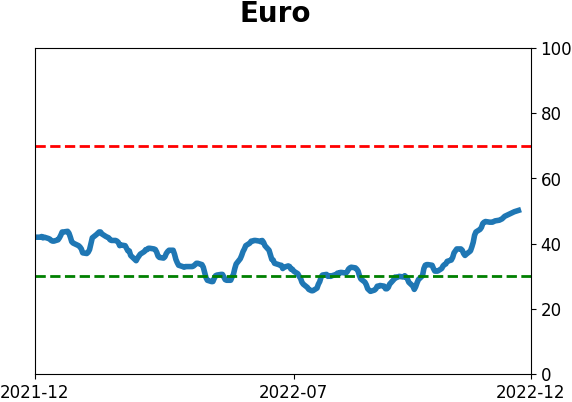
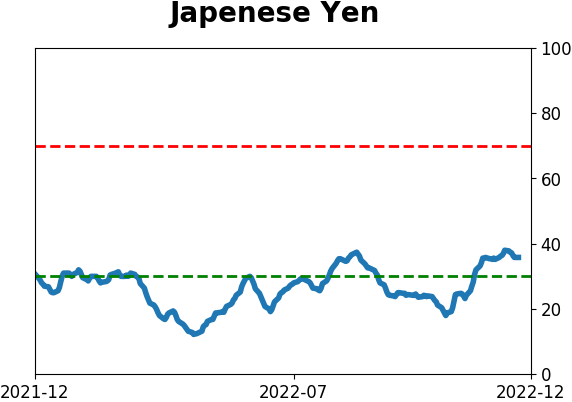
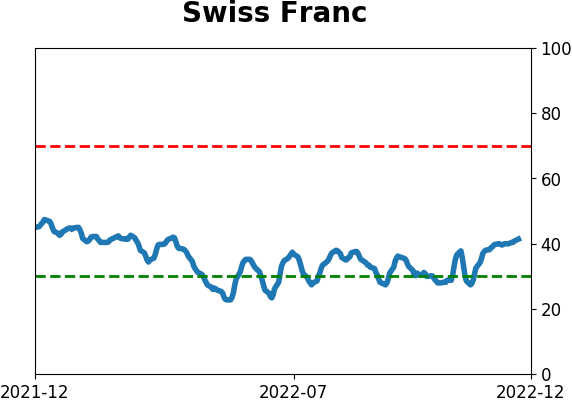
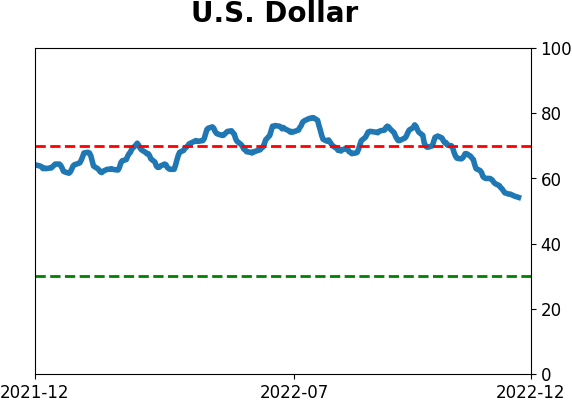
Currency ETF's - 5-Day Moving Average
|
|
|
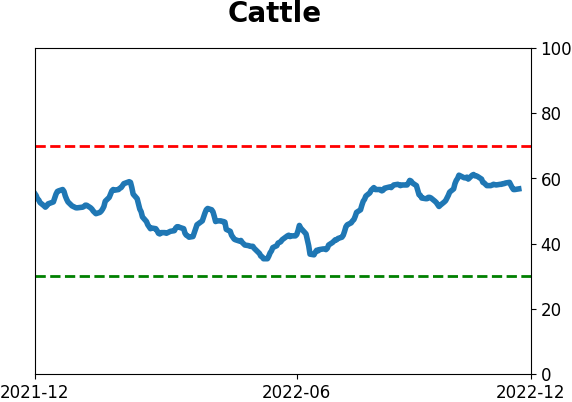
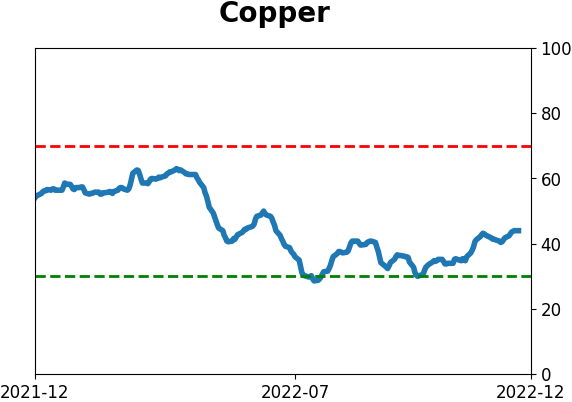
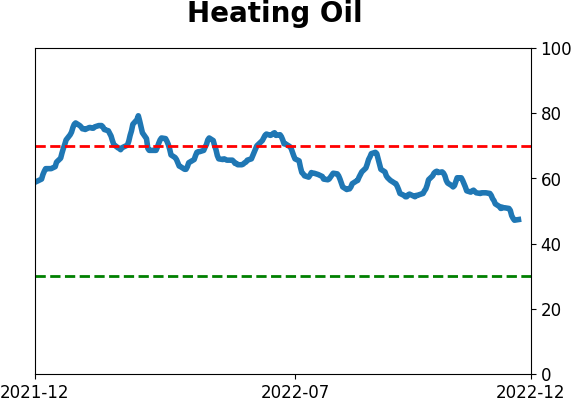
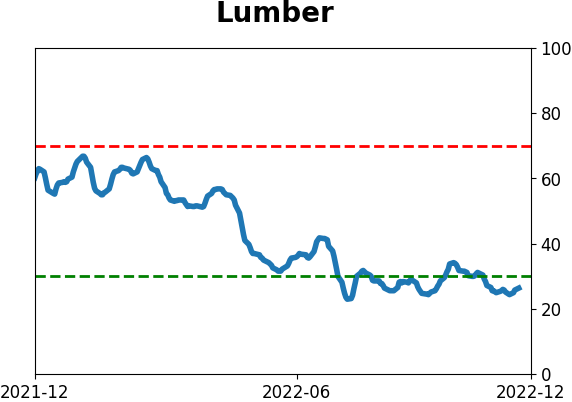
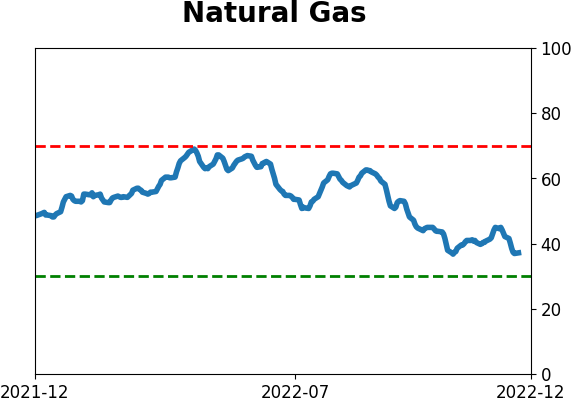
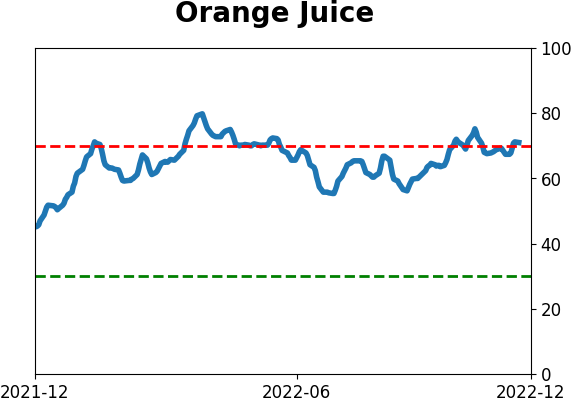
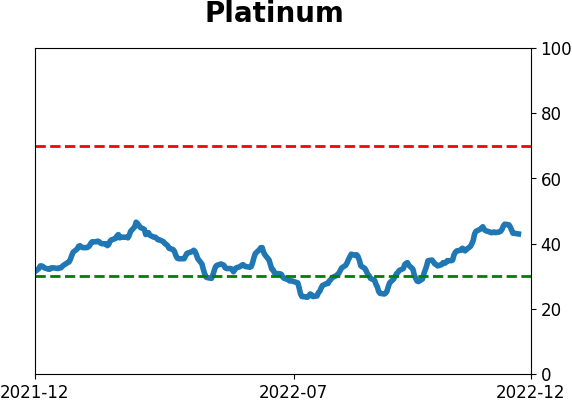
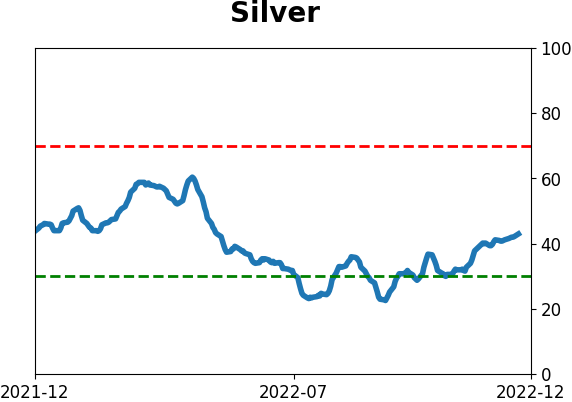
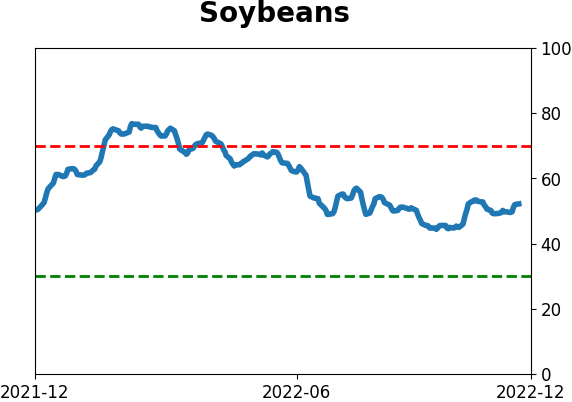
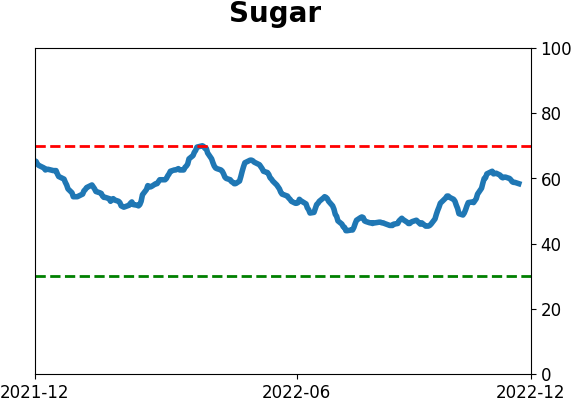
Commodity ETF's - 5-Day Moving Average
|
|