Headlines
|
|
Weekly Wrap for Dec 10 - Pessimism in an uptrend, big breadth thrust, South Korean stocks hit:
The S&P 500 was in a healthy market environment heading into this week, but pessimism was building and reached an extreme by some indications. Then buyers stepped in and we witnessed impressive breadth thrusts. South Korean stocks have got hit hard enough to be long-term oversold.
The latest Commitment of Traders report was released, covering positions through Tuesday: The 3-Year Min/Max Screen shows that "smart money" commercial hedgers had a pretty quiet week, with the only new extreme being a further push into longs on the Mexican peso. They're nearing a record there, but the currency tends to only reverse once hedgers have started to get rid of their longs (implying they are establishing more exposure to the underlying currency). Hedgers remained curiously short major equity index futures, still holding about $100 billion net short. Again, this data has been acting oddly since last spring and we're not putting much weight on it. They have started to reverse their long position in 10-year Treasury notes, now holding less than 15% of open interest net long. The Backtest Engine shows that the TLT fund rallied 83% of the time after similar reversals, averaging a return of 3.5% over the next 3 months.
Bottom Line:
STOCKS: Hold By early October, sentiment had reset. Several important momentum streaks ended, which has brought in buyers in the past, and seasonality turned positive. We're now seeing signs that sentiment has quickly shifted, especially among options traders. It's gotten to an extreme that has preceded weaker-than-average returns.
BONDS: Hold In late October, sentiment on bonds - from Treasuries to corporates - entered pessimistic territory. It's now starting to recover, with some quick moves in corporate bonds. We'll see if those bonds, in particular, can hold recent gains.
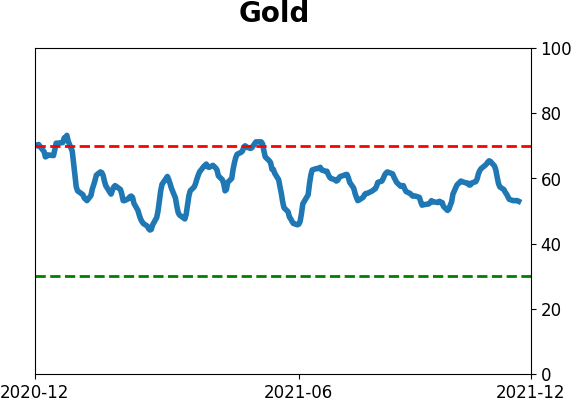
GOLD: Hold
Gold and miners were rejected after trying to recover above their 200-day averages in May. Some oversold extremes in breadth measures among miners triggered in late September, and they've recovered a bit since then. The group still has some proving to do.
|
Smart / Dumb Money Confidence
|
Smart Money Confidence: 66%
Dumb Money Confidence: 46%
|
|
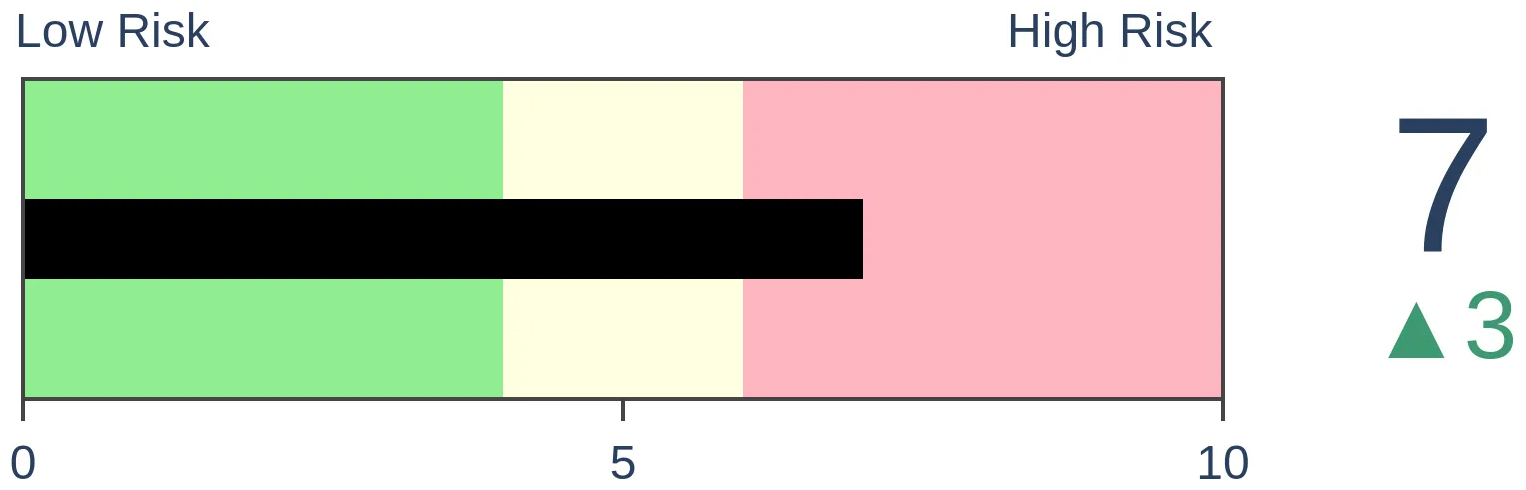
Risk Levels
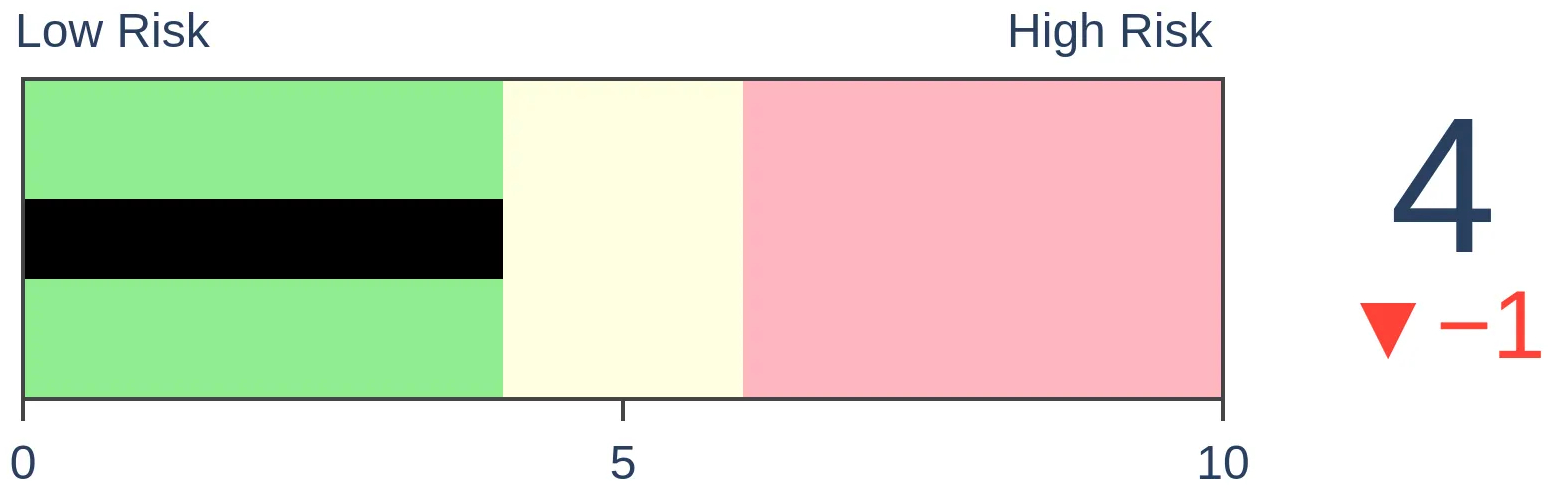
Stocks Short-Term
|
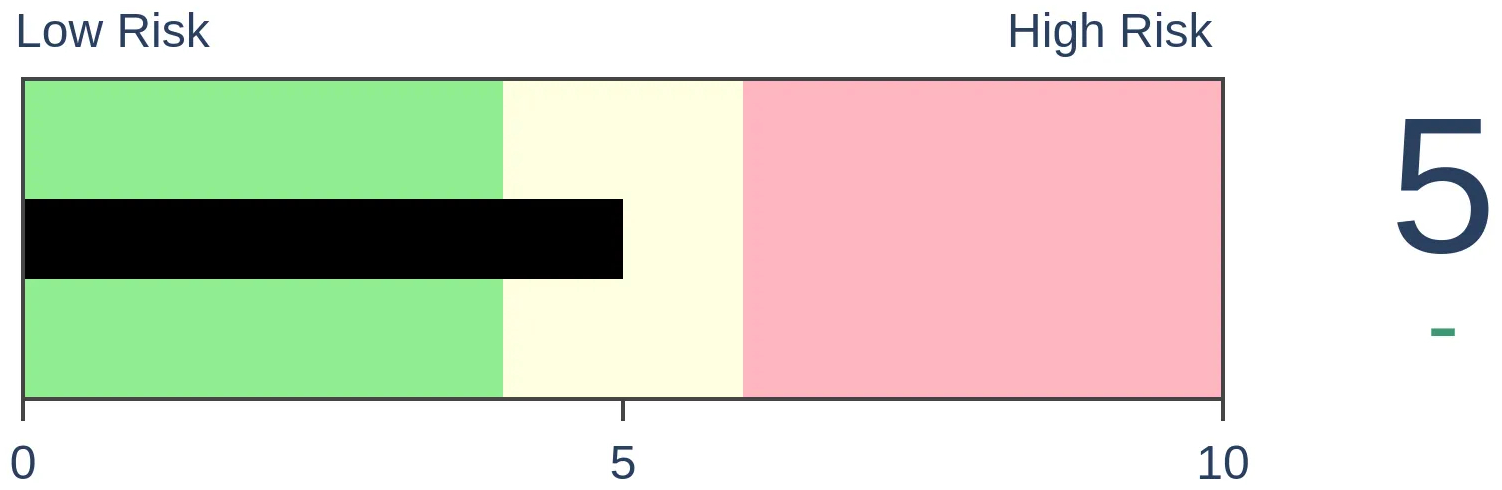
Stocks Medium-Term

|
|
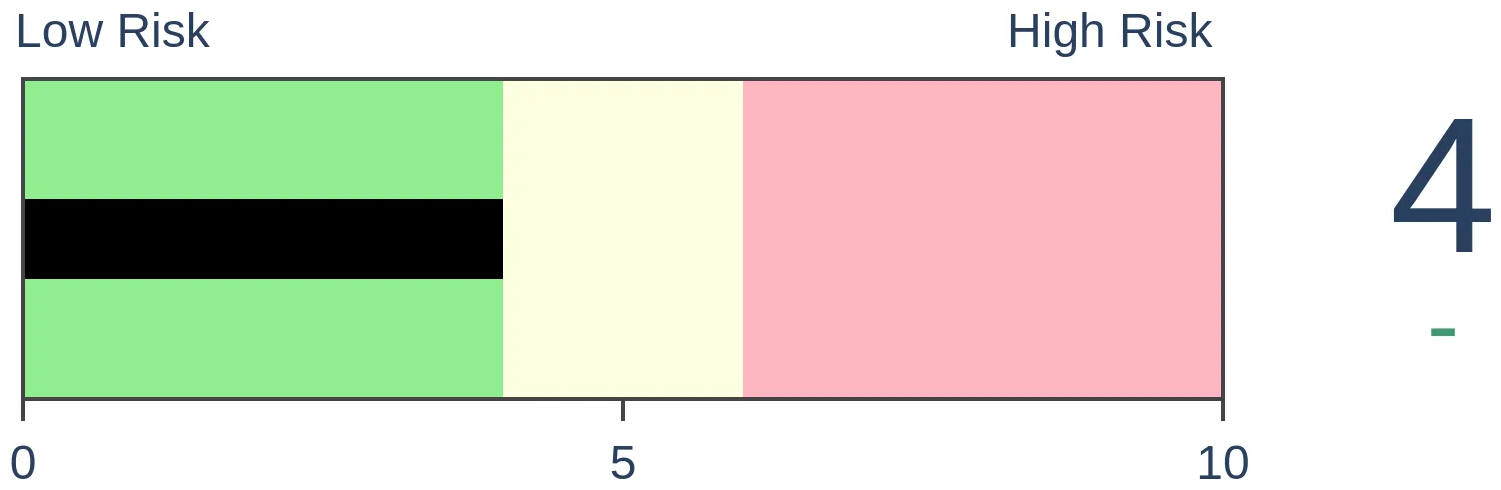
Bonds
|
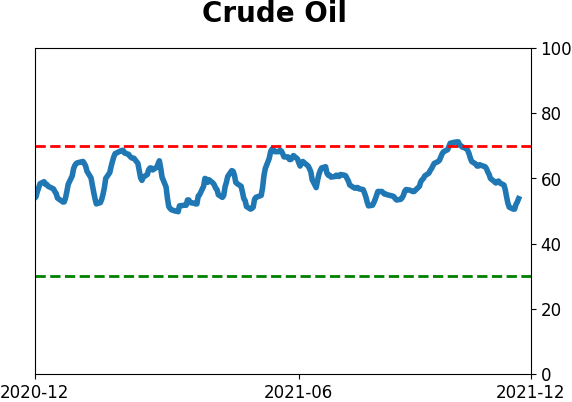
Crude Oil

|
|
Gold
|
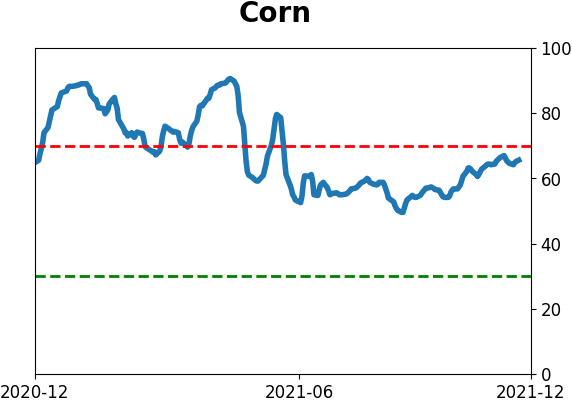
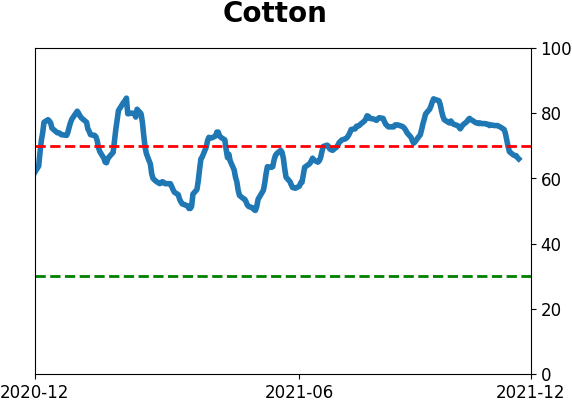
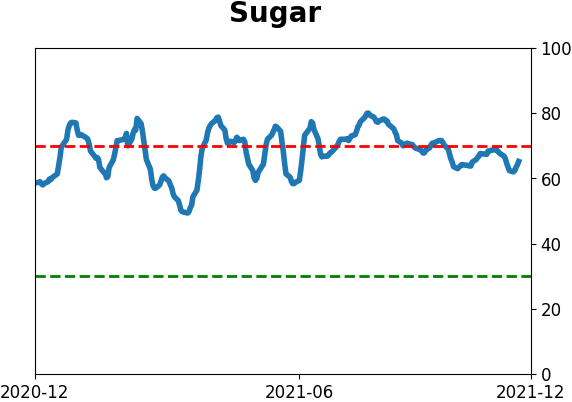
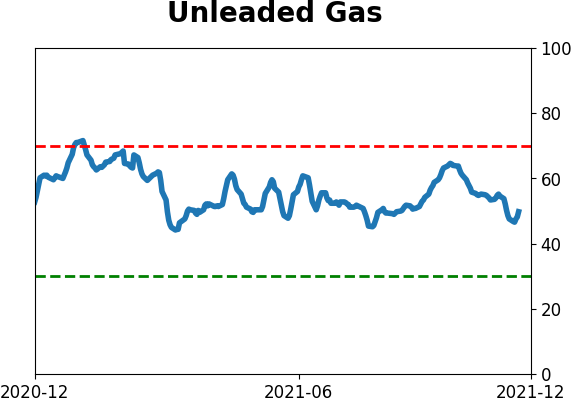
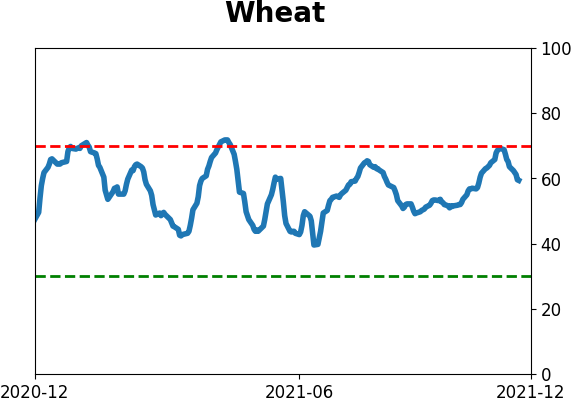
Agriculture
|
|
Research
By Jason Goepfert
BOTTOM LINE
The S&P 500 was in a healthy market environment heading into this week, but pessimism was building and reached an extreme by some indications. Then buyers stepped in and we witnessed impressive breadth thrusts. South Korean stocks have got hit hard enough to be long-term oversold.
FORECAST / TIMEFRAME
None
|
Key points:
- The market environment for the S&P 500 has been healthy
- Even so, pessimism built to an extreme entering this week
- The mid-week breadth thrust that triggered has an extremely impressive record at showing medium-term gains
- South Korean stocks have been hit hard enough to be historically oversold
- Corn is entering its best window of the year
Pessimism was building during a (mostly) healthy environment
Over the 20 years we've been publishing here, we've had the good fortune to test thousands of strategies. There is a reason we keep coming back to sentiment-related measures - because they worked more consistently over a multi-month time frame than any other.
One of the keys, however, is context. Investors behave differently during bull markets than they do during bear markets, and both of those are different than trading ranges.
There are a few simple primary guides we watch, all of which are positive:
- Are there a series of higher highs and higher lows? YES
- Are prices above a rising 200-day moving average? YES
- Are more than 60% of stocks consistently holding above their averages? YES (but wobbly)
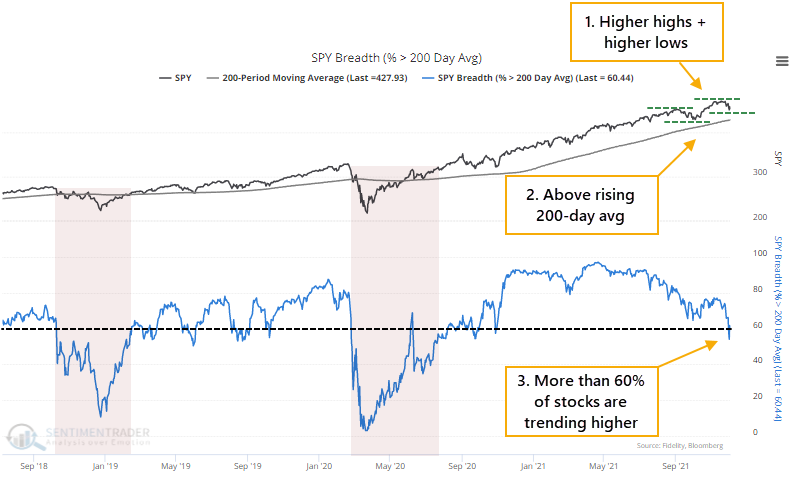
And a few secondary ones, all of which were negative. So, this is a problem.
We've spent much of the last couple of weeks looking at how split the stock market has been, with too many securities diverging from what the major indexes were doing. These conditions have a strong habit of leading to poor short- to medium-term returns. We can see that above, with positive trend indications in the S&P 500, but negative elsewhere.
An iffy market environment makes it more challenging to know how much weight to put on mean-reversion indicators. Historically, conditions like this are most like trading-range environments, where buying pessimism and selling optimism work the best.
If we look at our models, they're mostly showing risk-off behavior. In the case of the spread between Smart Money and Dumb Money Confidence, it hit an extreme.
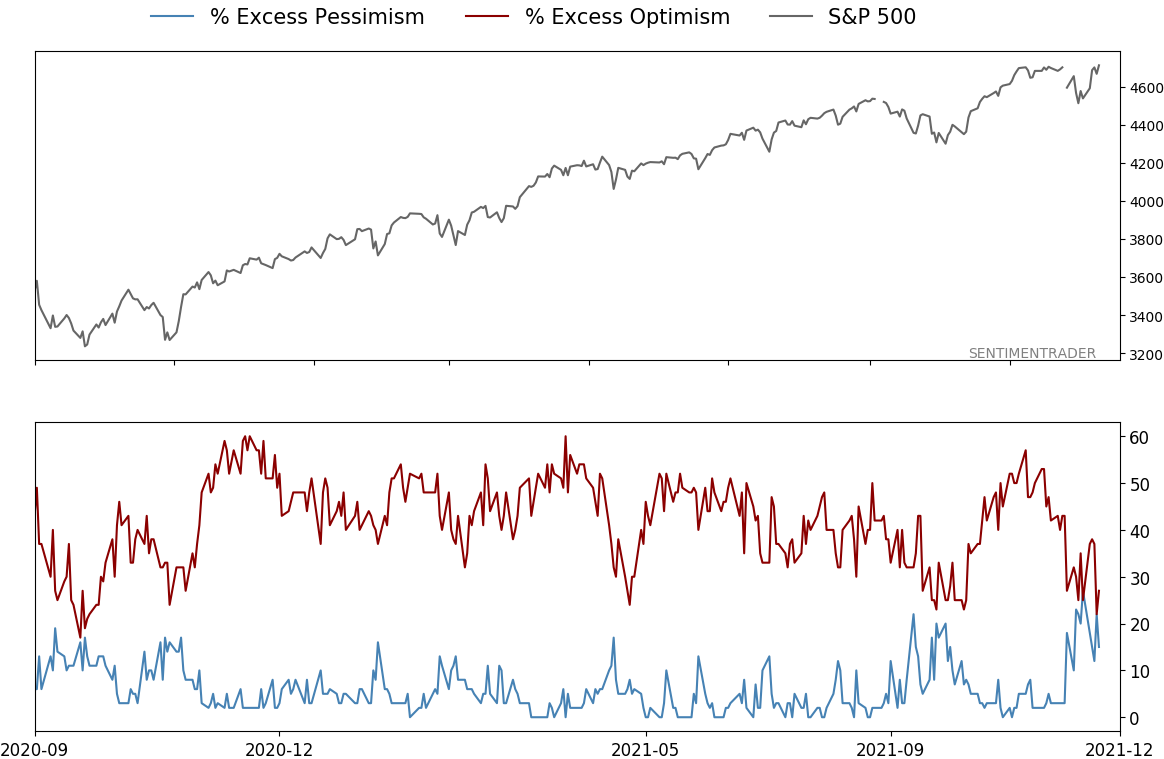
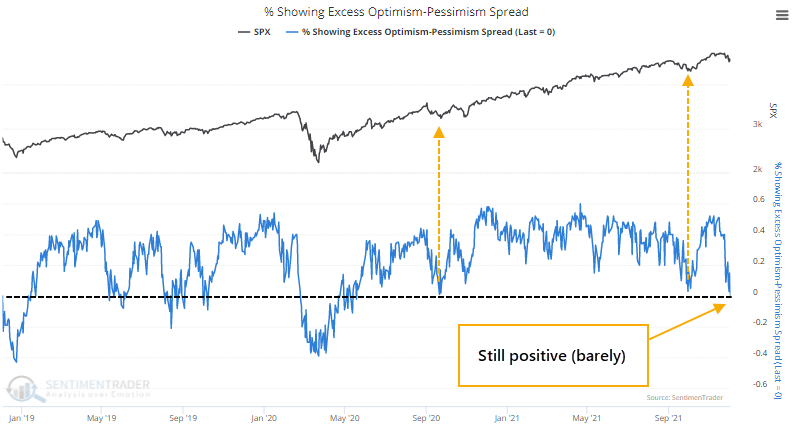
There is an even balance between those showing optimistic extremes and pessimistic ones among almost all of our indicators. When this (mostly) holds above zero, it shows risk-seeking behavior and a positive mood among investors, making it easier for stocks to rise. This one is hanging on the precipice. When it got this low during September 2020 and again in September 2021, stocks bottomed, so we'll have to see how this one is treated.
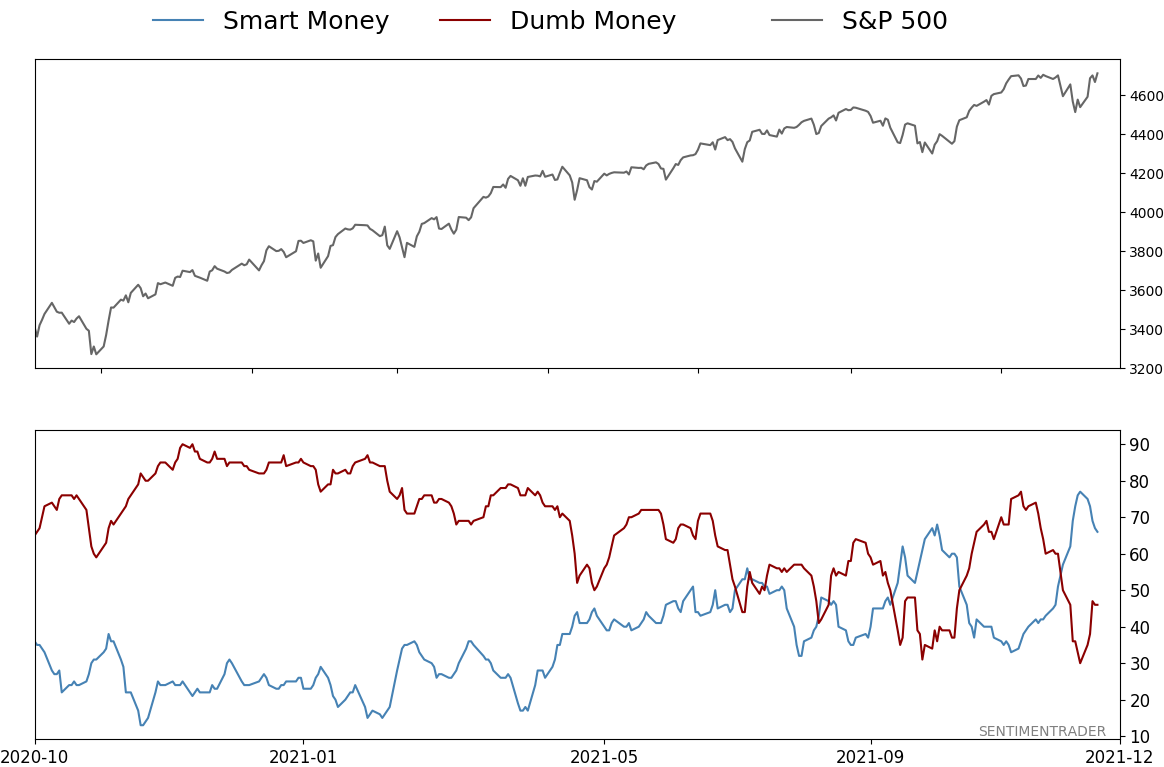
At the same time, the confidence in a rally among Smart Money indicators has jumped. It would be even more extreme if there weren't a curiously large plunge in "smart money" commercial hedger positions in equity index futures.
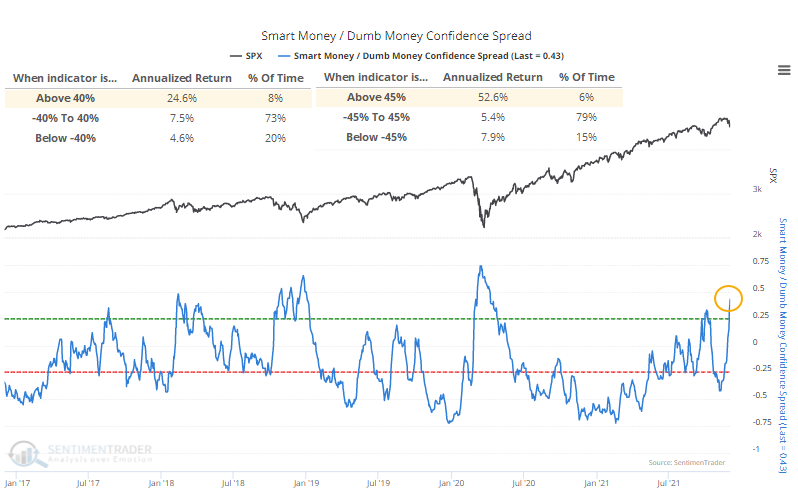
We can see the stark change in attitude below. Despite the weird increase in a net short position in index futures, Smart Money Confidence jumped to 77%, the highest since late April 2020. Dumb Money Confidence plunged to 30%, the lowest since early April 2020.
This adjustment in behavior has caused the spread between them to rise above 45%. The S&P 500's annualized return when the spread is above 45% was +52.6%, nearly 10x the return when sentiment was neutral.
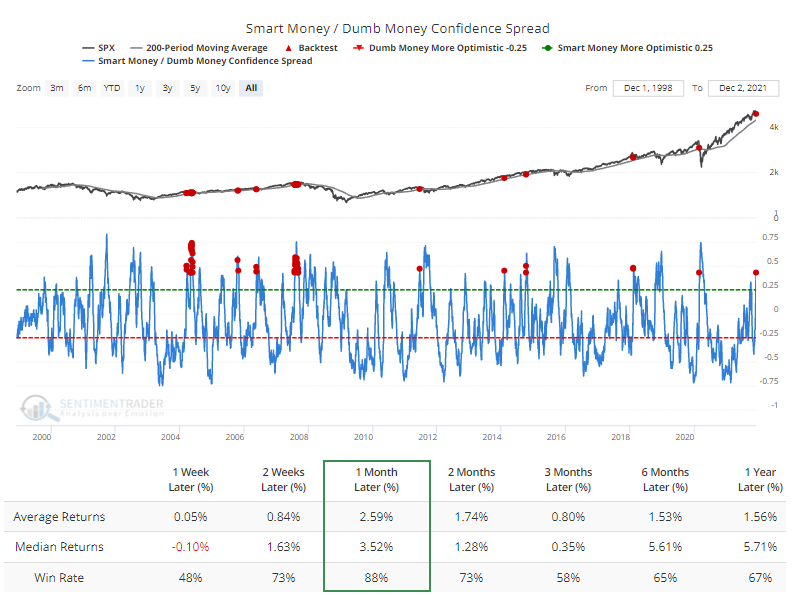
The Backtest Engine shows that a reading this high when the S&P 500 is trading above its 200-day average preceded a rally over the next month after 42 out of 48 days. The pandemic crash was a big exception. When sentiment extremes fail, they tend to fail hard.
Then came the buyers
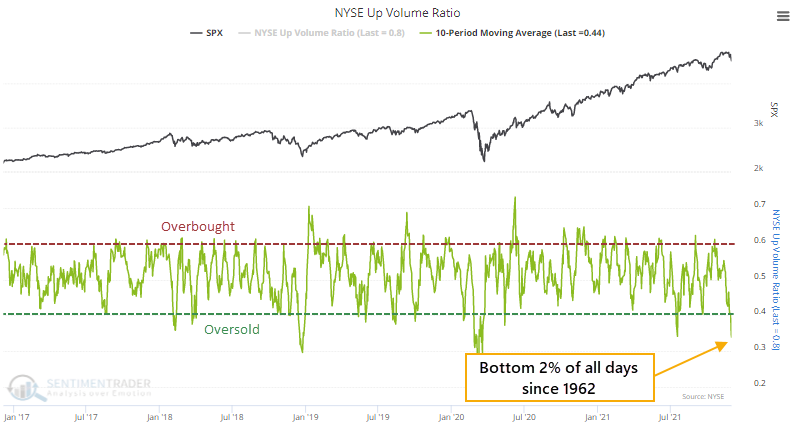
At the end of November, selling pressure was concentrated enough to push the 10-day average of NYSE Up Volume below 40%. By December 1, that 10-day average dropped to 34%, oversold enough to be in the bottom 2% of all days since 1962.
Since then, it's been a buying frenzy. Out of the last 4 sessions through Wednesday, 3 saw more than 80% of volume focused on advancing securities.
The reversal from oversold conditions to persistent and heavily skewed buying interest has triggered a breadth thrust with an excellent track record.
After the 10-day average of Up Volume fell below 35%, we've now had 3 out of 4 days with impressively skewed volume. Since 1962, this has only happened five other times, all leading to gains of at least 18.8% over the next year. The risk/reward was tilted heavily to the "reward" side.
If we relax the oversold condition to a 10-day average below 40% (instead of 35%), we double the sample size.
Granted, the sample is still painfully small, but the consistency in future returns is compelling. The chart below shows the price path of the S&P 500 in the year following each of the signals. After 125 days, almost exactly 6 months, there were no negative returns. A few of them saw modest drawdowns, mostly 5% or less, within the first 100 days, with the worst one being from October 2002.
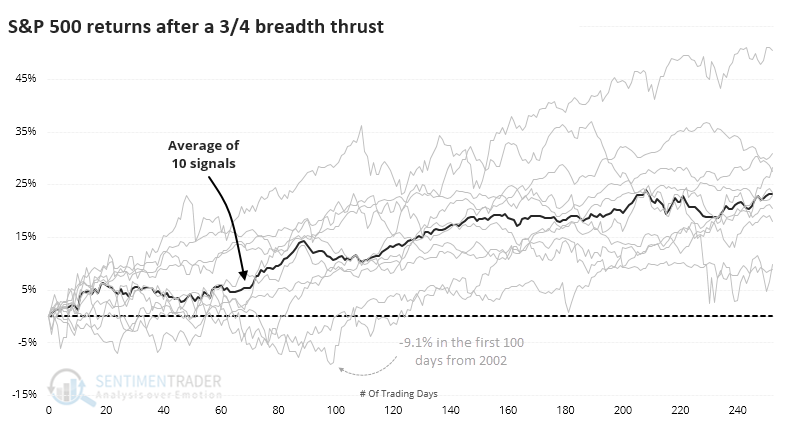
Even though the 6-12 month returns were excellent, it's hard to hold if there is a lot of pain to get there. But the Risk/Reward Table shows the S&P's remarkable long-term performance. At its best point over the next year, the index gained at least 10% every time, with an average of more than 25%. But at no time with the following year, across any of the signals, did the S&P decline more than -10%.
More signs of a thrust
Related, Dean showed that a new signal from a voting member in the TCTM Composite Thrust Model issued an alert at the close of trading on Wednesday. The component is called the percentage of members above the 10-day reversal model.
The number of S&P 500 members above the 10-day moving average increased from 5% to 89% in only 5 sessions. That's the quickest reversal since last October.
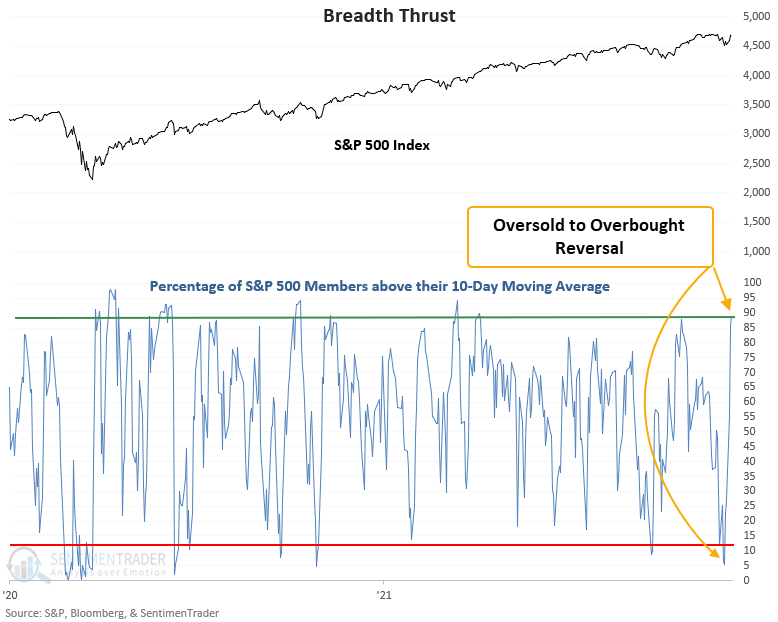
This signal triggered 52 other times over the past 93 years. After the others, future returns and win rates were solid across all time frames. The 2-month time frame shows 36 out of 39 winners since 1947 and is currently riding a 15 signal winning streak. The worst drawdown in the previous 39 signals was -4%.

Very long-term indicators are still showing something worrying, though
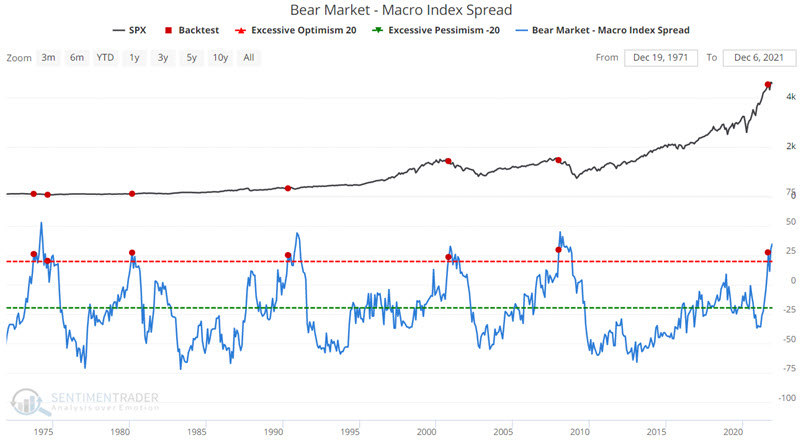
Jay looked at the Bear Market - Macro Index Spread, which is at a concerning level for long-term returns.
This indicator shows the spread between the Bear Market Probability indicator and our Macro Index model. The higher the indicator, the greater the probability of a new bear market, combined with deteriorating fundamental macro conditions, negative for stocks. The lower the indicator, the lower the probability of a significant decline, usually combined with improving macro conditions, which is positive for stocks.
We want to see the indicator reach a significantly high level for the sell signal. A sell signal occurs when the indicator rises to 20 or higher for this test.
The chart below displays the sell signals generated when the indicator crossed above 20 for the first time in a year. You can run this test in the Backtest Engine.
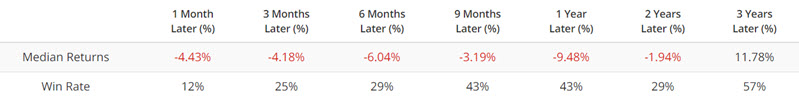
For testing, we will use the daily closing price for the S&P 500 Index, entering and exiting on the date of each signal.
The chart below displays the growth of $1 when the strategy is on a "Buy" signal. $1 grew +6,257% to $63.57 between 10/31/1969 and 12/3/2021.

The chart below displays the growth of $1 when the strategy is on a "Sell" signal. $1 declined -26% to $0.74 between 10/31/1969 and 12/3/2021.
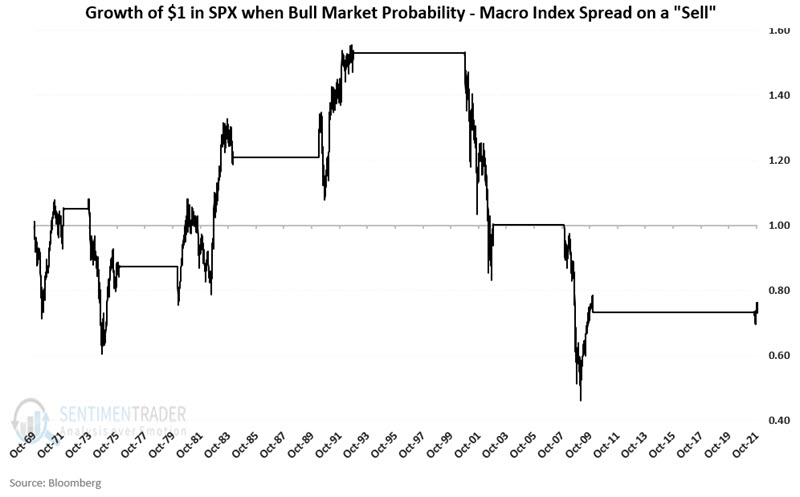
Over the past 50+ years, the S&P 500 Index has achieved all of its net gain (and more) while this Bear Market Probability minus Macro Index Spread strategy was on a buy signal. While we do not necessarily recommend the use of this as a standalone strategy, as part of a larger "weight of the evidence" approach, this model can offer valuable risk-on/risk-off information. This particular model is presently in "risk-off" mode, so we'll have to see if the recent surge in buying interest and signs of pessimism will be enough to counter some of these contradictory forces.
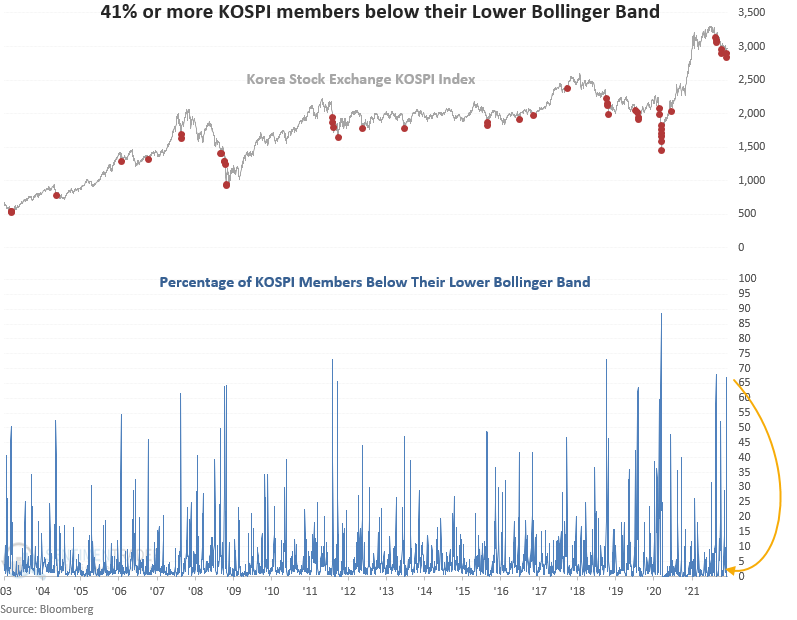
South Korean stocks got hit hard, then saw some reversals
Dean looked at a new signal from a mean reversion model that utilizes the percentage of KOSPI index members below their lower Bollinger band registered an alert.
The Bollinger Band signal identifies when the percentage of index members trading below their lower Bollinger band cycles from a high to a low level. At the same time, KOSPI momentum must be positive.
The percentage of KOSPI members below their lower Bollinger band recently increased to the 7th highest level in history.
This signal has triggered 19 other times over the past 18 years. After the others, future returns and win rates were good on medium-term time frames. Consistency was especially good in the 3-month time frame, with 17 out of 19 winners. The 1-week results suggest we should be mindful of a short-term pause.
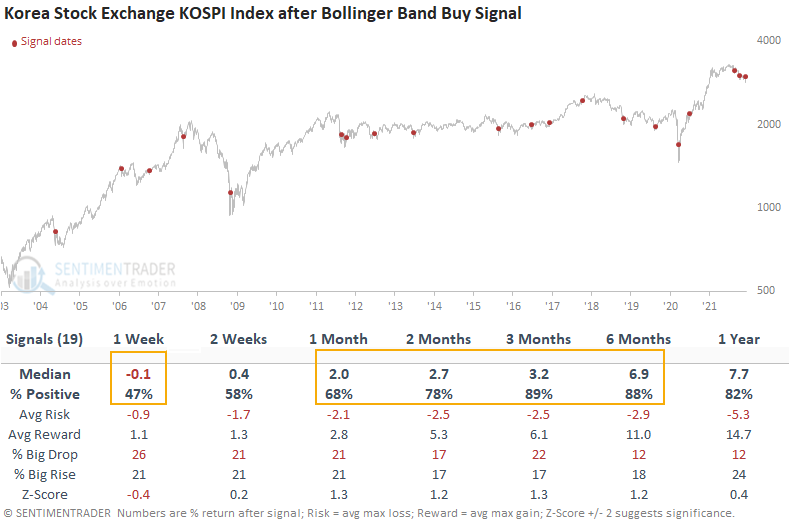
In U.S. dollar terms, the Kospi dropped more than 18% before a strong rebound in recent days. The combination of rising Covid cases and a tightening central bank hasn't gone over well.
We can see that the damage has been widespread with the advance/decline figures. On an average day heading into December, 125 more stocks declined than advanced. Only the global financial crisis and the pandemic panic can match this.
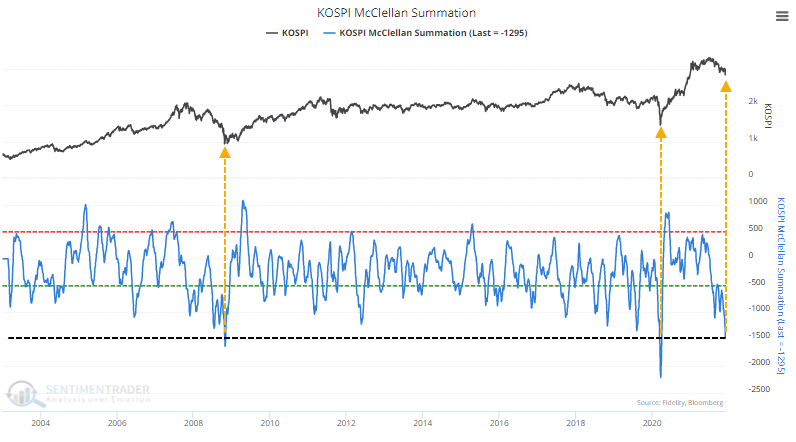
Because breadth was so wretched for so long, the Kospi's McClellan Summation Index sunk to one of its lowest-ever levels but has reversed strongly in recent days. Again, only the worst crashes in the past 20 years can compare to what we've seen in recent months.
The declines in South Korean stocks when domestic markets were notching all-time highs triggered an exodus from the primary ETF focused on that market. The EWY fund has averaged an outflow of more than 0.35% of its assets every day for the past 50 sessions. That's the 2nd-largest outflow in the fund's history.
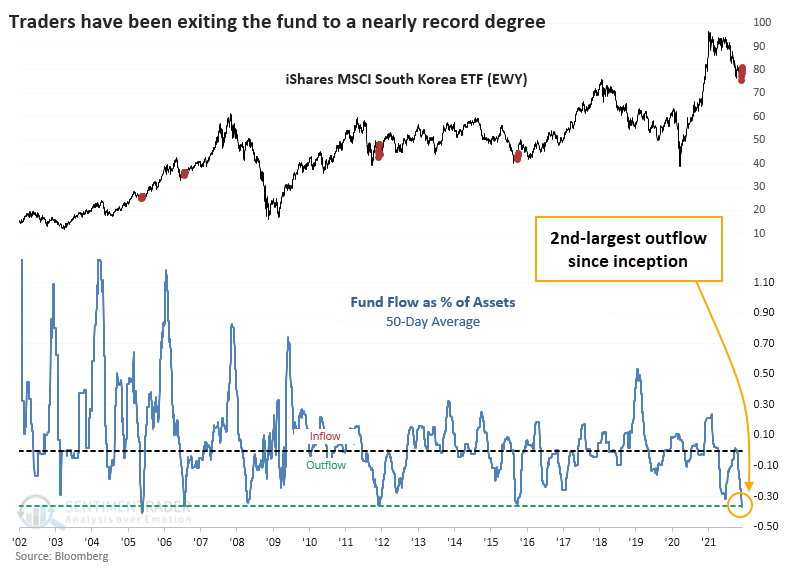
As always, changes in structural forces or unique economic circumstances can override any technical or sentiment extreme in any market at any time. But the base case is that extremes tend to revert to the mean, and we're starting to see signs of that now in South Korean stocks. In recent months, that market has been hit hard, and investors have fled. That should lead to positive returns over the medium- to long-term.
Corn's potential Santa Rally
Jay highlighted the idea that the annual seasonal trend for corn futures is now entering a favorable seasonal period.
For this test, we will examine the performance of corn futures between Trading Day of the Year (TDY) #236 and TDY #250. The chart below displays the cumulative hypothetical $ + (-) achieved by holding a long 1-lot position in corn futures ONLY during this period every year starting in 1960.
The year-by-year results show how consistently profitable this window has been, though there was that exceptional outlier in 2012.
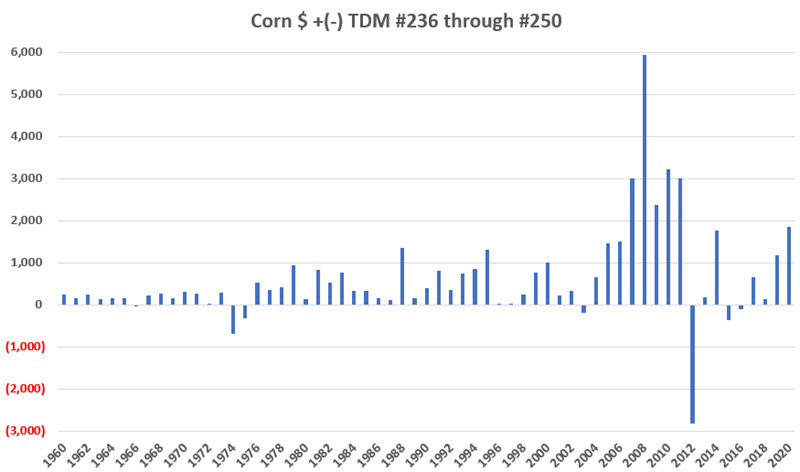
Over the past 61 years, 54 of them showed a gain during these roughly 3-week stretches with an average gain that was more than double the average loss.
About the Weekly Wrap...
The goal of the Weekly Wrap is to summarize our recent research. Some of it includes premium content (underlined links), but we're highlighting the key focus of the research for all. Sometimes there is a lot to digest, with this summary meant to highlight the highest conviction ideas we discussed. Tags will show any symbols and time frames related to the research.
Active Studies
| Time Frame | Bullish | Bearish | | Short-Term | 2 | 3 | | Medium-Term | 13 | 1 | | Long-Term | 15 | 8 |
|
Indicators at Extremes
Portfolio
| Position | Description | Weight % | Added / Reduced | Date | | Stocks | RSP | 10.7 | Added 6.4% | 2021-10-01 | | Bonds | 32.7% BND, 7.1% SCHP | 39.8 | Added 8.3% | 2021-10-26 | | Commodities | GCC | 2.4 | Reduced 2.1%
| 2020-09-04 | | Precious Metals | GDX | 4.6 | Reduced 4.2% | 2021-05-19 | | Special Situations | 9.8% KWEB, 4.7% XLE, 2.9% PSCE | 17.3 | Added 9.78% | 2021-10-01 | | Cash | | 24.1 | | |
|
Updates (Changes made today are underlined)
Much of our momentum and trend work has remained positive for several months, with some scattered exceptions. Almost all sentiment-related work has shown a poor risk/reward ratio for stocks, especially as speculation drove to record highs in exuberance in February. Much of that has worn off, and most of our models are back toward neutral levels. There isn't much to be excited about here. The same goes for bonds and even gold. Gold has been performing well lately and is back above long-term trend lines. The issue is that it has a poor record of holding onto gains when attempting a long-term trend change like this, so we'll take a wait-and-see approach. Momentum has ebbed quickly in recent weeks, and nearing oversold levels in some indicators. This can be a dangerous area, with a lot of short-term volatility, but we'd be more inclined to add medium- to long-term exposure rather than sell on much more of a decline, thanks to already rock-bottom exposure. Other areas look more attractive, including some overseas markets. RETURN YTD: 9.1% 2020: 8.1%, 2019: 12.6%, 2018: 0.6%, 2017: 3.8%, 2016: 17.1%, 2015: 9.2%, 2014: 14.5%, 2013: 2.2%, 2012: 10.8%, 2011: 16.5%, 2010: 15.3%, 2009: 23.9%, 2008: 16.2%, 2007: 7.8%
|
|
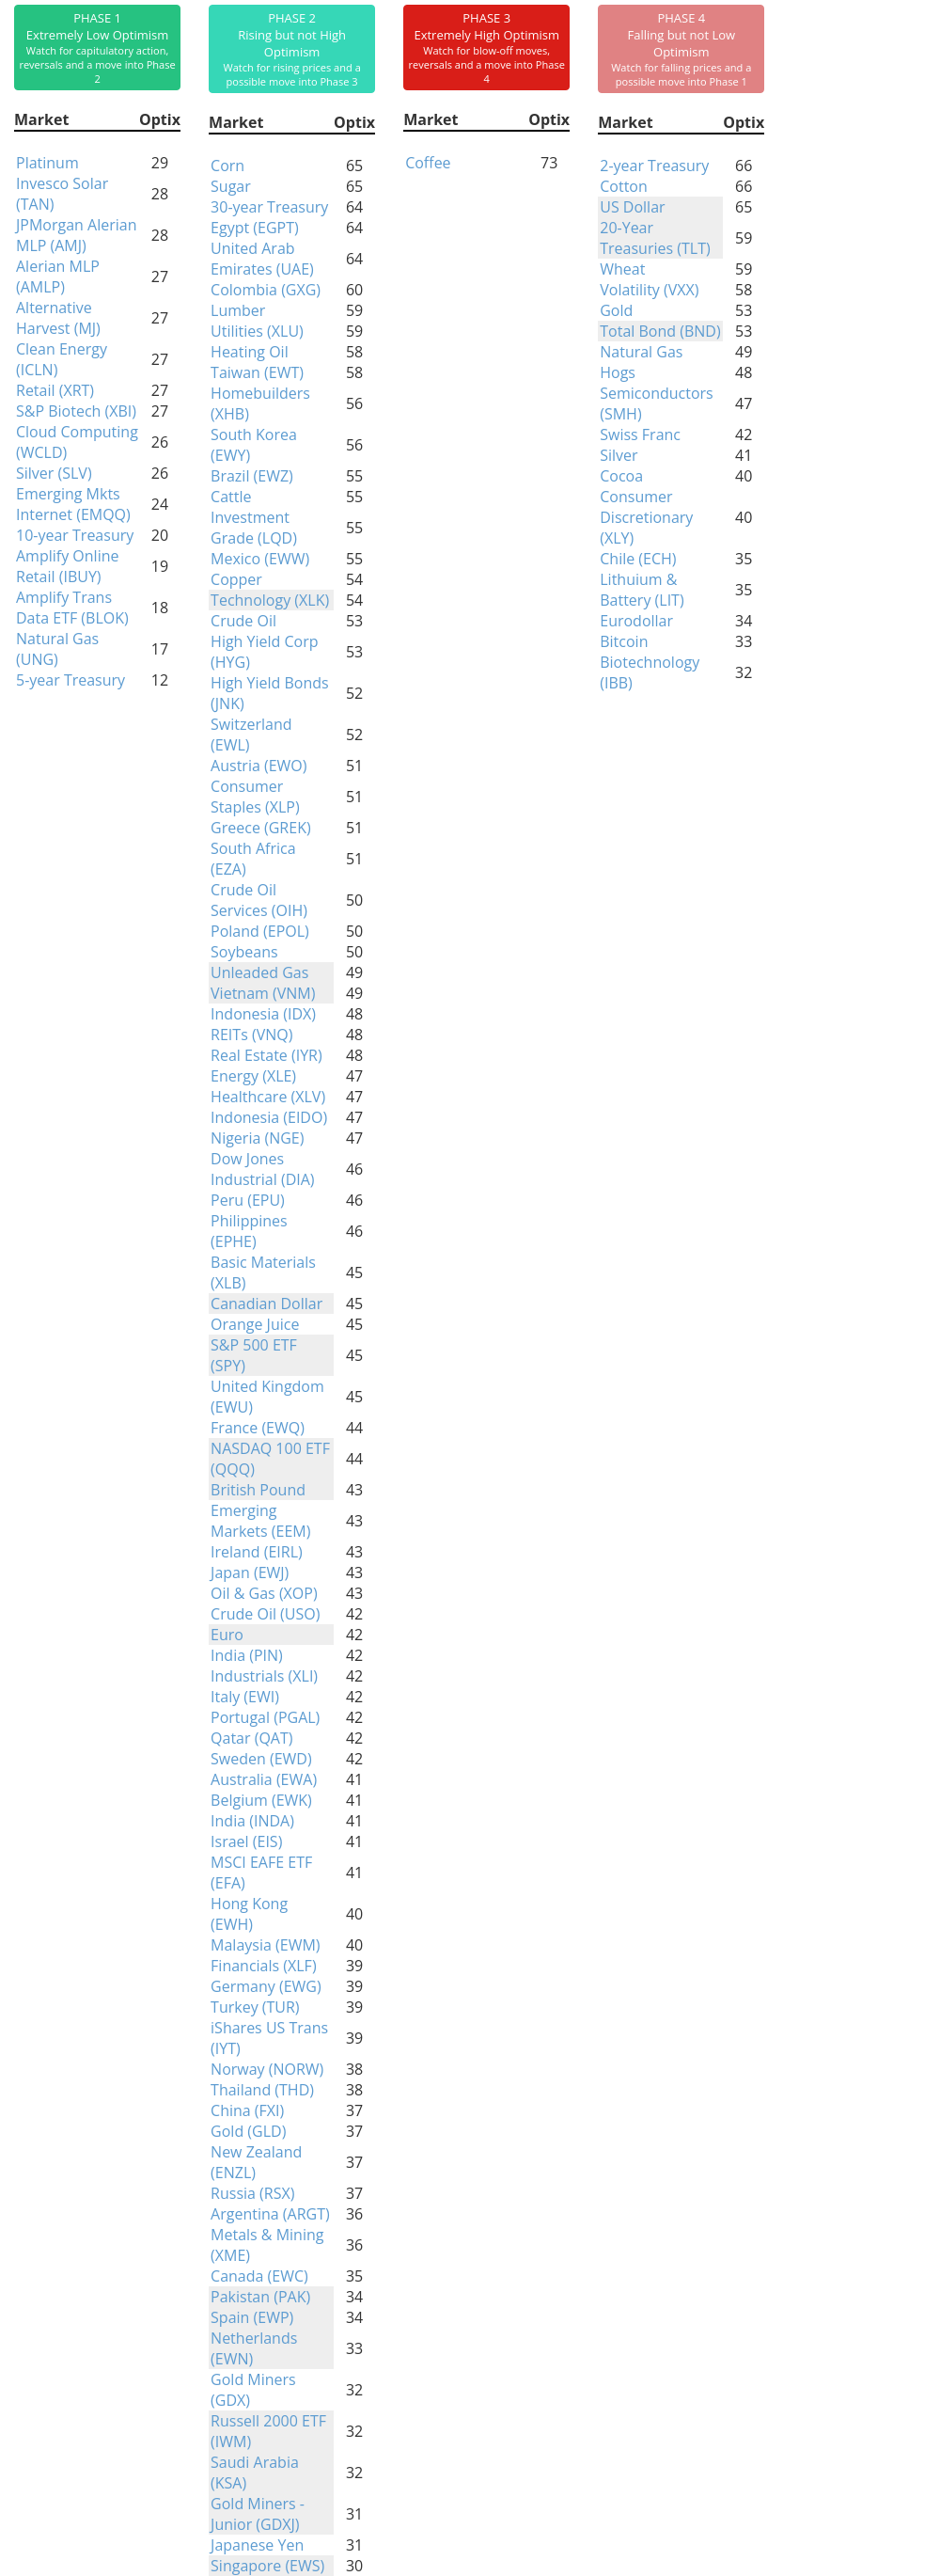
Phase Table
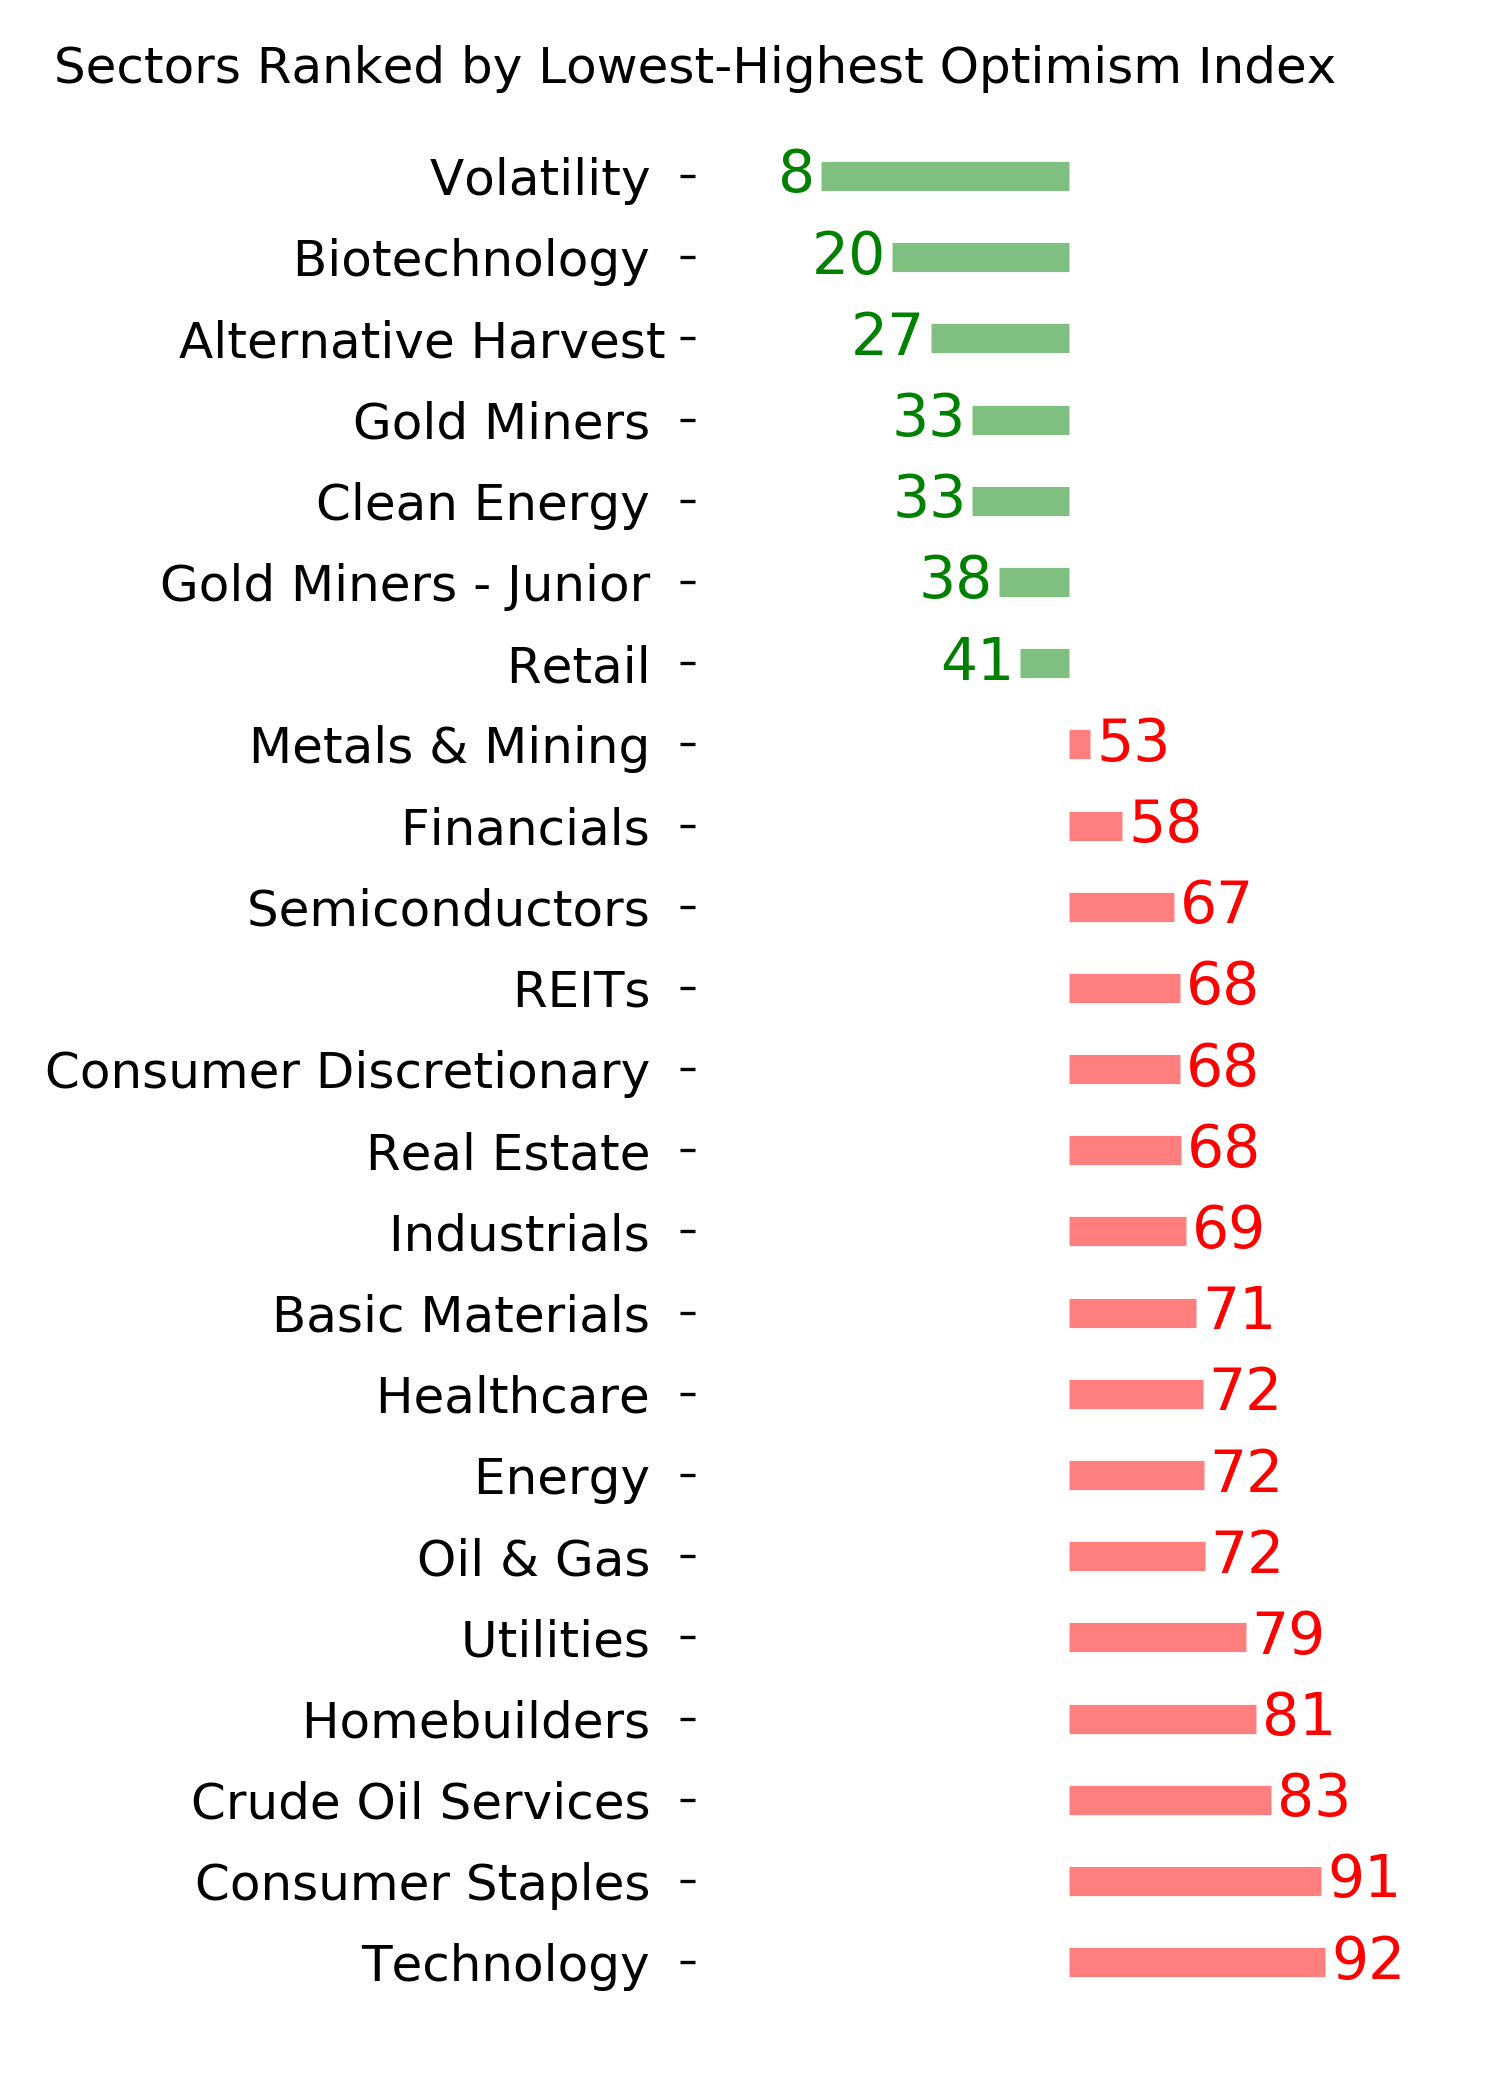
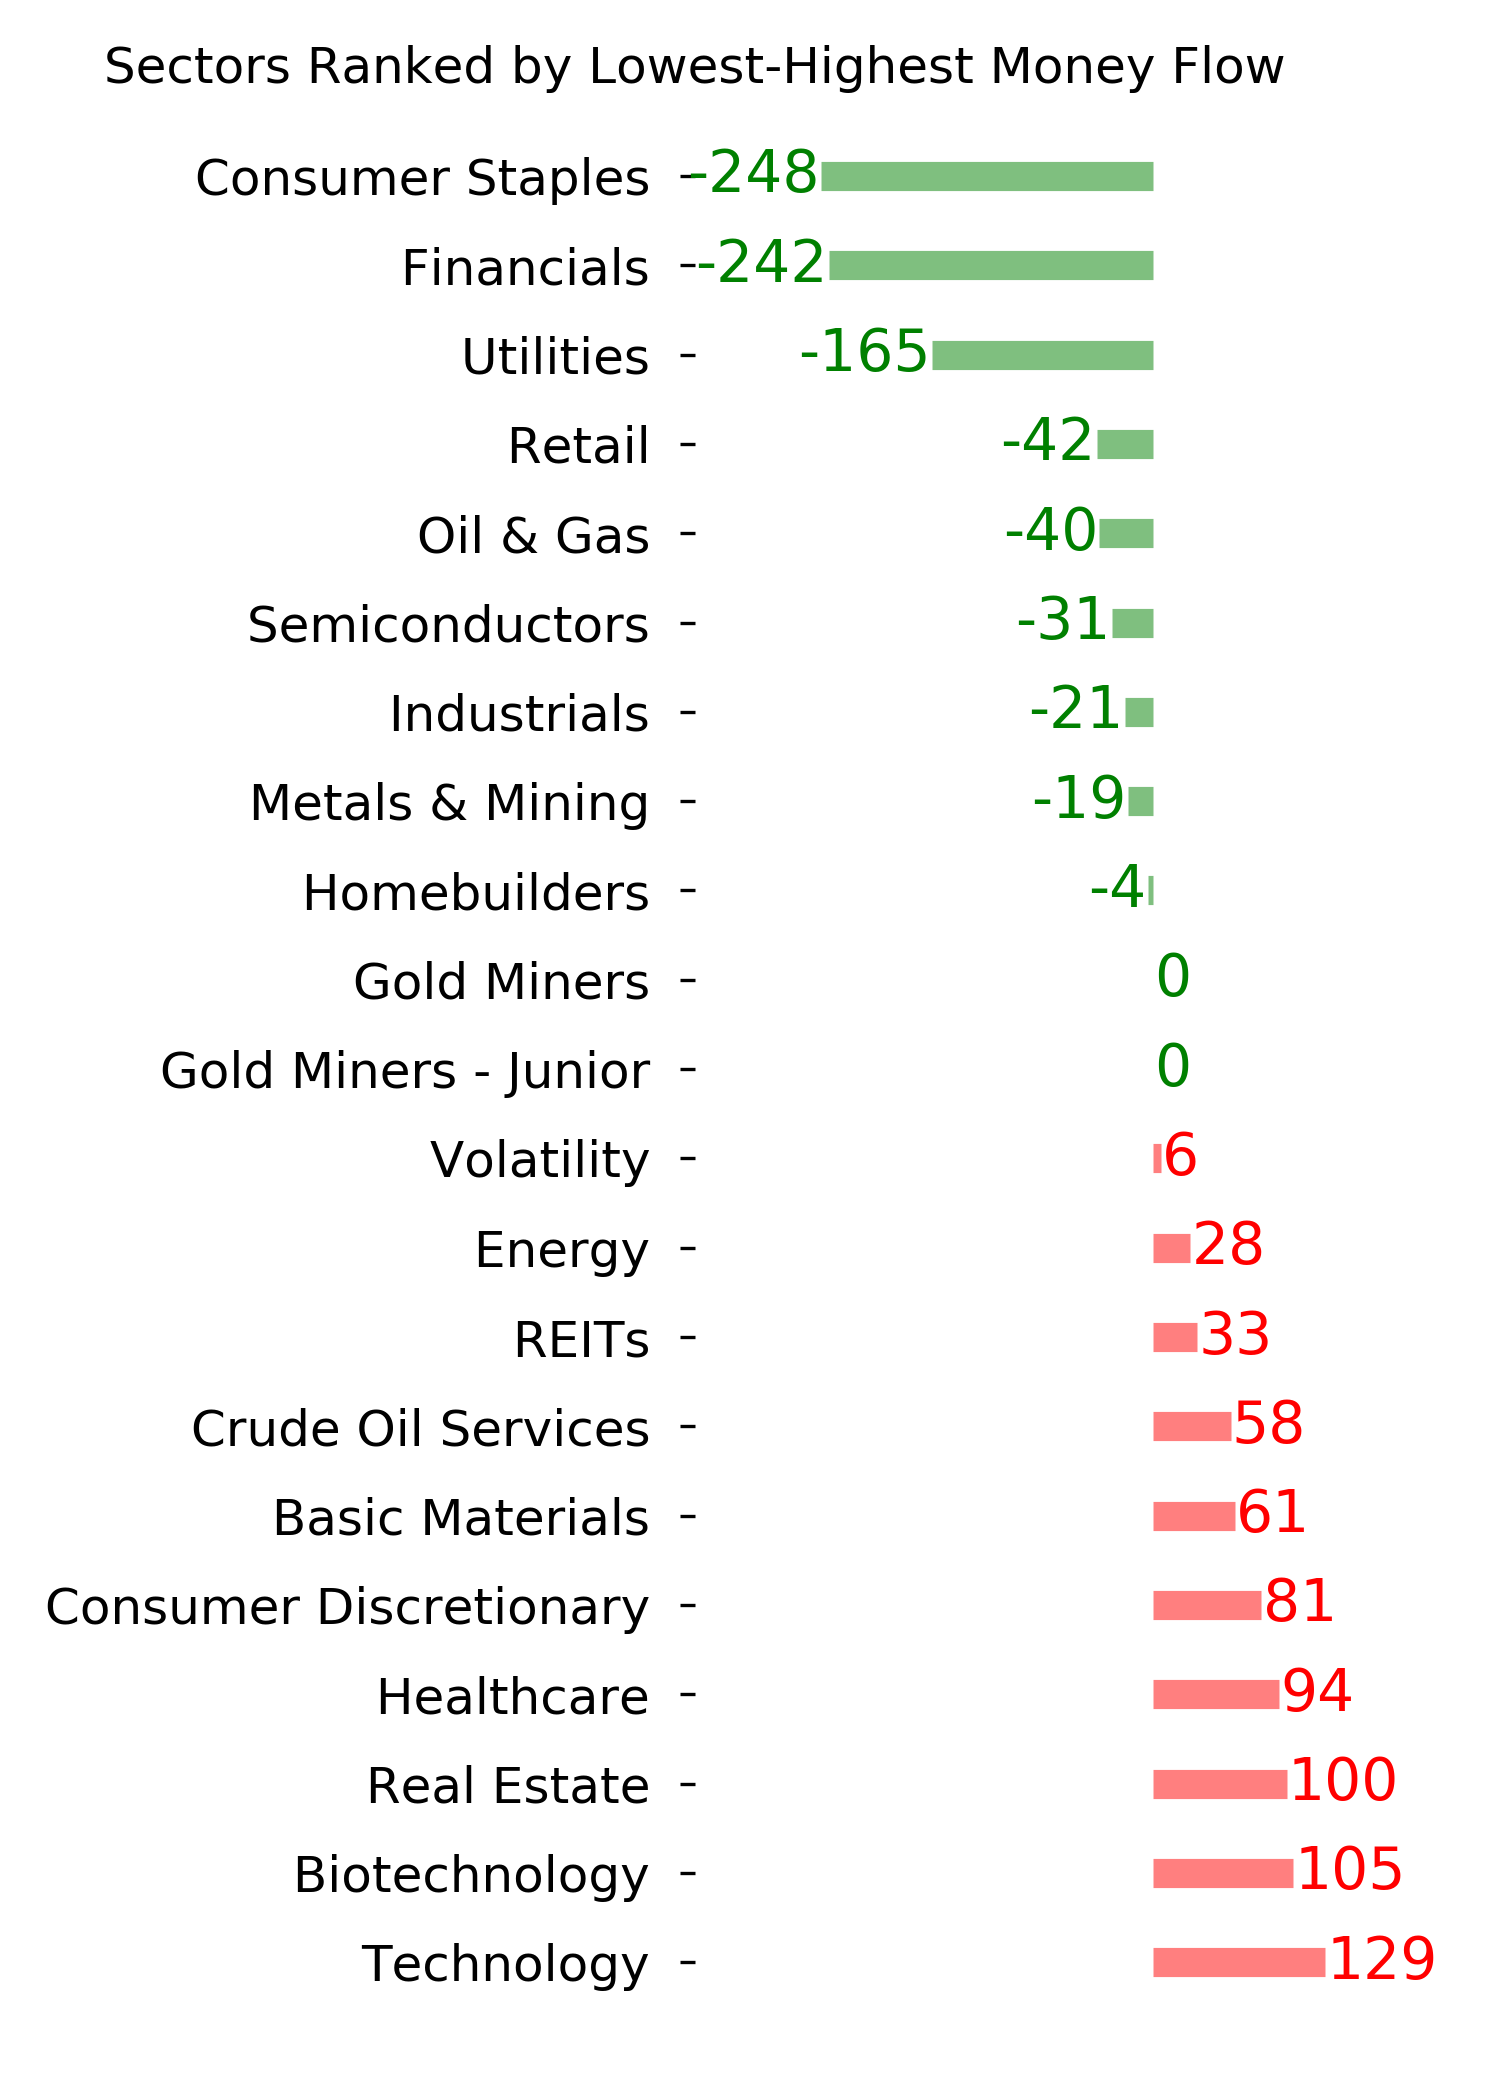
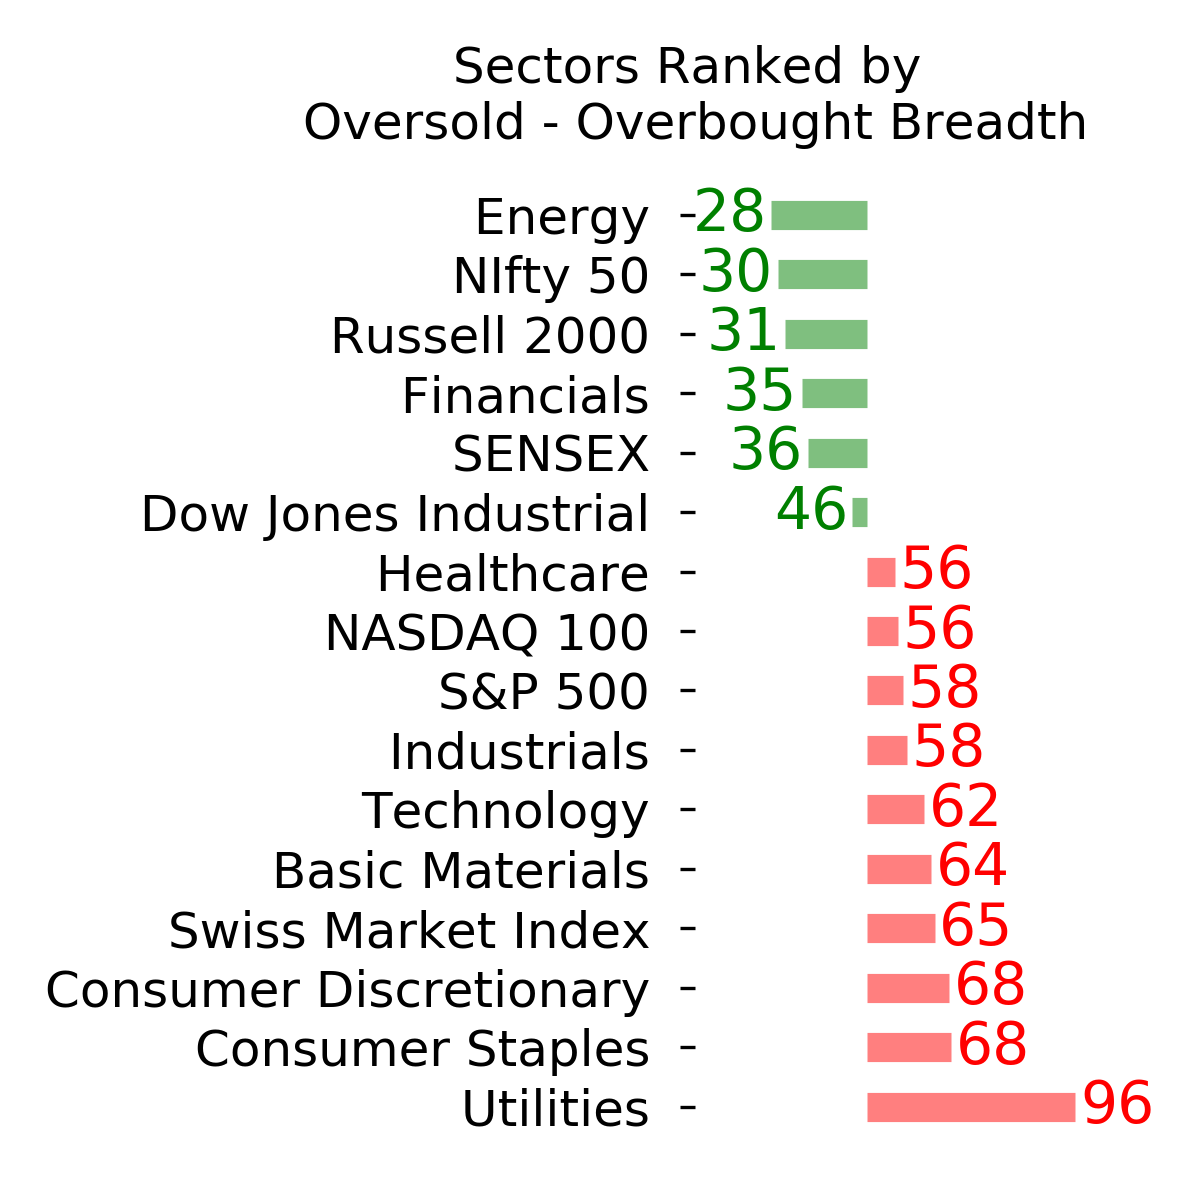
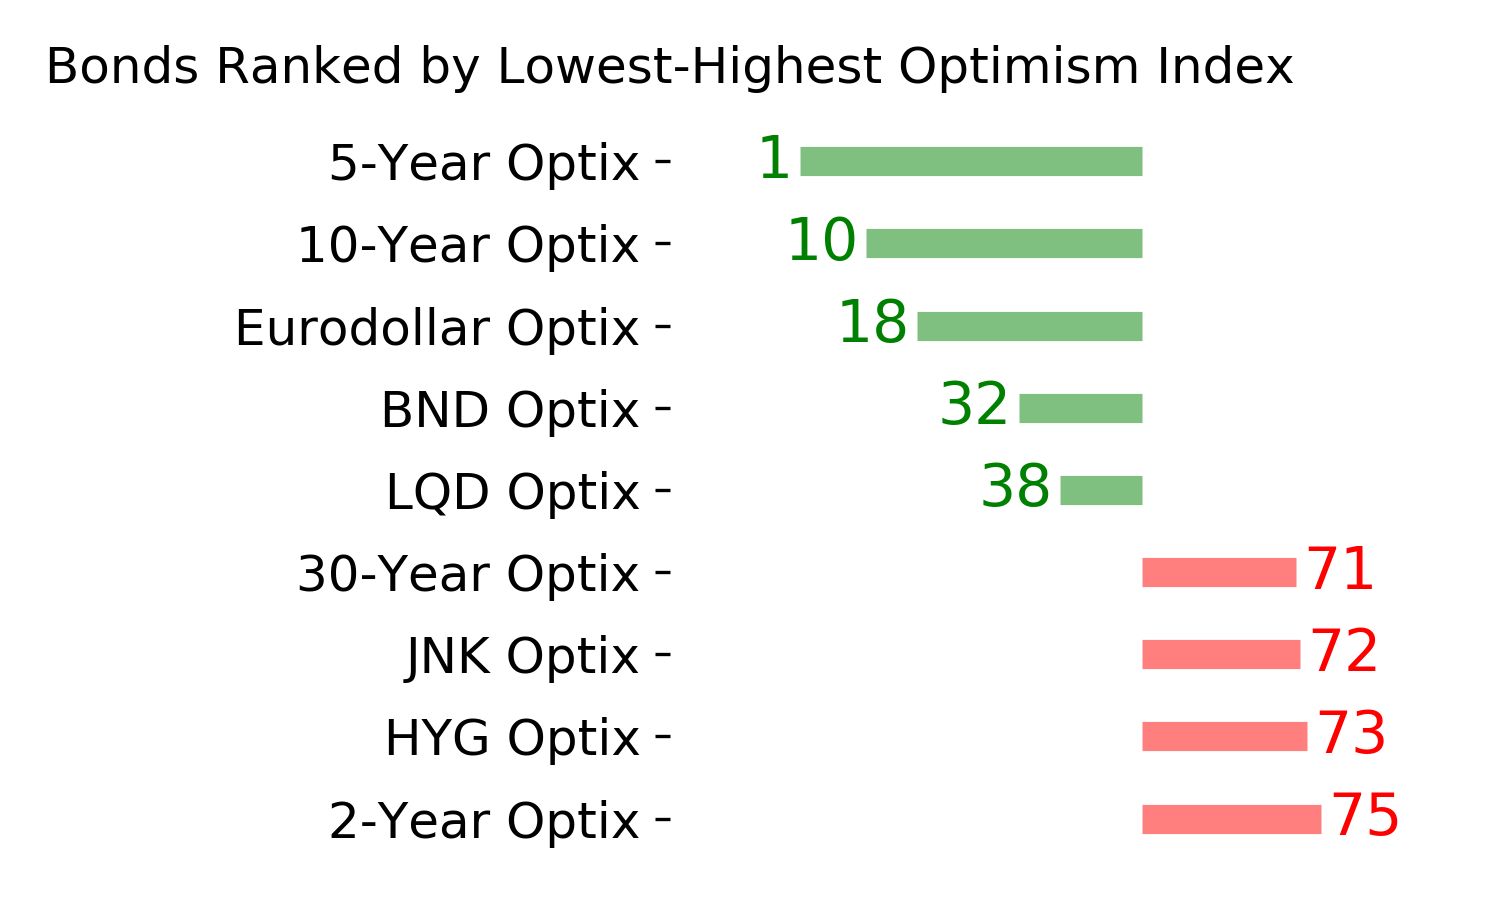
Ranks
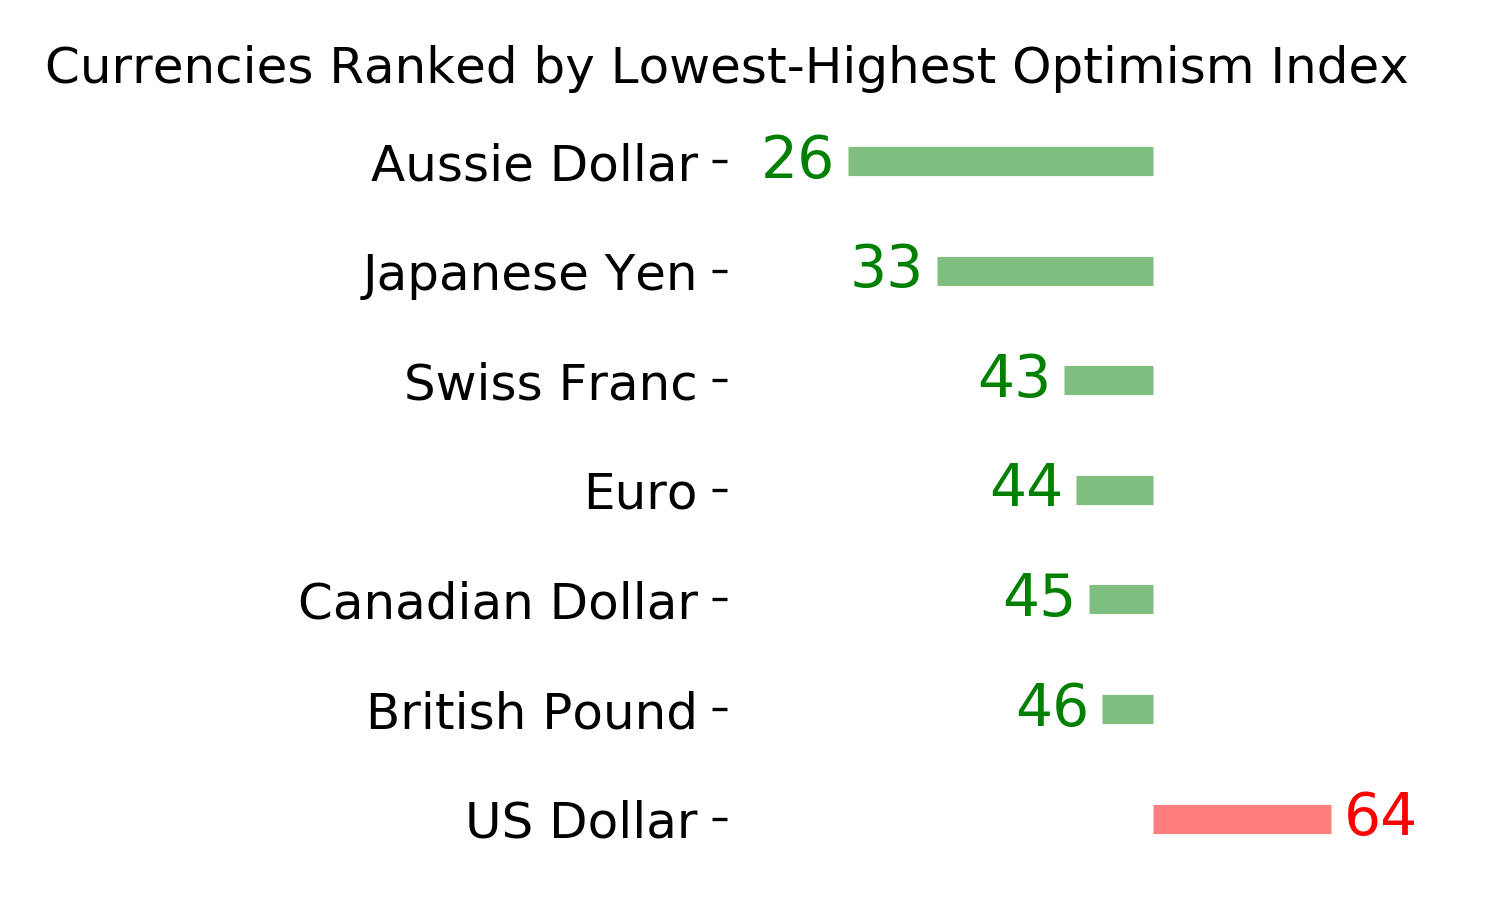
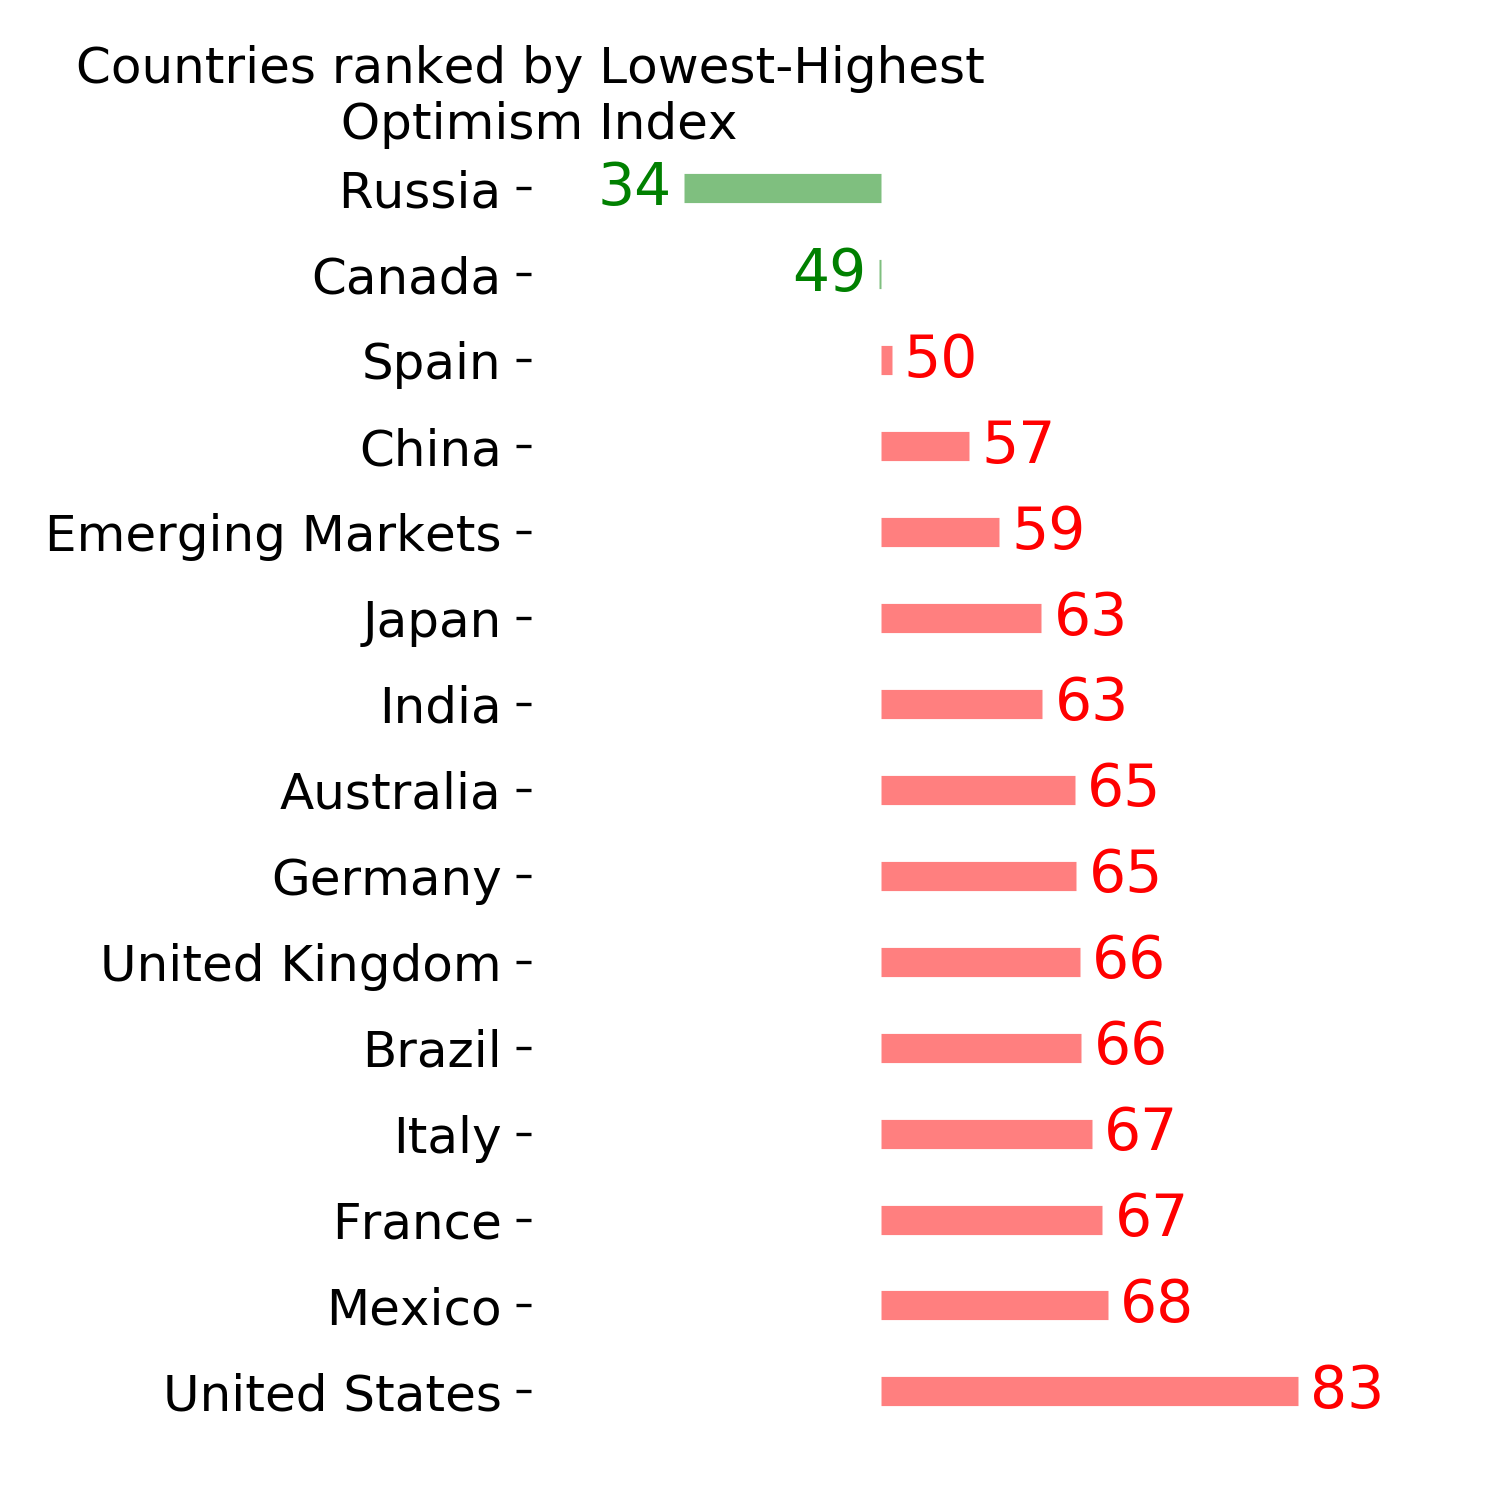
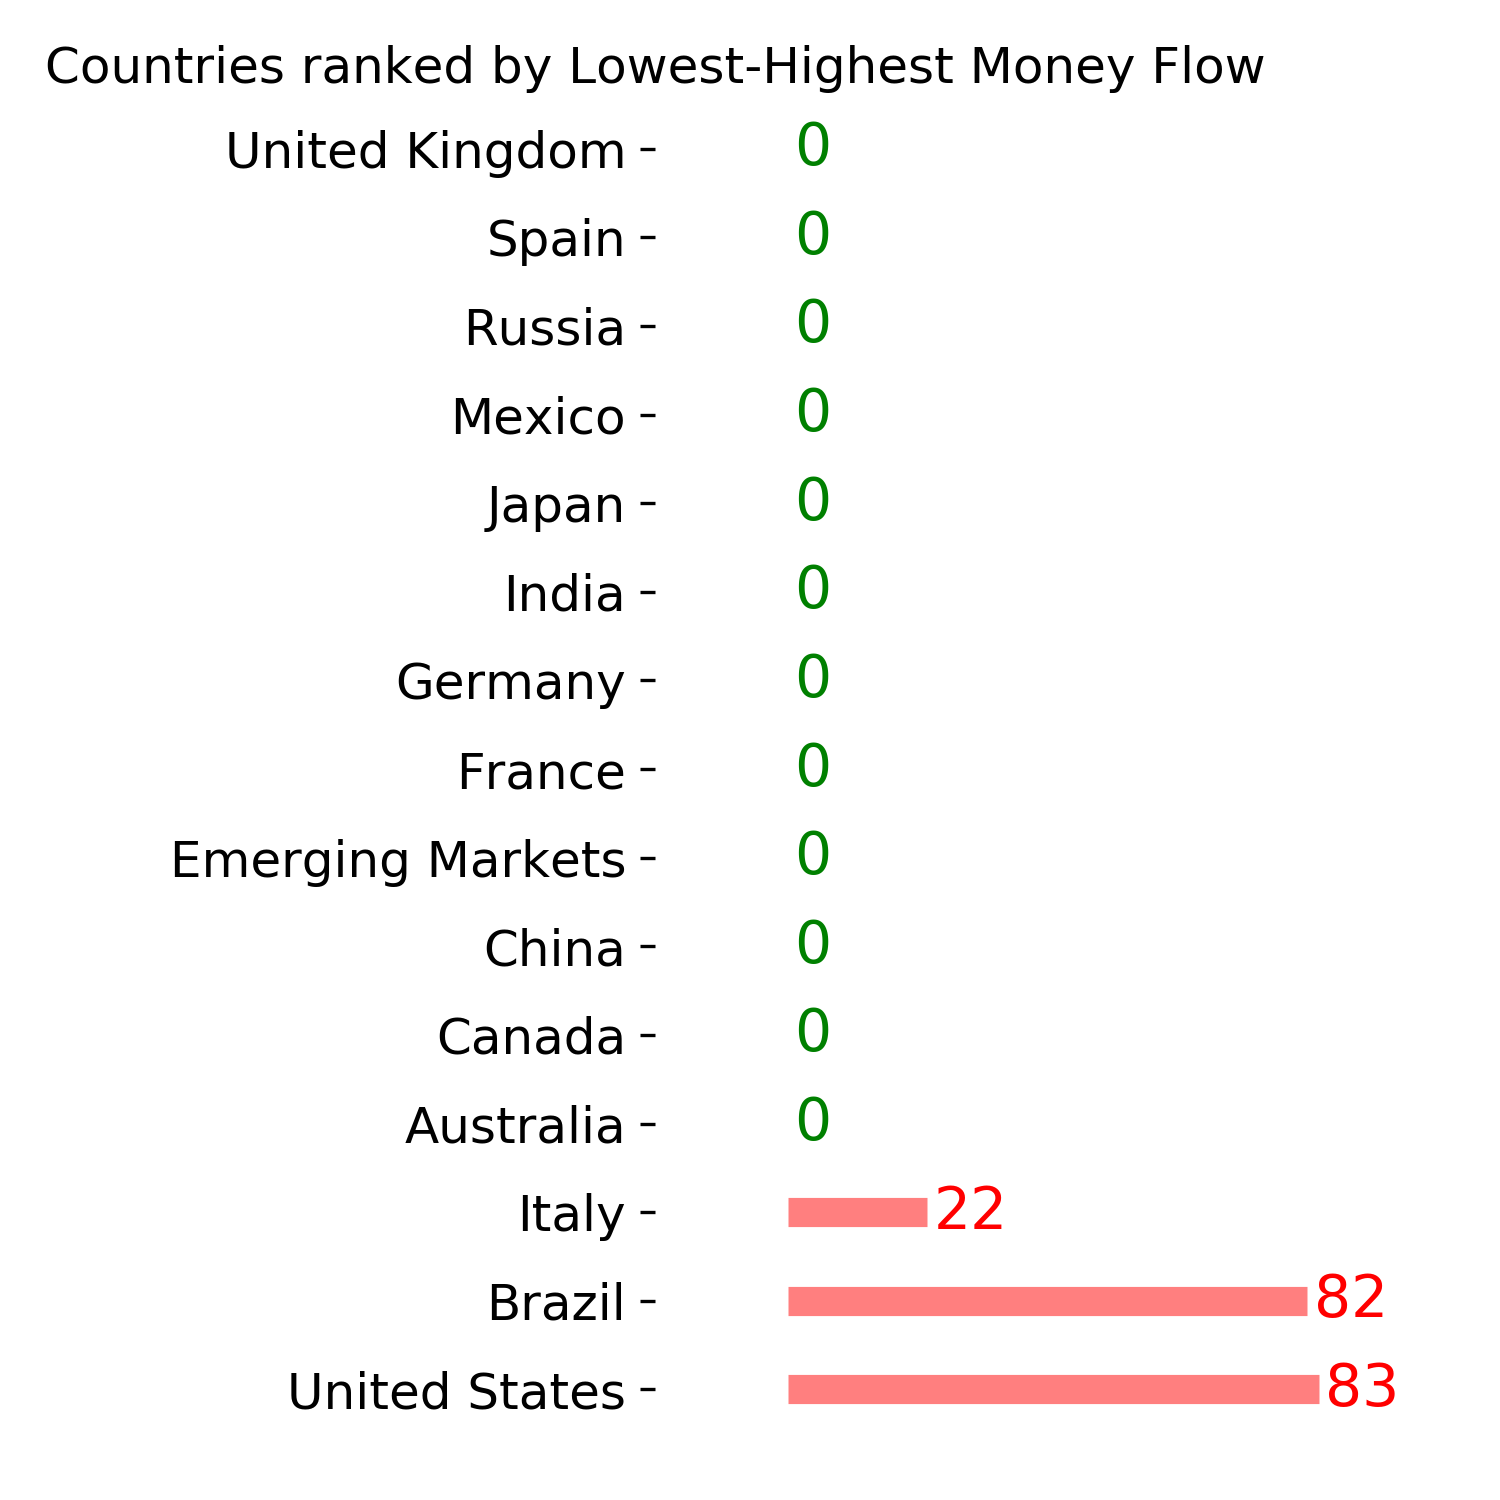
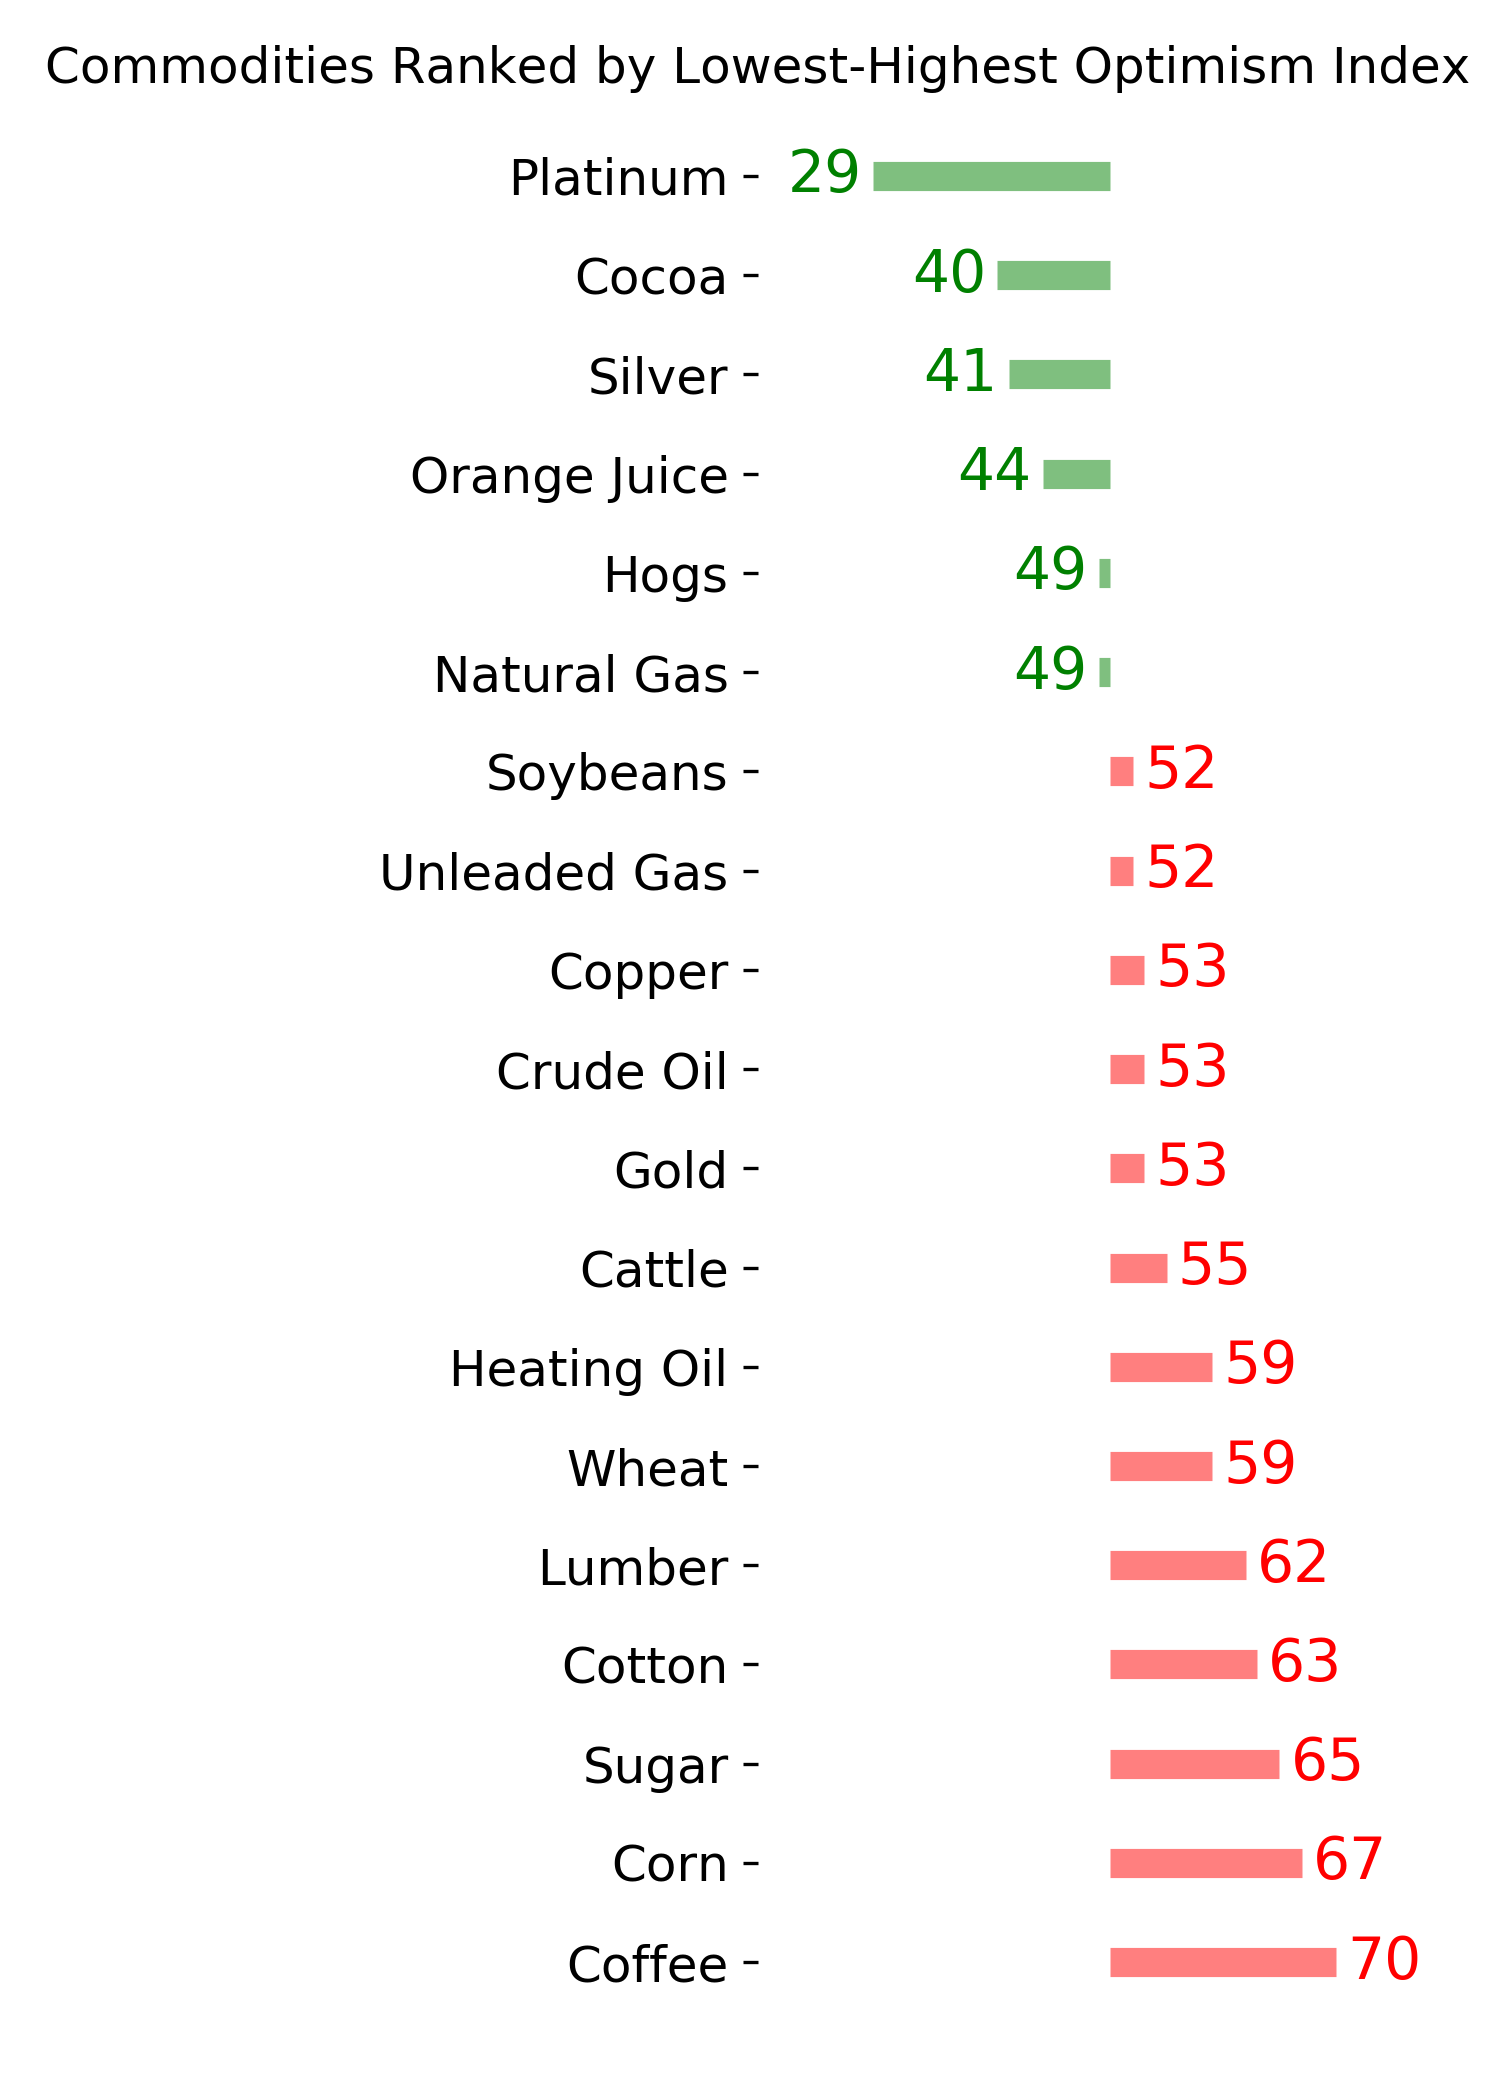
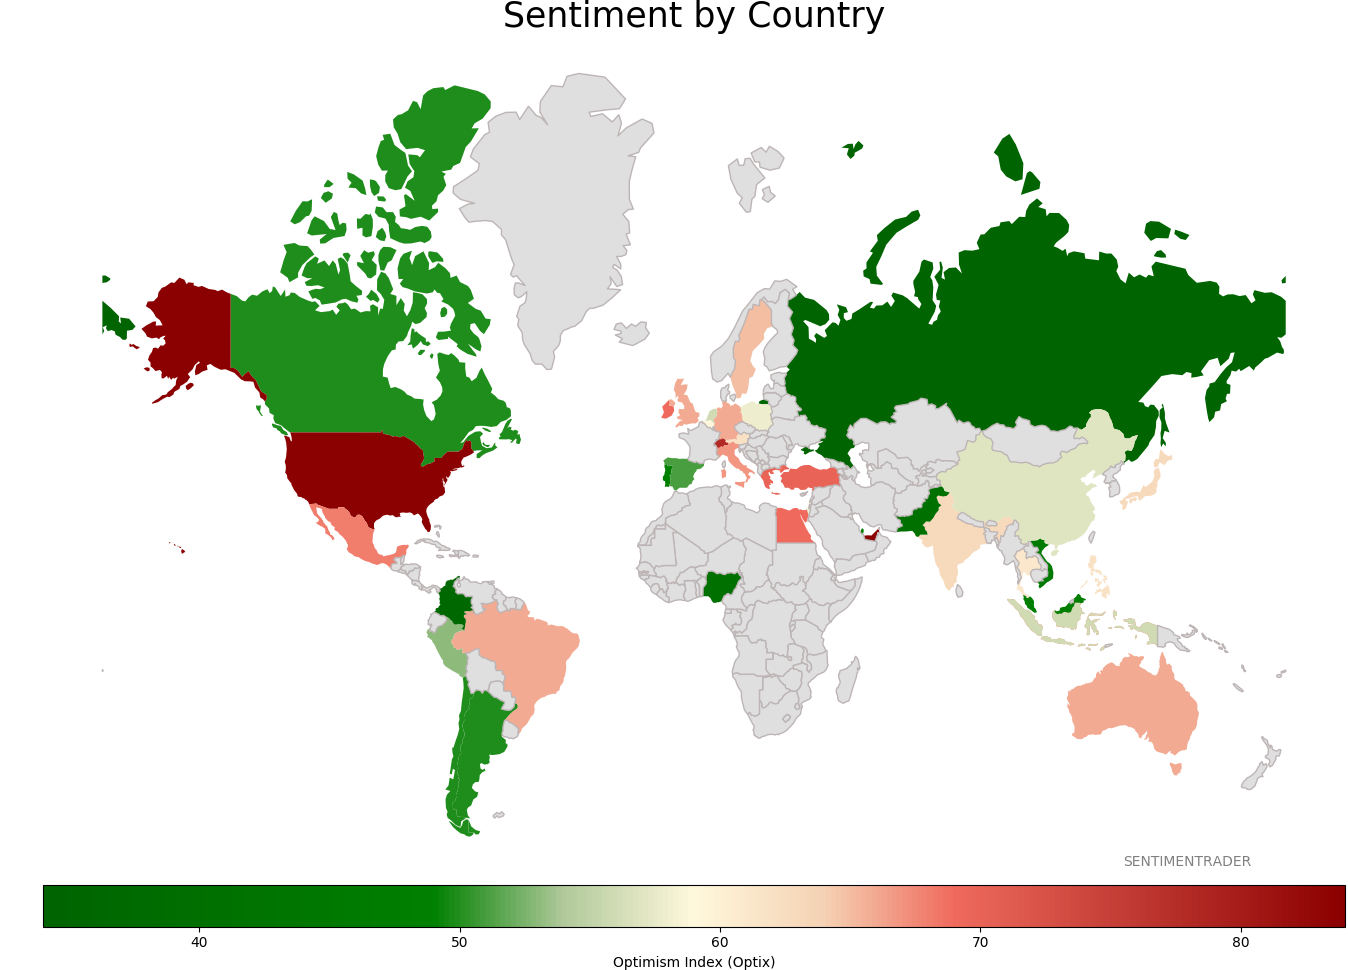
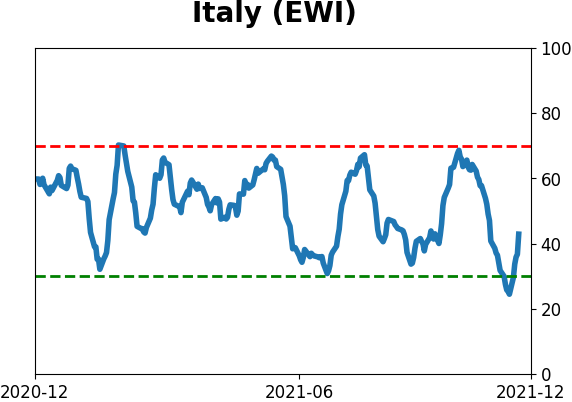
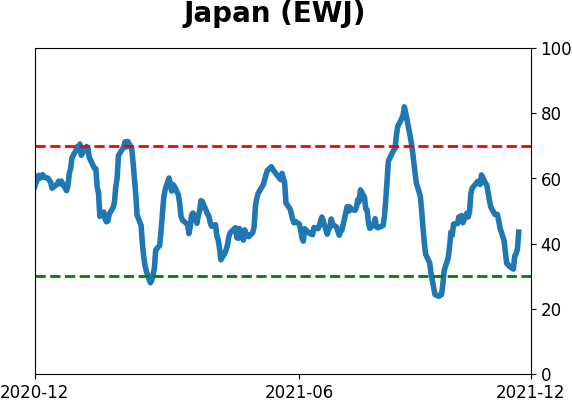
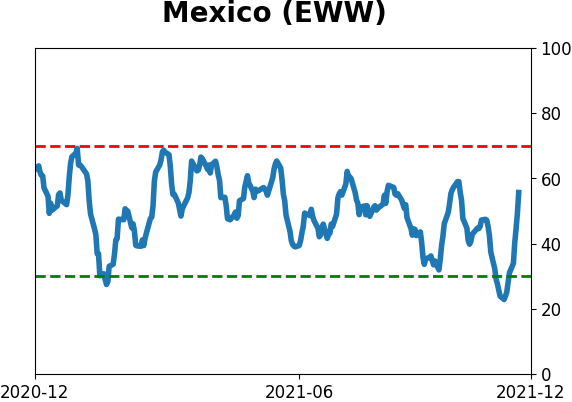
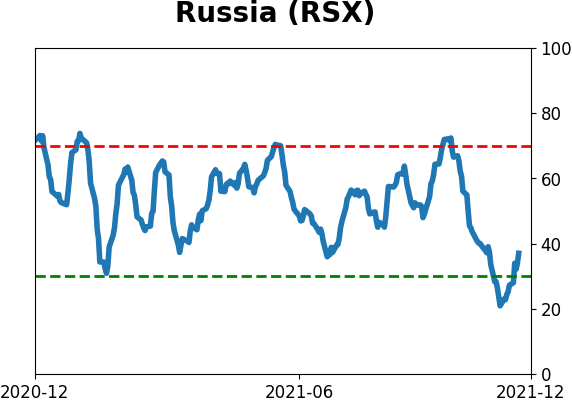
Sentiment Around The World
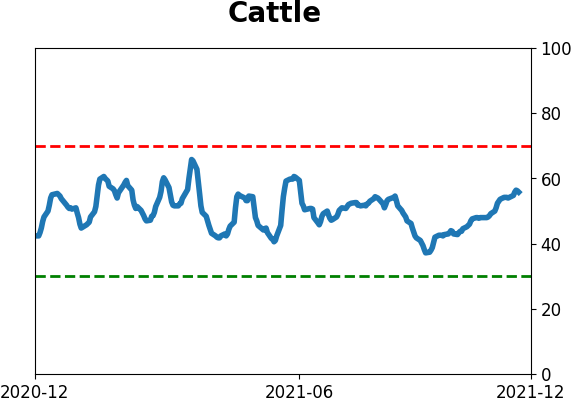
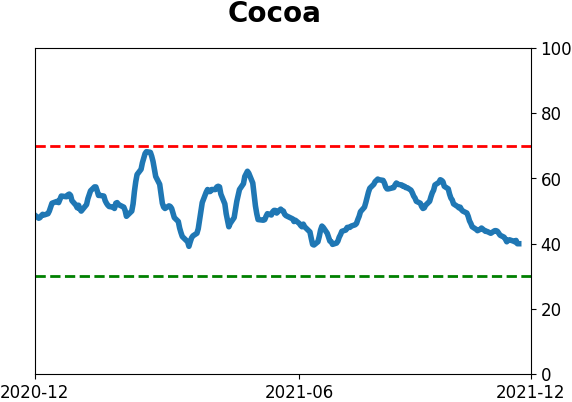
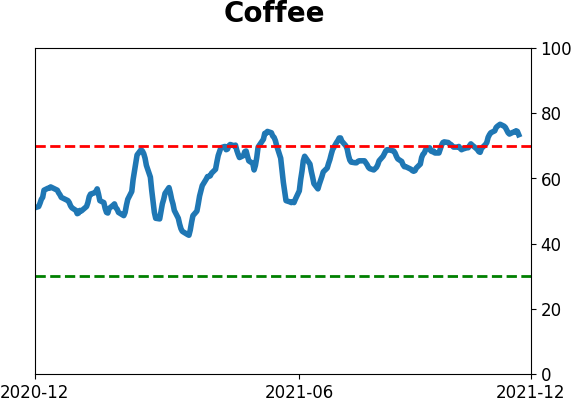
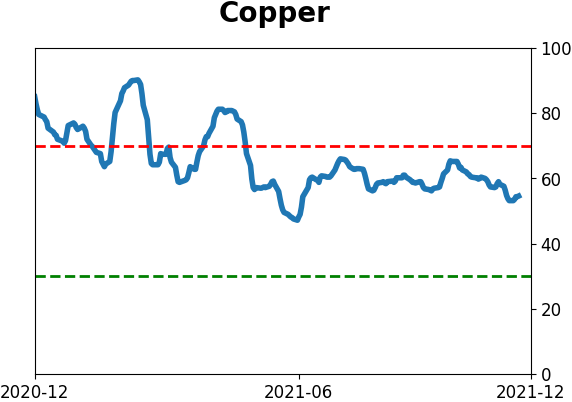
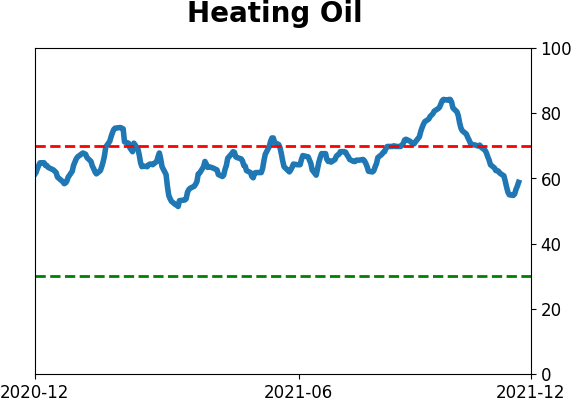
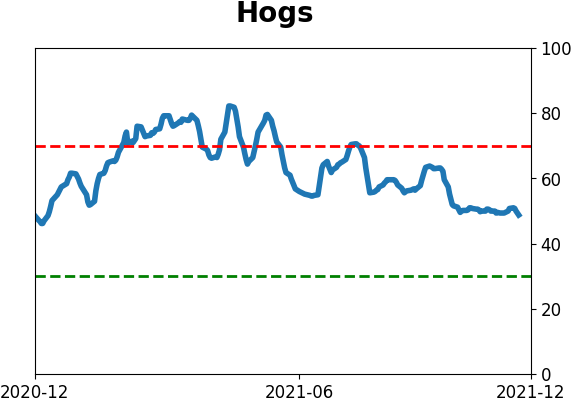
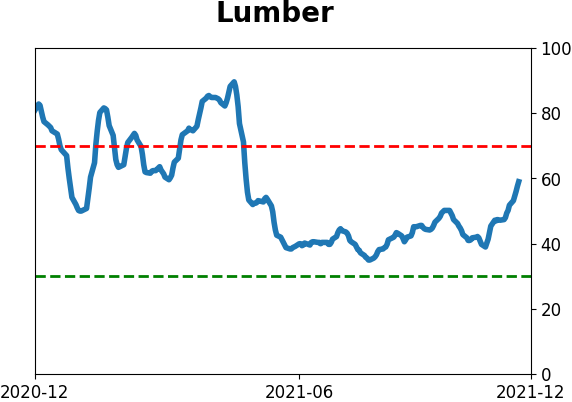
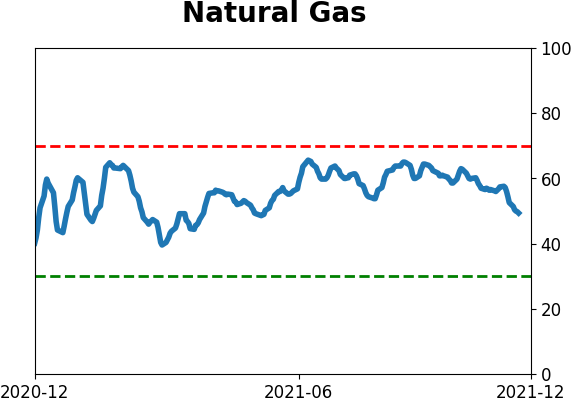
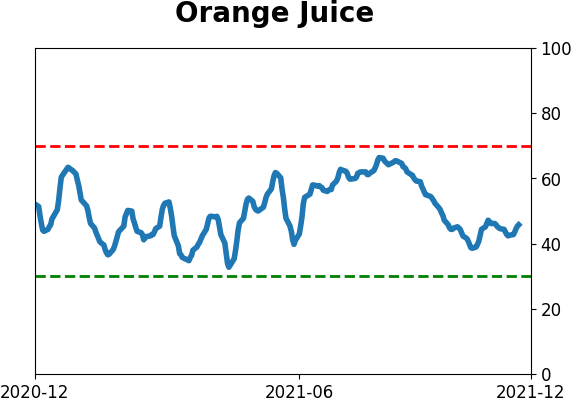
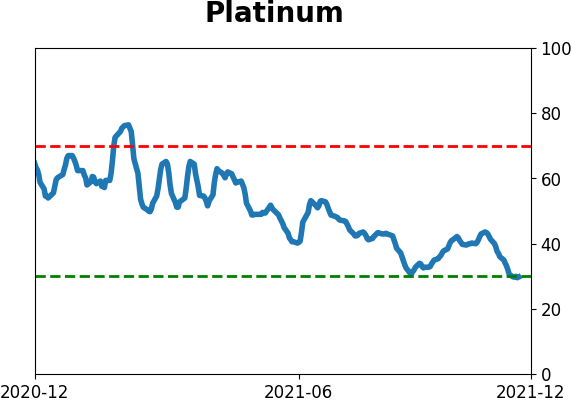
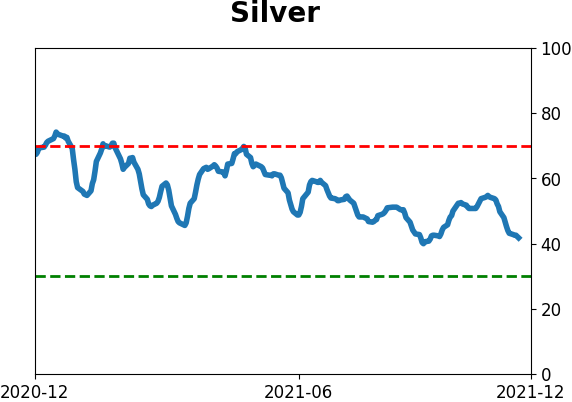
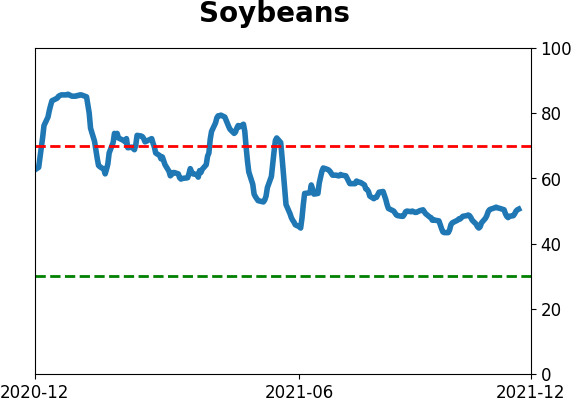
Optimism Index Thumbnails
|
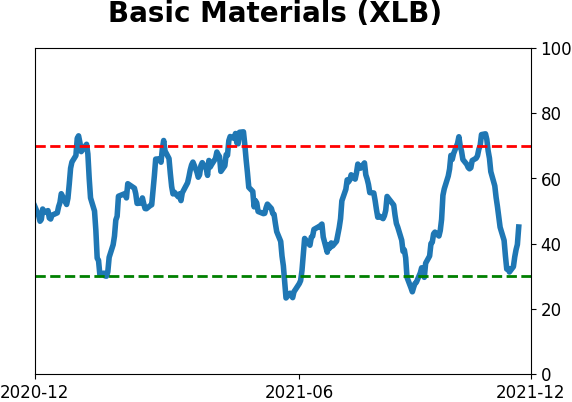
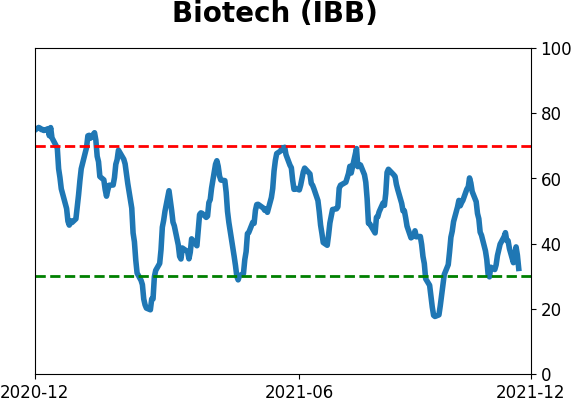
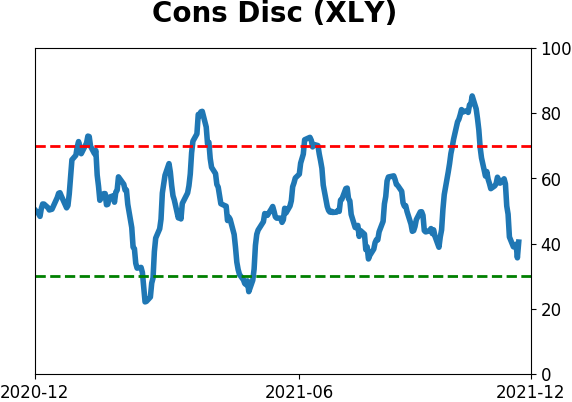
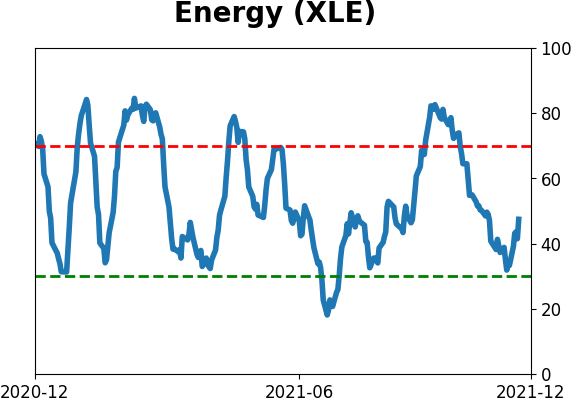
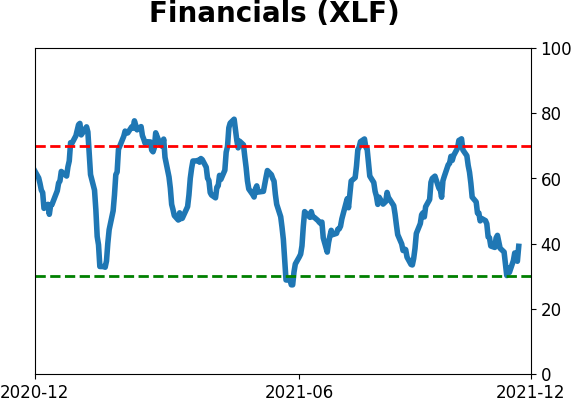
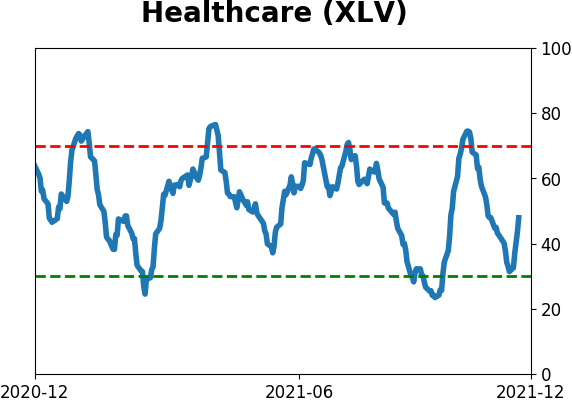
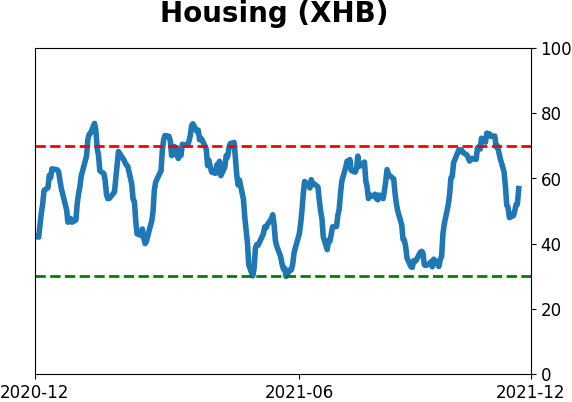
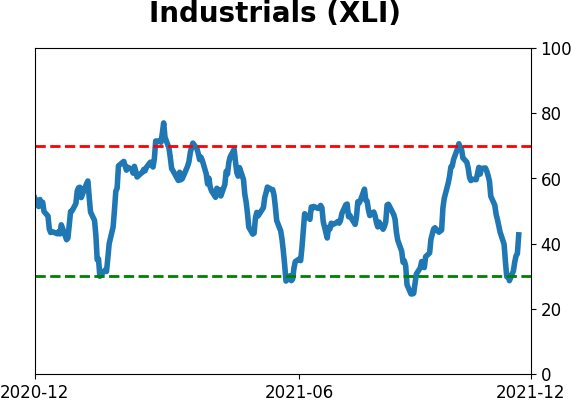
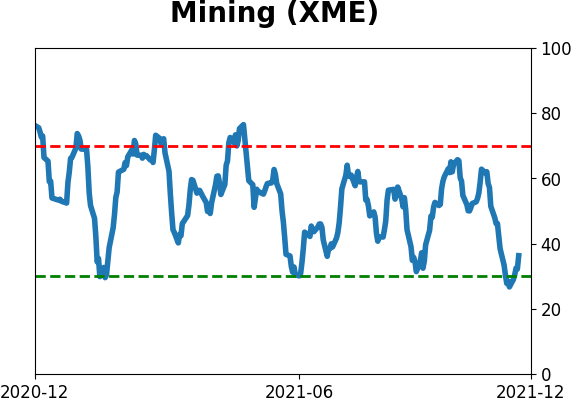
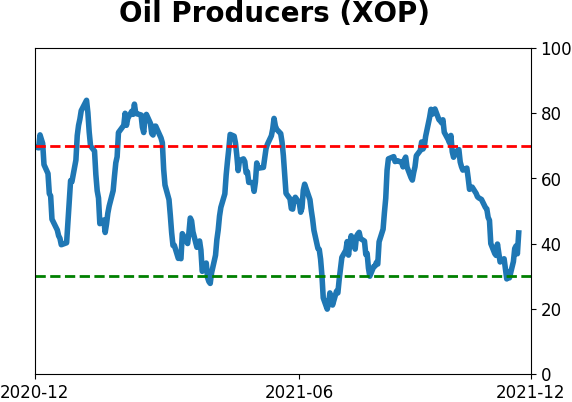
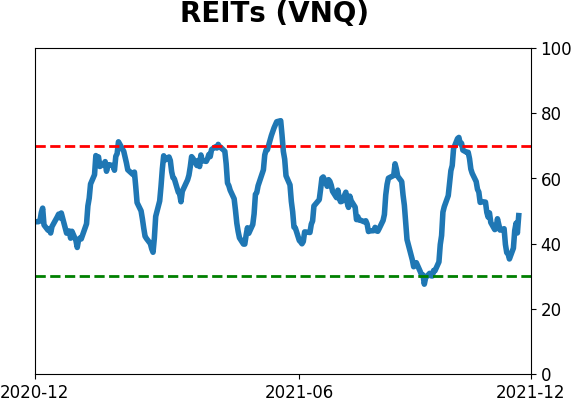
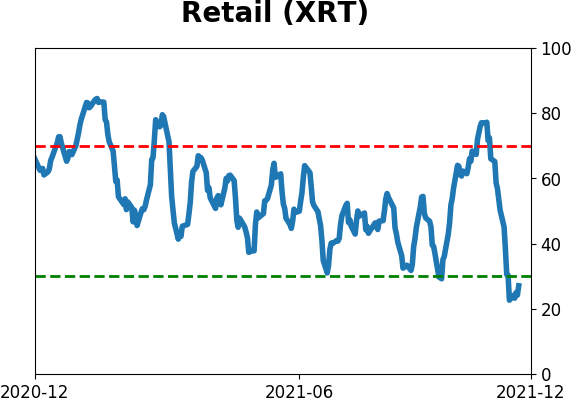
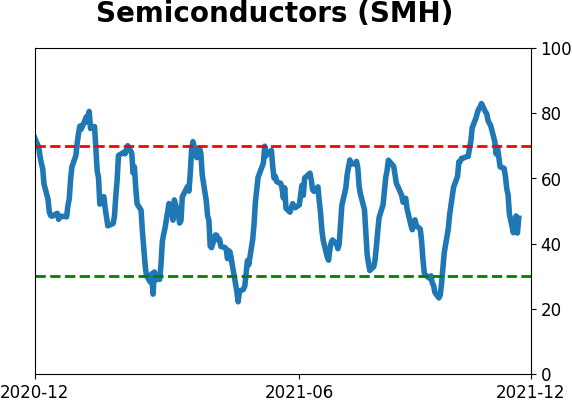
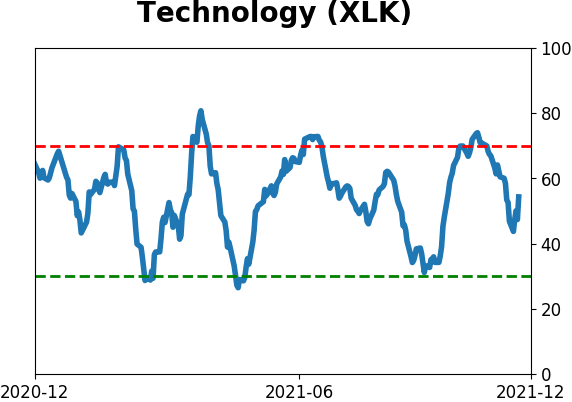
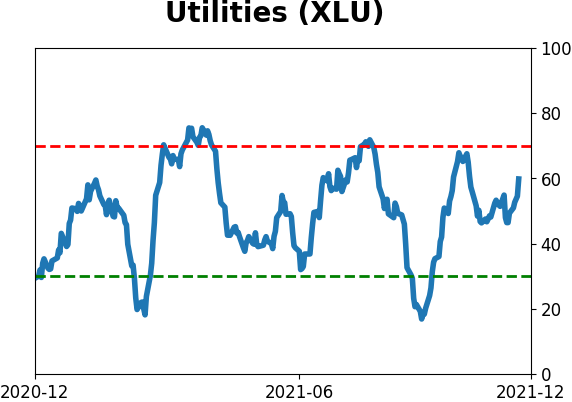
Sector ETF's - 10-Day Moving Average
|
|
|
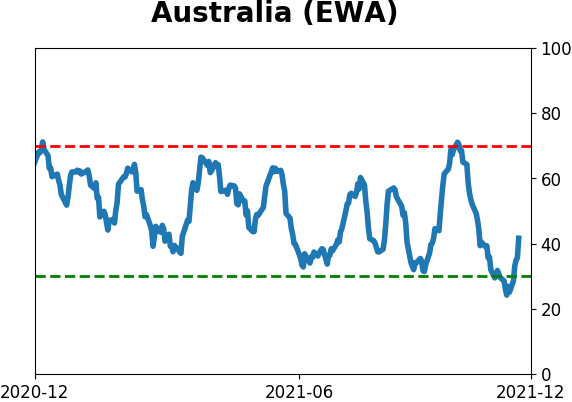
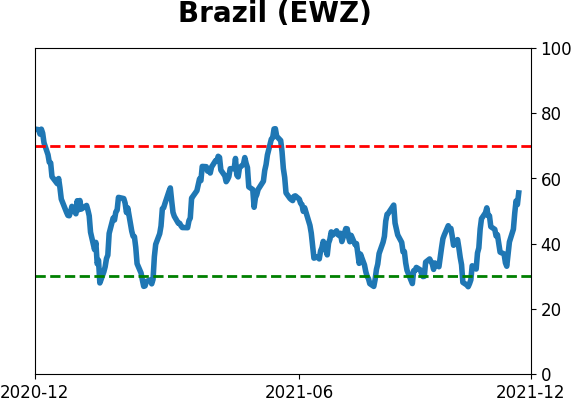
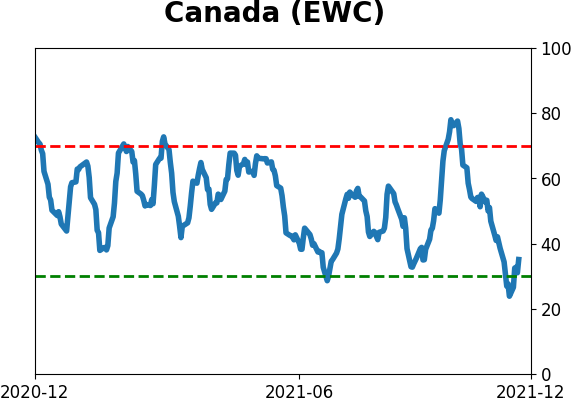
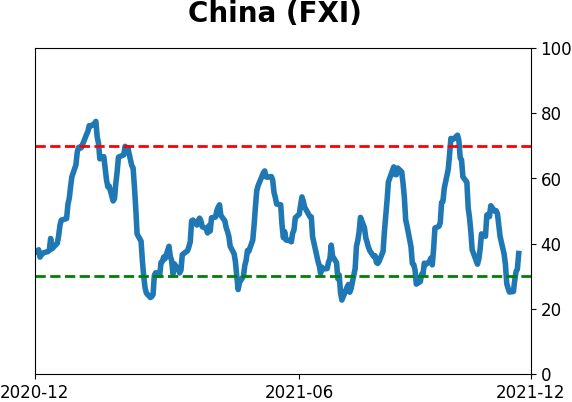
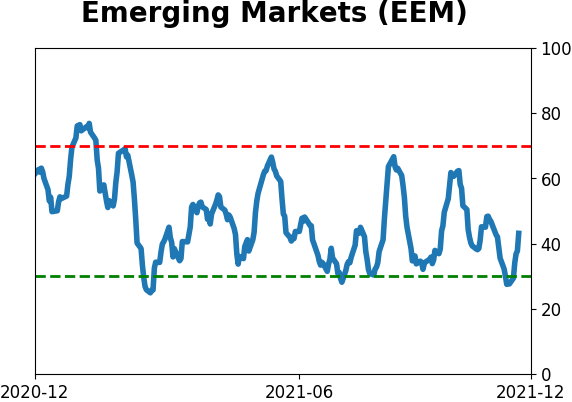
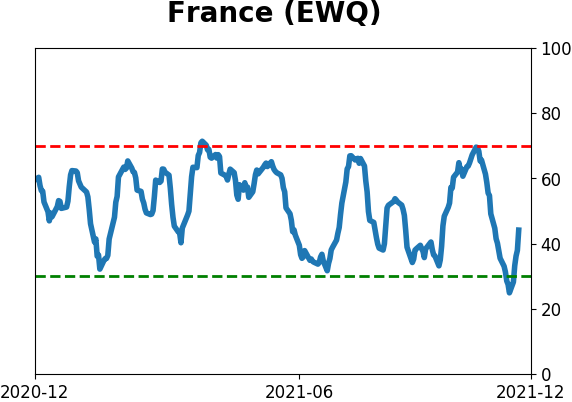
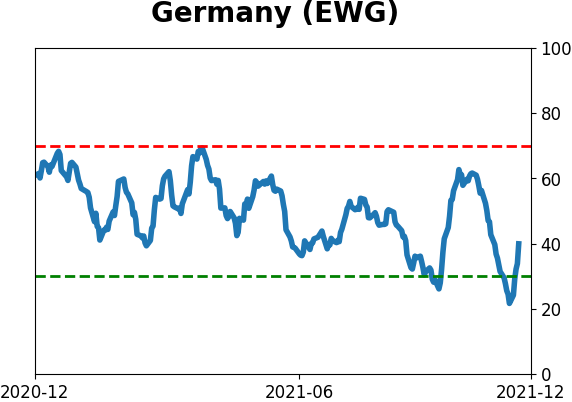
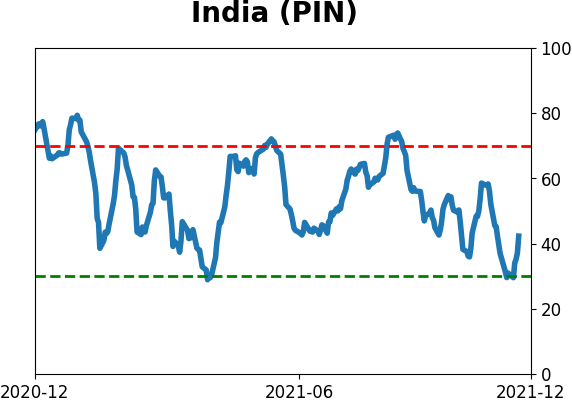
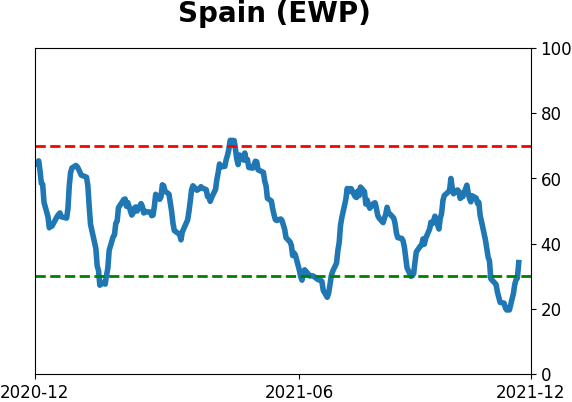
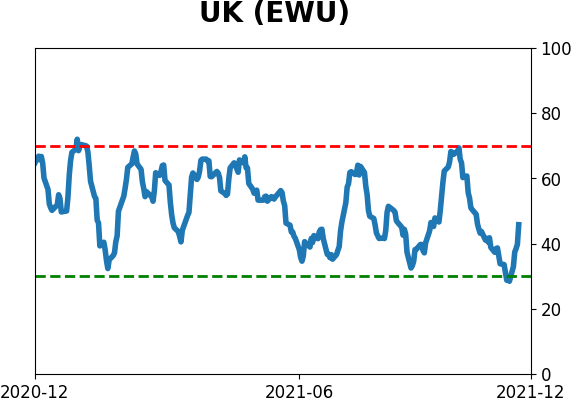
Country ETF's - 10-Day Moving Average
|
|
|
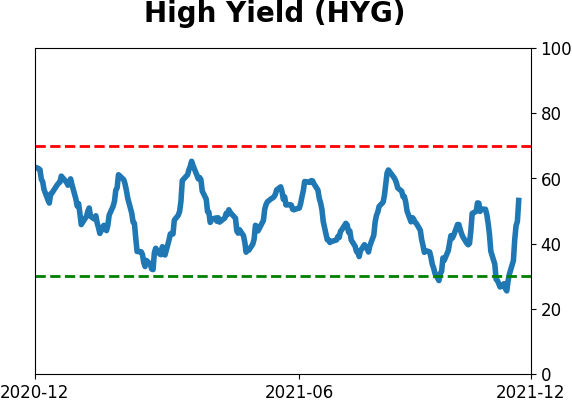
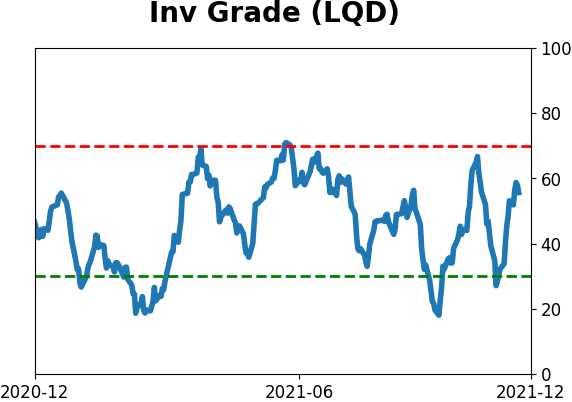
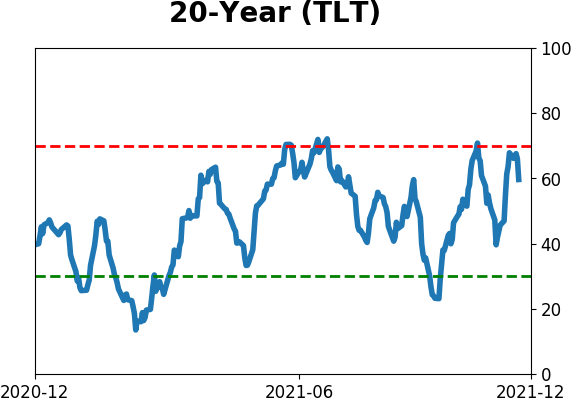
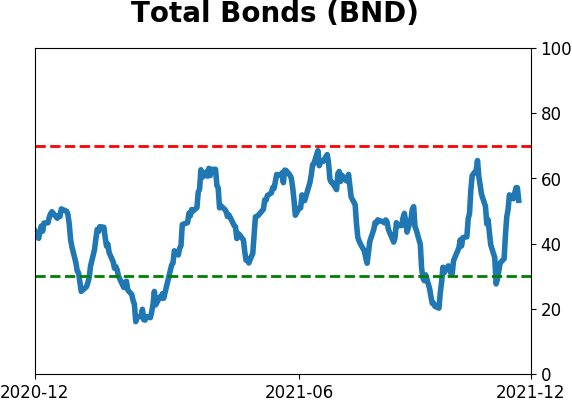
Bond ETF's - 10-Day Moving Average
|
|
|
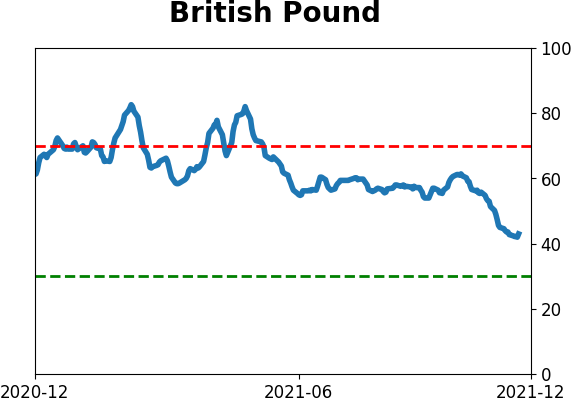
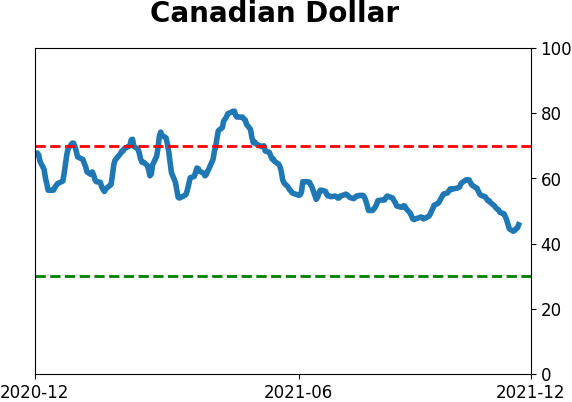
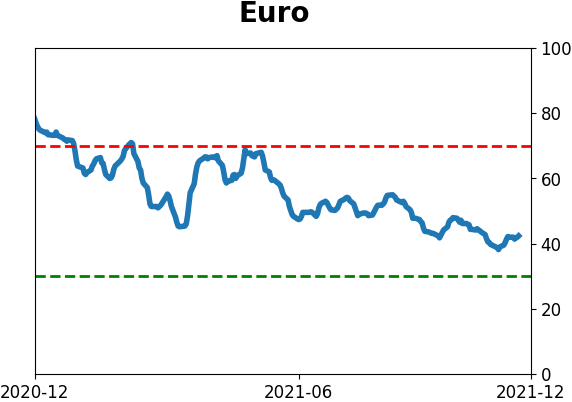
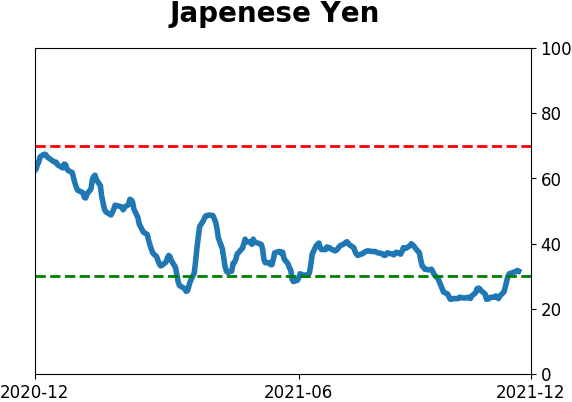
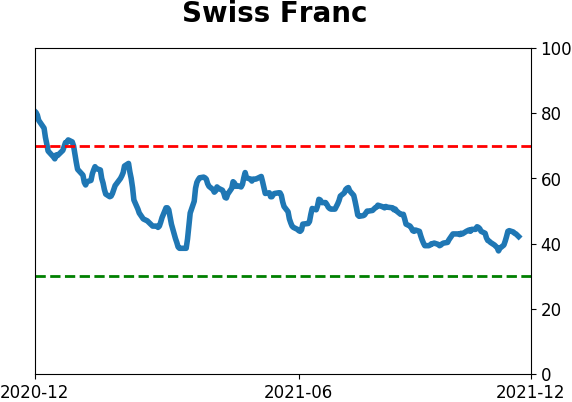
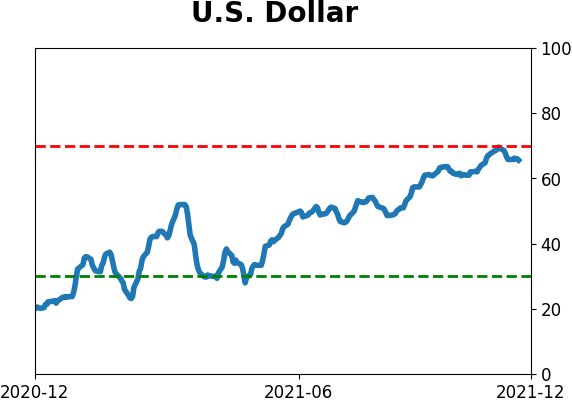
Currency ETF's - 5-Day Moving Average
|
|
|
Commodity ETF's - 5-Day Moving Average
|
|