Daily Report : TradingEdge Weekly for Dec 9 - More thrusts, losses retraced, Wall Street sentiment, Santa Rallies

| View/Print a PDF version of this Report |
Headlines
|
TradingEdge Weekly for Dec 9 - More thrusts, losses retraced, Wall Street sentiment, Santa Rallies: This week, we saw that stocks had continued to rally despite relatively high optimism. That has helped trigger more buying thrusts, and the Dow Industrials retraced more than 70% of its decline. Even so, Wall Street strategists and analysts are pessimistic. Chinese tech stocks surged again. Corn and gold miners usually enjoy a Santa Rally. |
Smart / Dumb Money Confidence
|
|
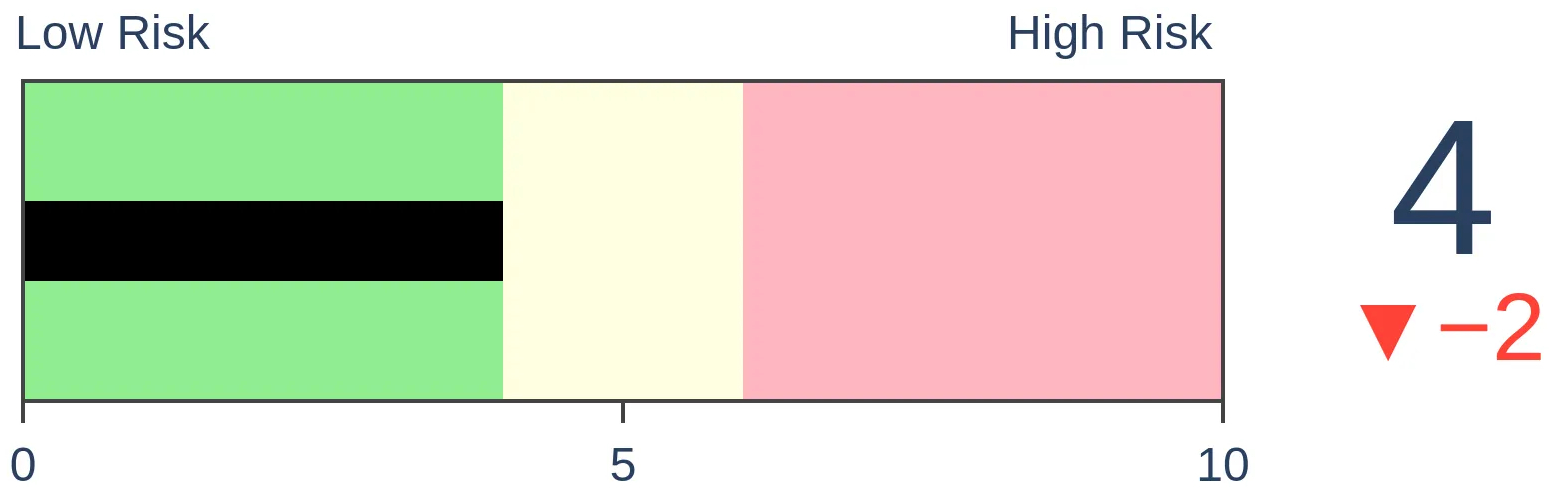
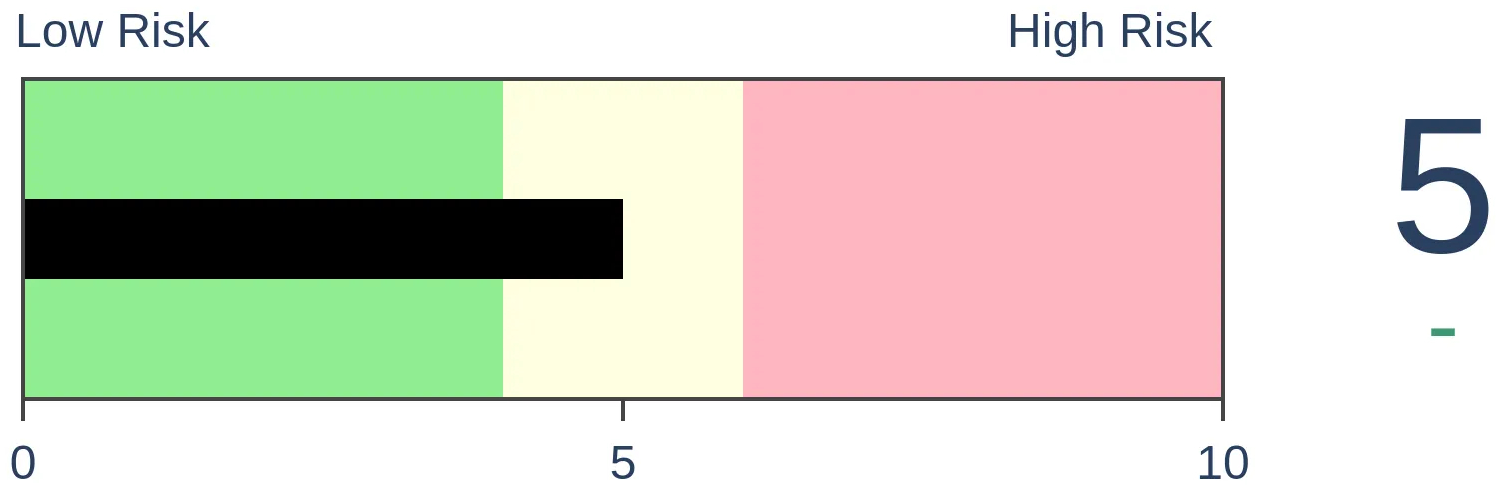
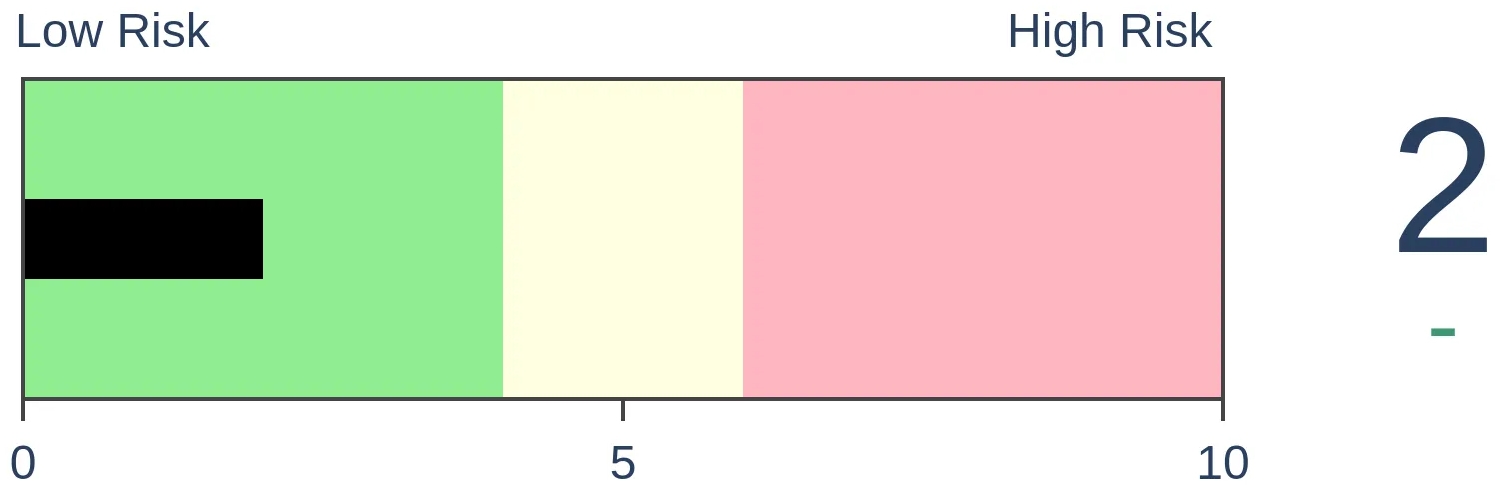
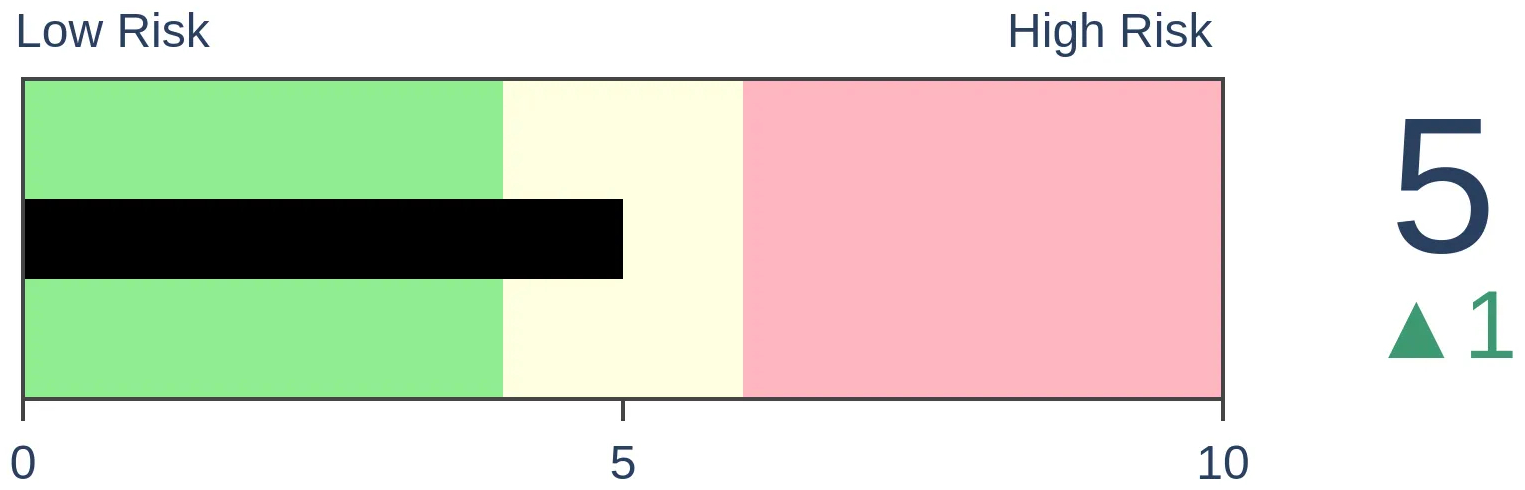
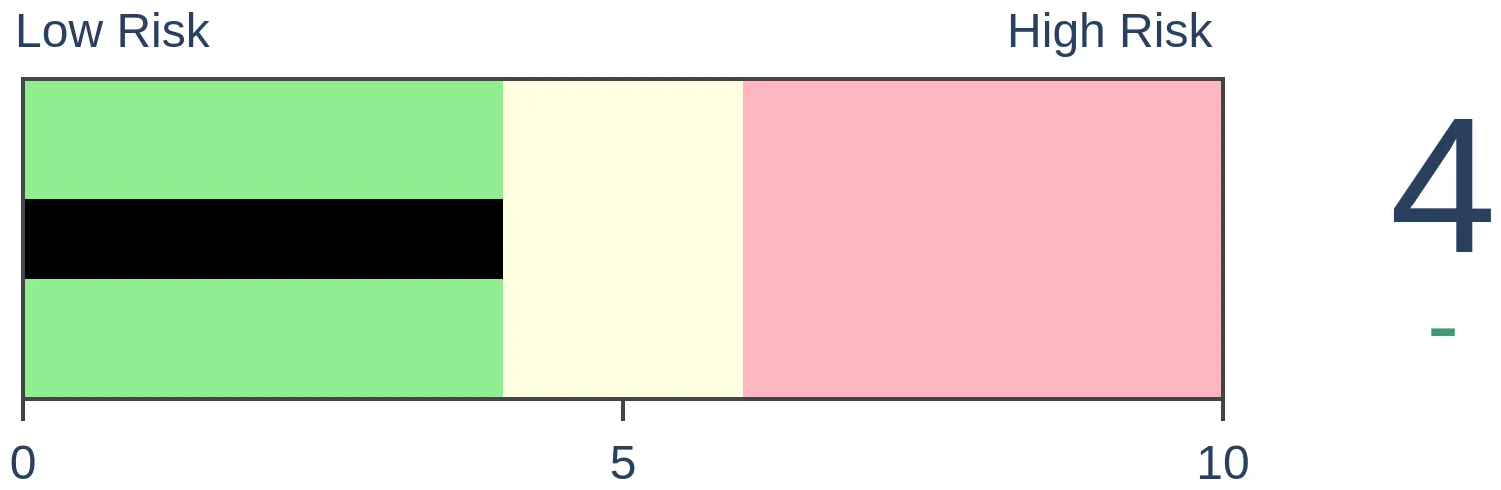
Risk Levels
|

|
|
Research
TradingEdge Weekly for Dec 9 - More thrusts, losses retraced, Wall Street sentiment, Santa RalliesBy Jason GoepfertBOTTOM LINEThis week, we saw that stocks had continued to rally despite relatively high optimism. That has helped trigger more buying thrusts, and the Dow Industrials retraced more than 70% of its decline. Even so, Wall Street strategists and analysts are pessimistic. Chinese tech stocks surged again. Corn and gold miners usually enjoy a Santa Rally. FORECAST / TIMEFRAME |
Key points:
- As stocks rallied in recent weeks, Dumb Money Confidence hit a high level
- There are increasing signs of buying thrusts, which have a good track record
- For the Dow Industrials, those thrusts helped it claw back 70% of its losses
- Even so, Wall Street isn't buying it, with low expectations for 2023
- Maybe Wall Street is paying too much attention to terrible economic data and surveys
- One thing that needs to change is price action, with a technical sell signal
- Chinese technology stocks have surged anew
- Bullish factors for silver and a potential options trade
- Corn is about to enter the Santa Rally period
- So are gold mining stocks
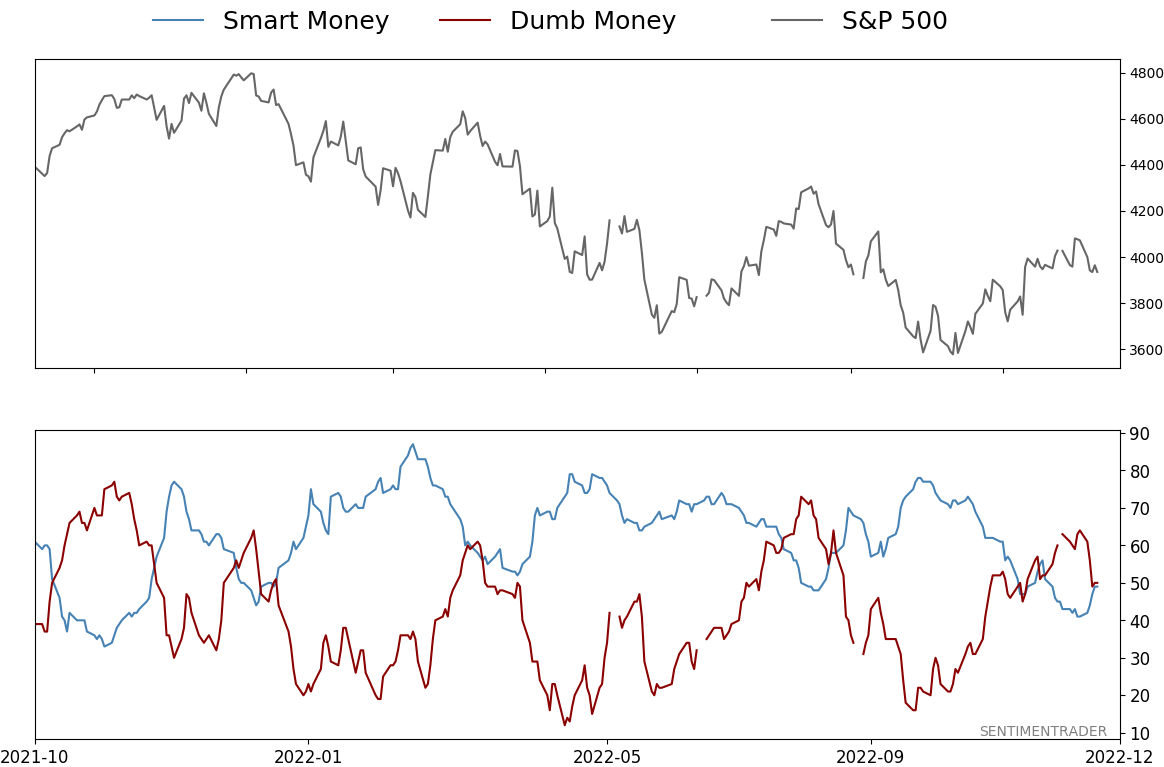
Stocks rallied, and Dumb Money jumped in
In mid-October, we saw that sentiment had reached one of its worst levels on record. Since then, sentiment has perked up thanks to a significant and broad-based advance, and Dumb Money Confidence in a further rally is high.
During protracted bear markets, investors typically don't get a chance to become too optimistic before reality slaps them in the face. That's already happened a few times during the current bear market. Pretty much as soon as Dumb Money Confidence reached 60%, the gains were about exhausted.
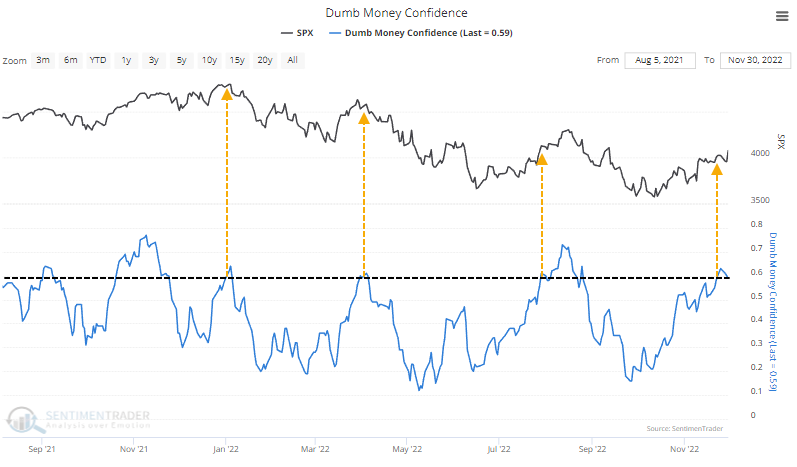
Not this time.
Dumb Money crossed 60% on November 23, and the S&P 500 rallied another 1.2% over the following week. In the week following similar behavior in April, the S&P lost 0.7%, and in August, it gained a modest 0.4%. When buyers continued to show up despite high Confidence, it was good for stocks in the months ahead. All the signals showed a gain over the next 1-3 months, though in 2001, it petered out soon after.
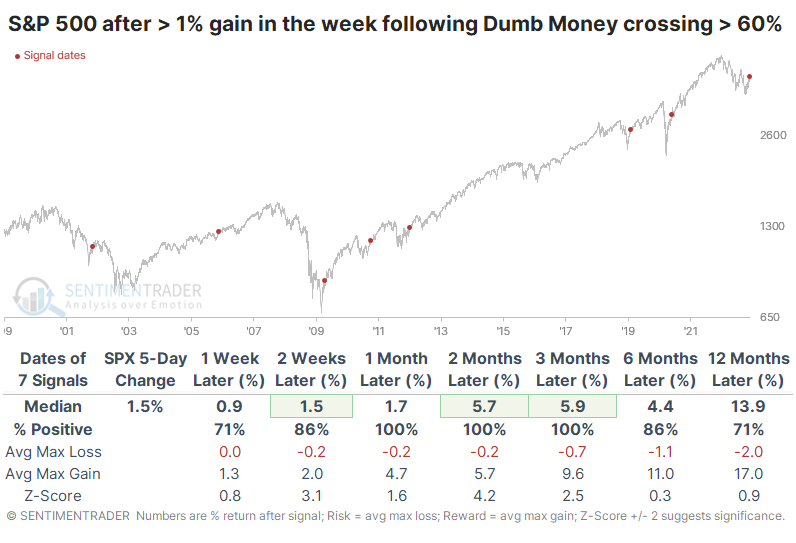
There were few drawdowns of note up to three months later, while gains tended to be robust. Over the next few months, the S&P never lost more than -3.4% while gaining at least +3.7% each time - and the average gain was much higher than that.
When the S&P gained less than 1% in the week following a Dumb Money cross above 60%, forward returns were suspect. Over the next three months, stocks tended to decline, including some major losses.
More signs of buying thrusts within a downtrend
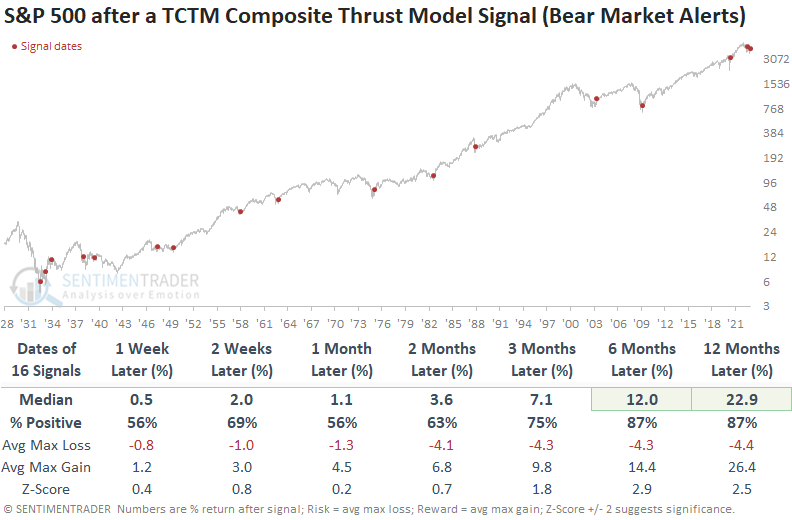
Breadth-based indicators, which comprise Dean's Composite Thrust Model, have been strong since the low in October. With newfound participation from stocks after a Composite Washout Model signal, the CTM triggered a new alert at the end of November.
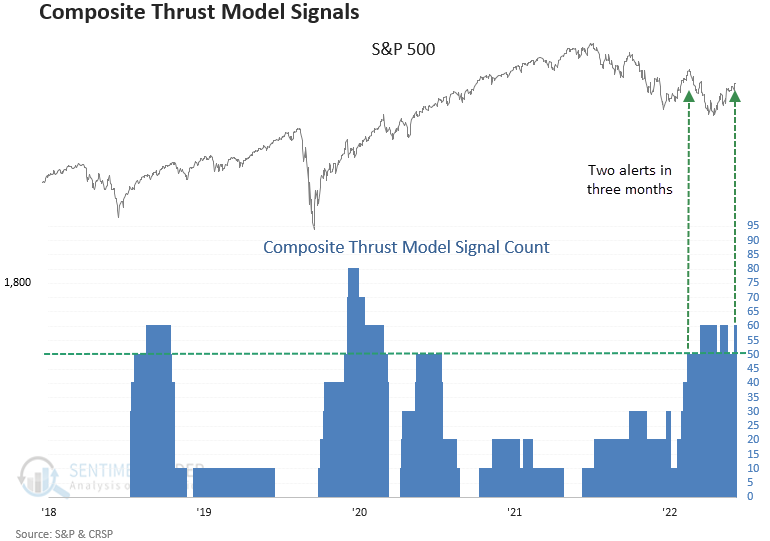
It's rare to see two CTM signals trigger within a little more than three months of each other. The previous alert occurred near the peak of the June to August bear market bounce, leading to the worst drawdown in history at the end of two months.
Sometimes indicators/systems struggle in specific environments, which is the case now with breadth thrusts. Remember, no indicator is infallible. So, one must manage risks appropriately.
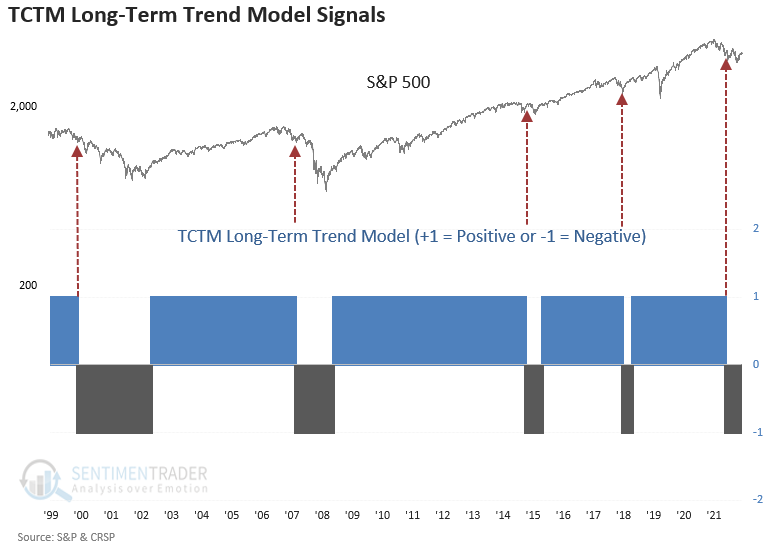
From a big-picture perspective, we must remember that the Long-Term Trend Model for the S&P 500 is negative. An immediate trend change is unlikely, with the 200-day moving average declining and negative price momentum.
The Dow has clawed back most of its losses
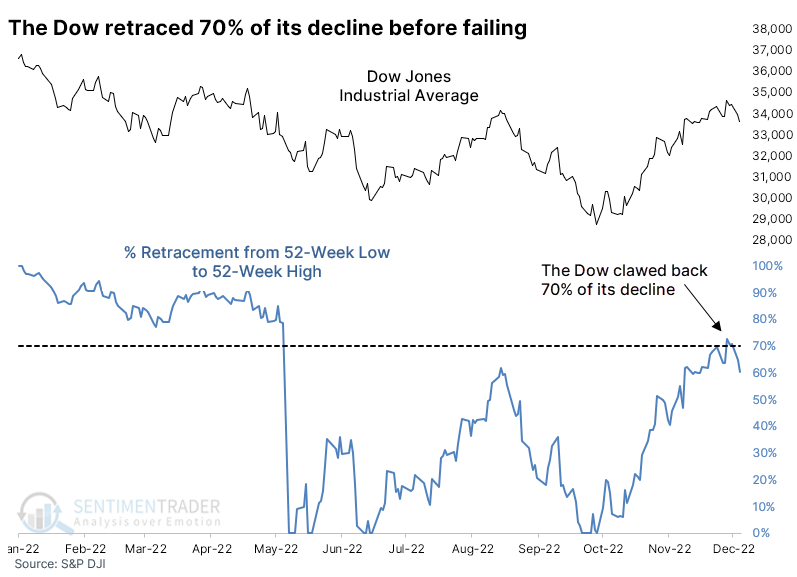
In April 2020, we looked at the idea that it's the retracement that counts. Investors don't particularly care how much stocks or indexes have rallied off a low; they care about how much of their losses have been erased.
During this cycle, Industrial stocks have been the star. And the most venerable index of them all, the Dow Jones Industrial Average, retraced more than 70% of its decline in fewer than three months. It's more than the index retraced during its rally into August.
The table below shows every time since 1900 when the Dow retraced at least 70% of its decline from a 52-week high to a 52-week low within 3 months.
Shorter-term returns were mixed, with a slight negative bias. They gradually improved, and the Dow suffered only one moderate loss over the next year. There aren't too many investors who would have considered the signal in 2001 anything other than a miserable failure, but the Dow held up better than most other indexes.
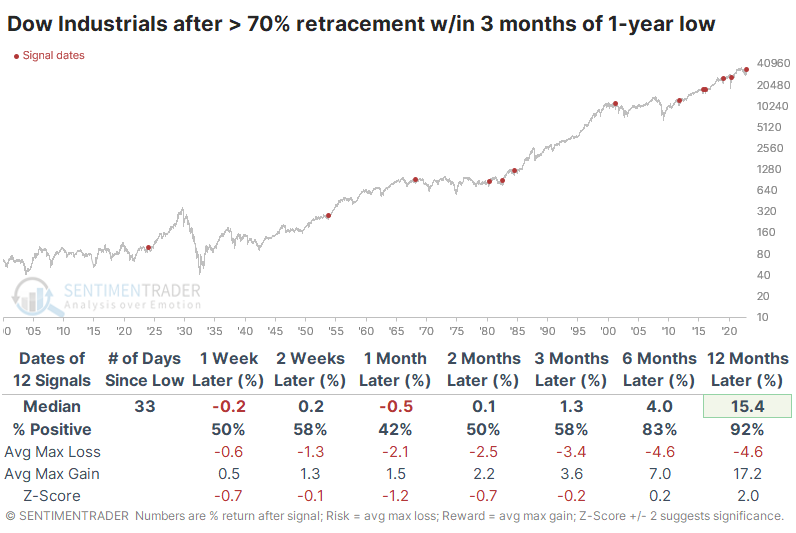
A table of maximum losses and gains over each time frame shows that the Dow generally suffered minimal losses in the months ahead, but there weren't many outsized gains, either. Over the next year, there was only one loss of more than -11.5% but seven gains of more than +11.5%.
Even with a broad-based rally, Wall Street is pessimistic
Stocks have rallied hard, but Wall Street strategists aren't buying it.
Strategists are currently pricing in about flat returns for the S&P 500 in 2023, which goes against their usual bullish bias. When strategists were the least optimistic about next-year returns for the S&P, the index tended to do pretty well. Since 2005, it has shown a gain during the first two weeks of the year every time.
When strategists were the most optimistic about the following year. In those cases, the S&P's returns tended to be worse across virtually all time frames, less consistent, and with more risk.
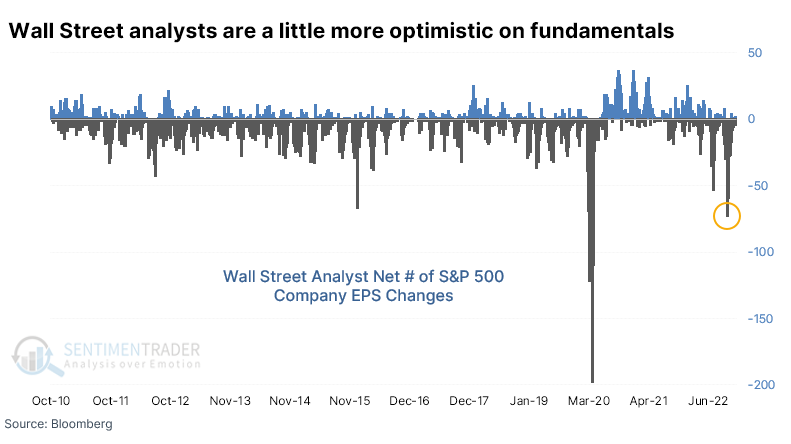
On Wall Street, strategists take a top-down view, starting with global and domestic macro, economic, and fundamental considerations, and work their way down. Analysts tend to do the opposite, focusing on the micro of individual company earnings prospects.
Those analyses have been just as depressing as the ones that strategists are considering.
A few weeks ago, analysts were busy downgrading the price targets on their companies. There were more than a net 150 downgrades in a single day, the 3rd-most in 12 years. Analysts are even more pessimistic about stocks' fundamental prospects. They were recently downgrading the earnings per share estimates at the 2nd-greatest pace since 2010 and have just started to ease off the brakes.
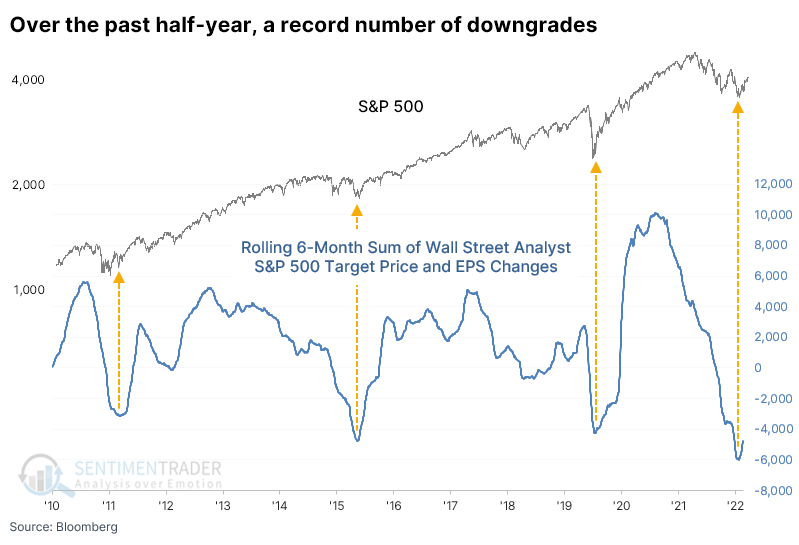
When we look at a rolling sum of net upgrades minus downgrades, both technical and fundamental, across all stocks in the S&P 500, the past six months witnessed a record number of downgrades. Three other times the combined net rolling sum exceeded -3,000, each coinciding with major lows in the S&P. Of course, the argument can be made that the sample size is too small and history too limited to draw any conclusions. Fair enough, but we can only work with the available data.
Maybe they're paying too much attention to economic indicators
As economic news gets worse, consumer and investor confidence trends lower and it is when things start to look their worst that the best opportunities present themselves. Jay showed that both consumer confidence and manufacturing data suggest that moment is getting closer.
The chart and table below display performance results for the S&P 500 Index when the University of Michigan Consumer Confidence Survey is below 58%.
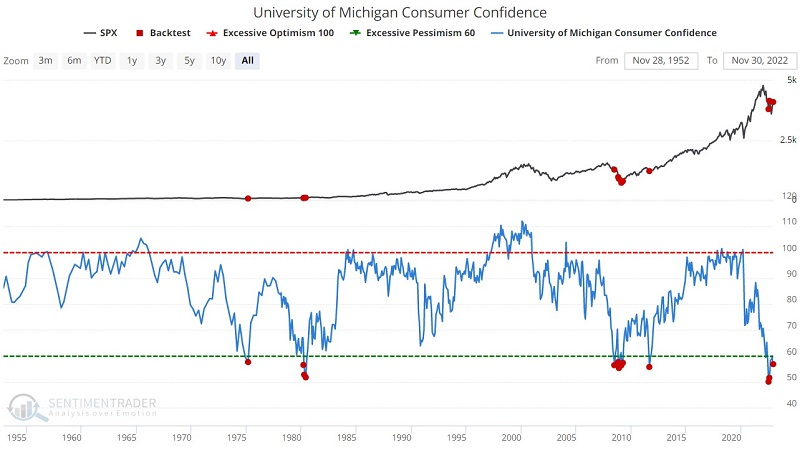
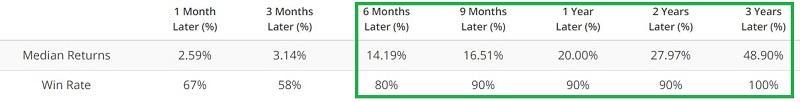
The good news is that the S&P 500 was higher twelve months later 90% of the time, with a median gain of +20%. The bad news is that June 2008 signal came into the teeth of the massive Great Financial Crisis decline and was followed by a dramatic waterfall decline in the months ahead. On the plus side, the June and July 2022 signals have so far been followed by a (volatile) recovery.
When PMI Manufacturing data got to the current level, the S&P showed a median one-year return of 19.2%. Usually, the worse this indicator got, the better the forward return for stocks. Despite woeful media headlines, that's often the best risk/reward opportunity for investors.
Price action needs to change its habits
Dean noted that on Tuesday, the MACD system triggered the second risk-off signal in 2022. The last alert was unkind to equities, with the S&P 500 declining 11% over the next two months.
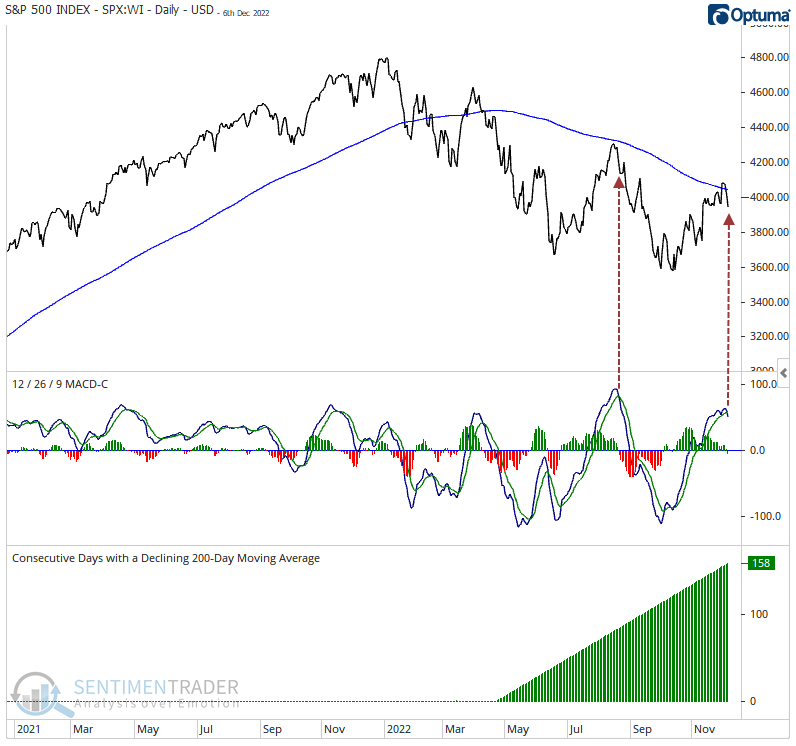
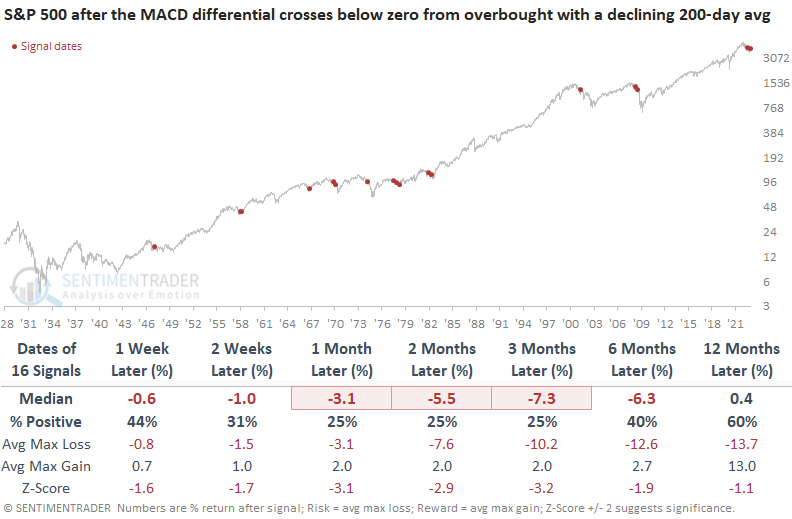
Large-cap stocks tend to struggle over the next six months when the S&P 500 is in a downtrend, and the MACD indicator signals a loss of price momentum in overbought territory. The signal shows a loss at some point in the first two months in 30 out of 38 instances.
Like the August signal, the second alert occurred when the S&P 500 was down less than 20% from a multi-year high. MACD signals within 20% of a high tend to exhibit greater downside risk, especially in the first three months. The alert showed a negative return at some point over that time frame in 14 out of 16 instances.
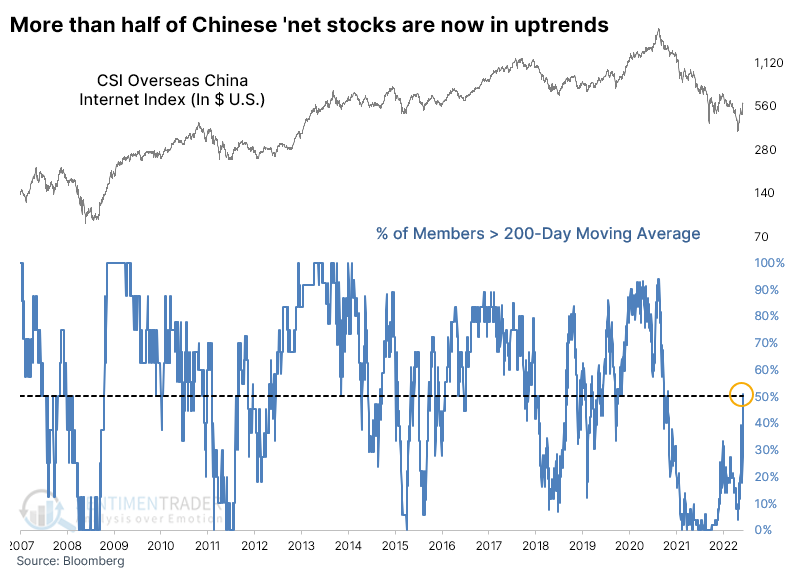
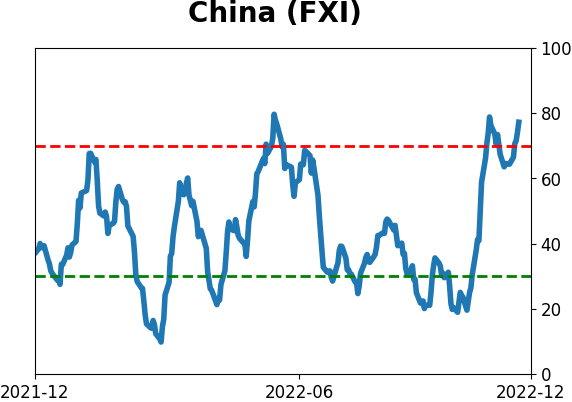
Chinese stocks have surged anew
On October 25, we looked at the latest plunge in Chinese internet stocks, which showed pure panic.
They have recovered nicely since then. It has been enough to push nearly all the stocks above their medium-term 50-day moving averages, exceeding the rally from June. Whenever there was an extreme cycle from a few members above their 50-day average to nearly all of them, the index that underlies the popular KWEB fund tended to rally.
Even more impressively, more than half the stocks are now above their long-term 200-day moving averages. That's a massive improvement from June, when barely a third of them closed above their averages.
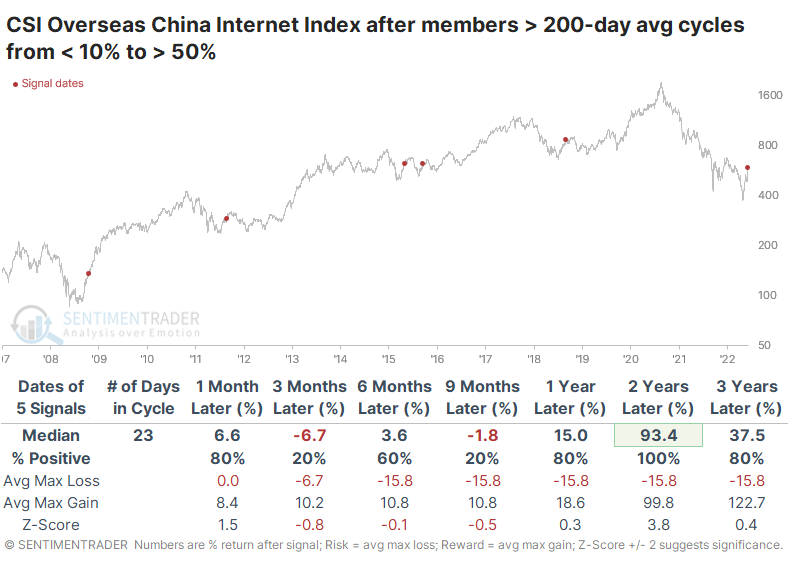
 Taking a longer-term look at forward returns after similar behavior, Chinese 'net stocks showed large gains in the two years following each signal. Granted, history is limited, and the sample size is tiny, but this kind of activity was admirably consistent in preceding significant and sustained gains.
Bullish factors for silver
In October, Jay highlighted several indicators flashing bullish signals for silver, which has since rallied 20%. There were also potential caveats at the time, which are no longer a factor, so silver could be positioning for a significant advance that may take many months to play out.
In the annual seasonal trend chart below, we see that silver is upon its annual seasonal low, the rest of December can be very choppy, and the first part of the new year is the most seasonally favorable time of the year.
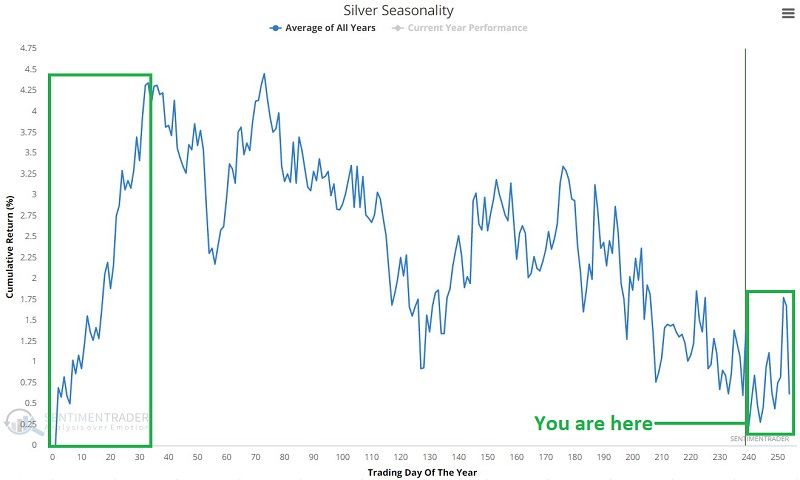
It must always be pointed out that annual seasonal trend charts are not roadmaps; they merely highlight historical tendencies. There is no guarantee that any given seasonal trend will work the next time.
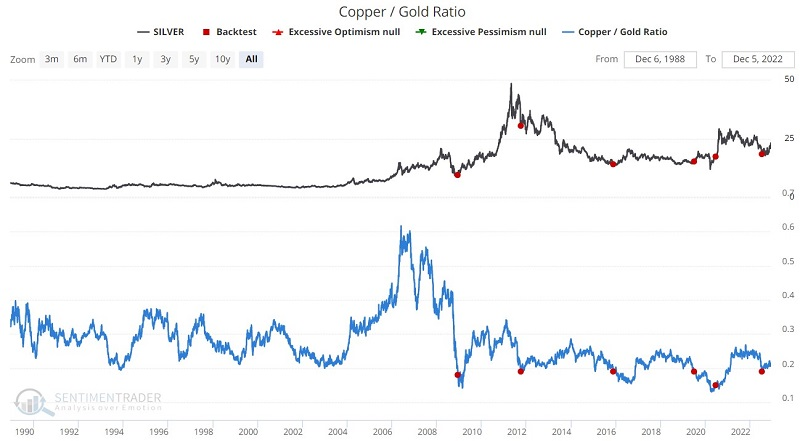
One of the indicators Jay highlighted was when the Copper/Gold Ratio crossed below 0.19 for the first time in a year. While signals are rare, note in the table below that six and twelve-month returns for silver following a signal tends to be quite robust. The latest signal remains a bullish tailwind for silver into July 2023.
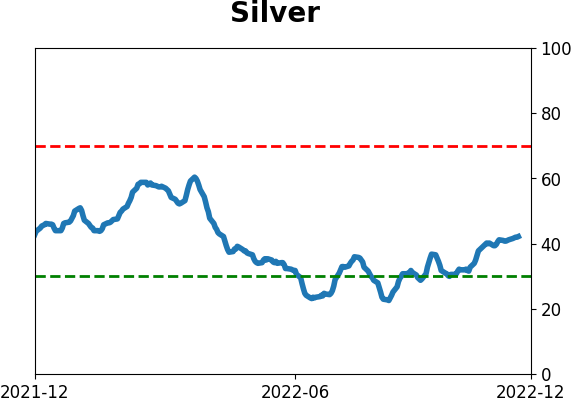
The same is true for Gold Optix. When the 20-day average for Gold Optix was below 30%, we see highly favorable results for silver. Recent signals occurred in September, October, and November, suggesting continued significant upside potential for silver.
Jay then considered alternatives for playing the bullish side.
SLV closed at $20.44 a share on December 6. Let's assume a trader with a $25K account is willing to risk 2% (or $500) on silver. This trader would pay $2,044 to buy 100 shares and then need to place a stop-loss 5% lower at $19.41 a share. This is not an unreasonable approach, since $19.41 would involve a drop below the supportive 200-day moving average. However, it doesn't give SLV much wiggle room.
Let's consider an alternative trade. This one involves:
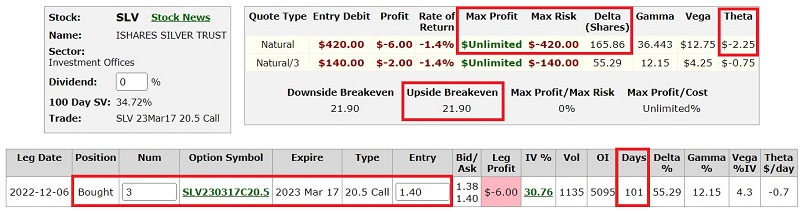
- Buying 3 SLV Mar17 2023 20.5 calls @ $1.40
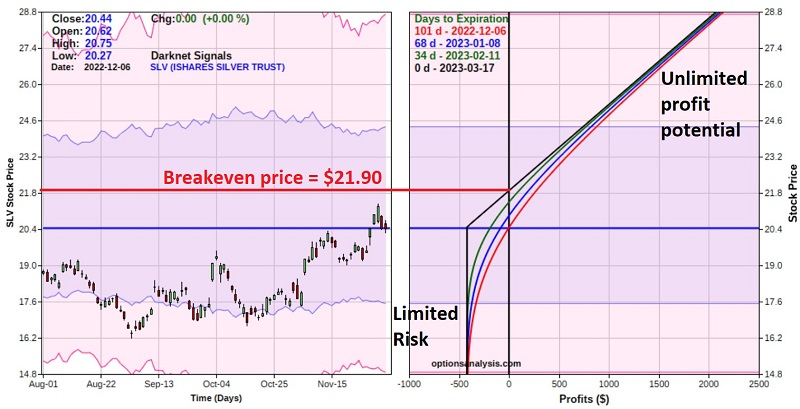
The particulars for this trade and the risk curves (i.e., the expected P/L at various prices for SLV on dates leading up to option expiration) appear below courtesy of Optionsanalysis.
Things to note:
- The cost to enter this trade is $420, which also represents the maximum potential loss
- For a trader with a $25K account, this amounts to 1.7% of capital
- The breakeven price equals the option strike price plus the premium paid (20.50 + 1.40 = $21.90)
- SLV must exceed $21.90 between now and 2023-03-17 for this trade to show a profit
- Above $21.90 profit potential is unlimited
- If the trade is held until expiration and SLV is below $20.50 a share, the option will expire worthless, and the maximum loss of -$420 will occur
Jay then weighed the pros and cons of that option position against buying an outright position in a fund like SLV.
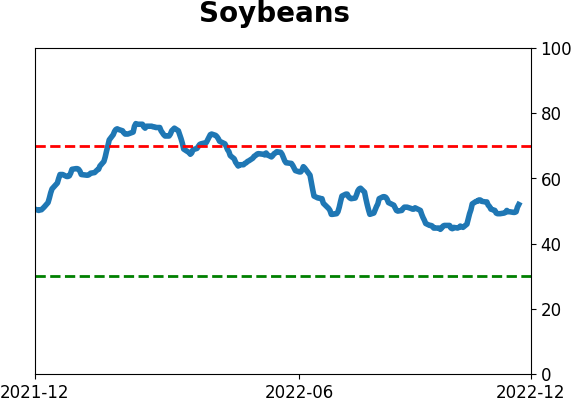
Corn is usually the beneficiary of a Santa Rally
Jay showed that a short timeframe during December has tended to see higher prices for corn futures. This period has seen corn gain in price 89% of the time since 1961, and it started this week.
For this test, we will examine the performance of corn futures between Trading Day of the Year (TDY) #236 and TDY #250. The chart below displays the cumulative dollar return achieved by holding a long 1-lot position in corn futures only during this period every year starting in 1960.
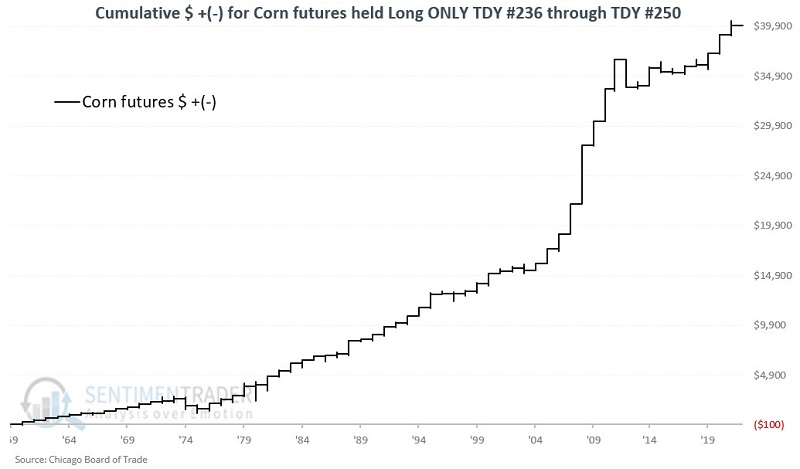
Over the past 62 years, corn futures showed a gain 55 times during this roughly 3-week period. The lopsided nature of gains versus losses over $1,000 (13-to-1) suggests a true edge. However, the sheer size of 2012's loss of -$2,813 reminds us of the need for risk management in every trade, regardless of any perceived edge.
Gold stocks usually rally about now, too
Most investors have heard reference to the "Santa Claus Rally" in stocks but Jay noted that gold-related stocks have also enjoyed a boost during a specific late-year seasonal window.
The Santa Claus Gold Miner Rally period begins on the close of the 11th trading day of December and extends through the close on the first trading day of January in the New Year. For 2022 this period extends from the close on December 15 through the close on January 3 of next year.
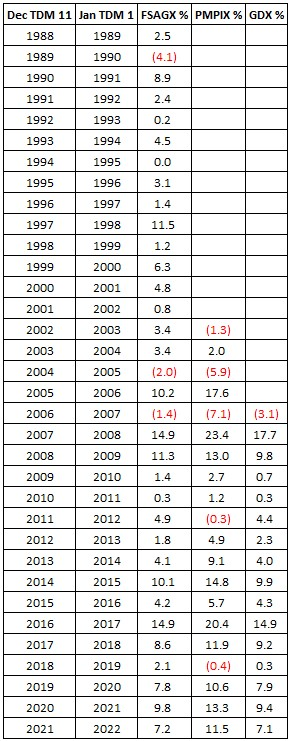
We have three unique slices of the gold miner sector. Two (FSAGX and PMPIX) are traditional open-ended mutual funds, one (PMPIX) is leveraged 1.5x, and one (GDX) is an ETF that trades like shares of stocks. Two (PMPIX and GDX) track an index, and one is actively managed (FSAGX).
The table below shows year-by-year results for each security during these seasonal windows, with PMPIX and GDX starting in their year of trading inception.
As an example, the chart below displays FSAGX's cumulative percentage gain from its starting date.
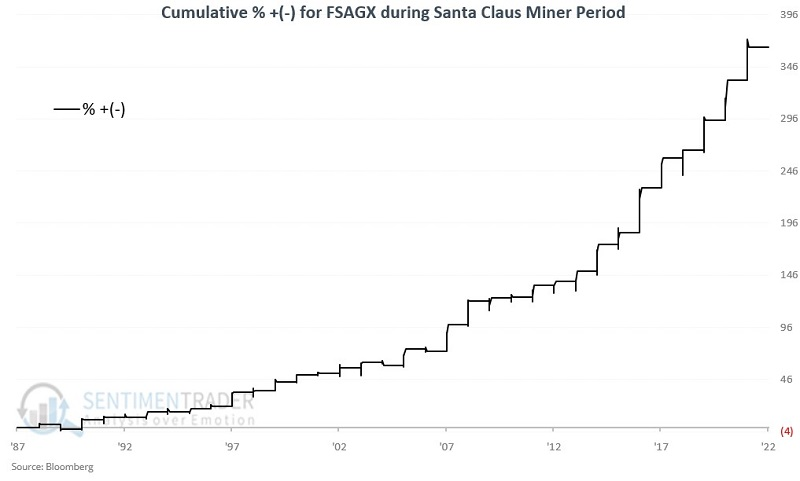
During these windows, the fund showed a gain 30 times, while losing only 3 times. It gained more than 5% during 12 years and never lost more than -5%.
About TradingEdge Weekly...
The goal of TradingEdge Weekly is to summarize some of the research published to SentimenTrader over the past week. Sometimes there is a lot to digest and this summary is meant to highlight the highest conviction or most compelling ideas we discussed. This is NOT the full research that's published, rather it pulls out some of the most relevant parts. It includes links to the published research for convenience; if you don't subscribe to those products it will present the options for access.
Indicators at Extremes
|
|
|
|
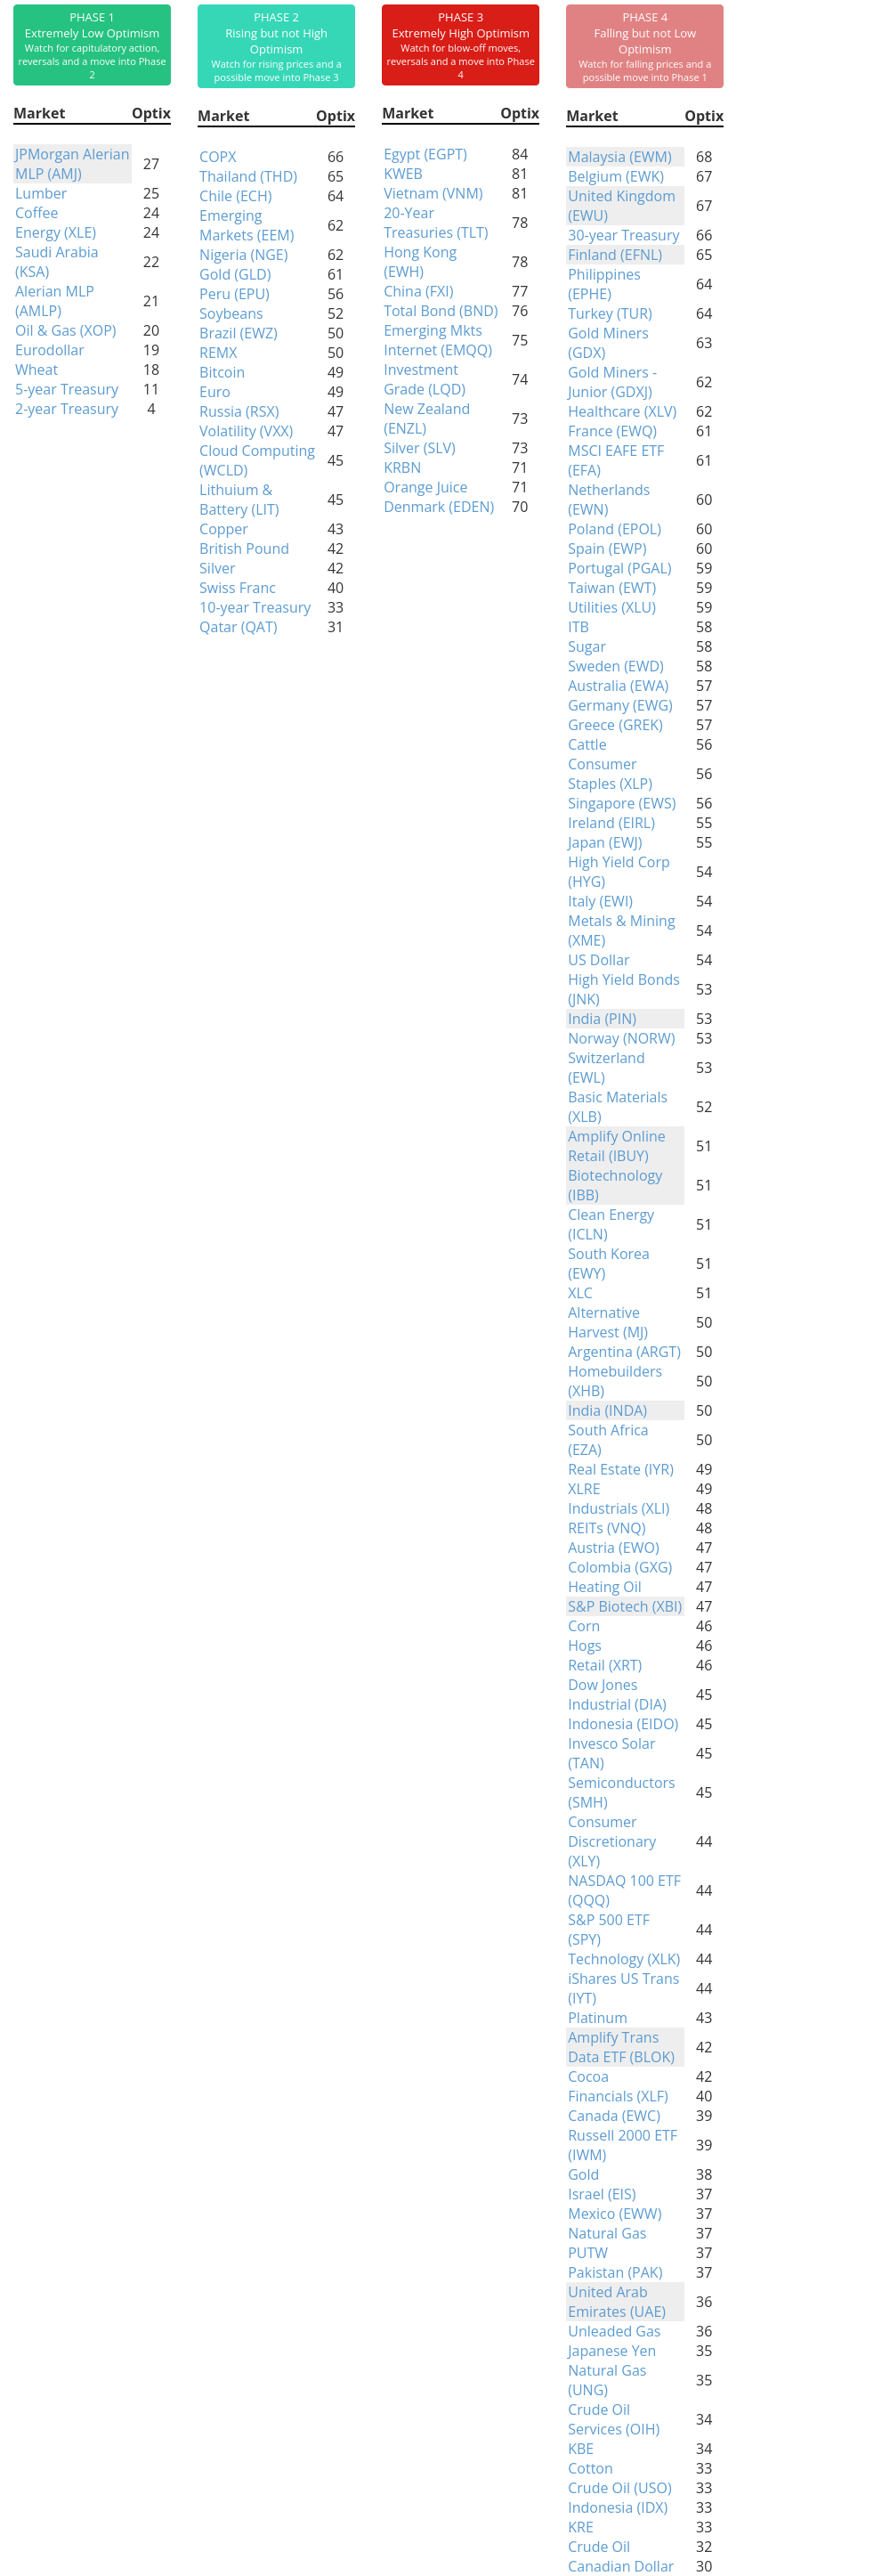
Phase Table
|
|
|
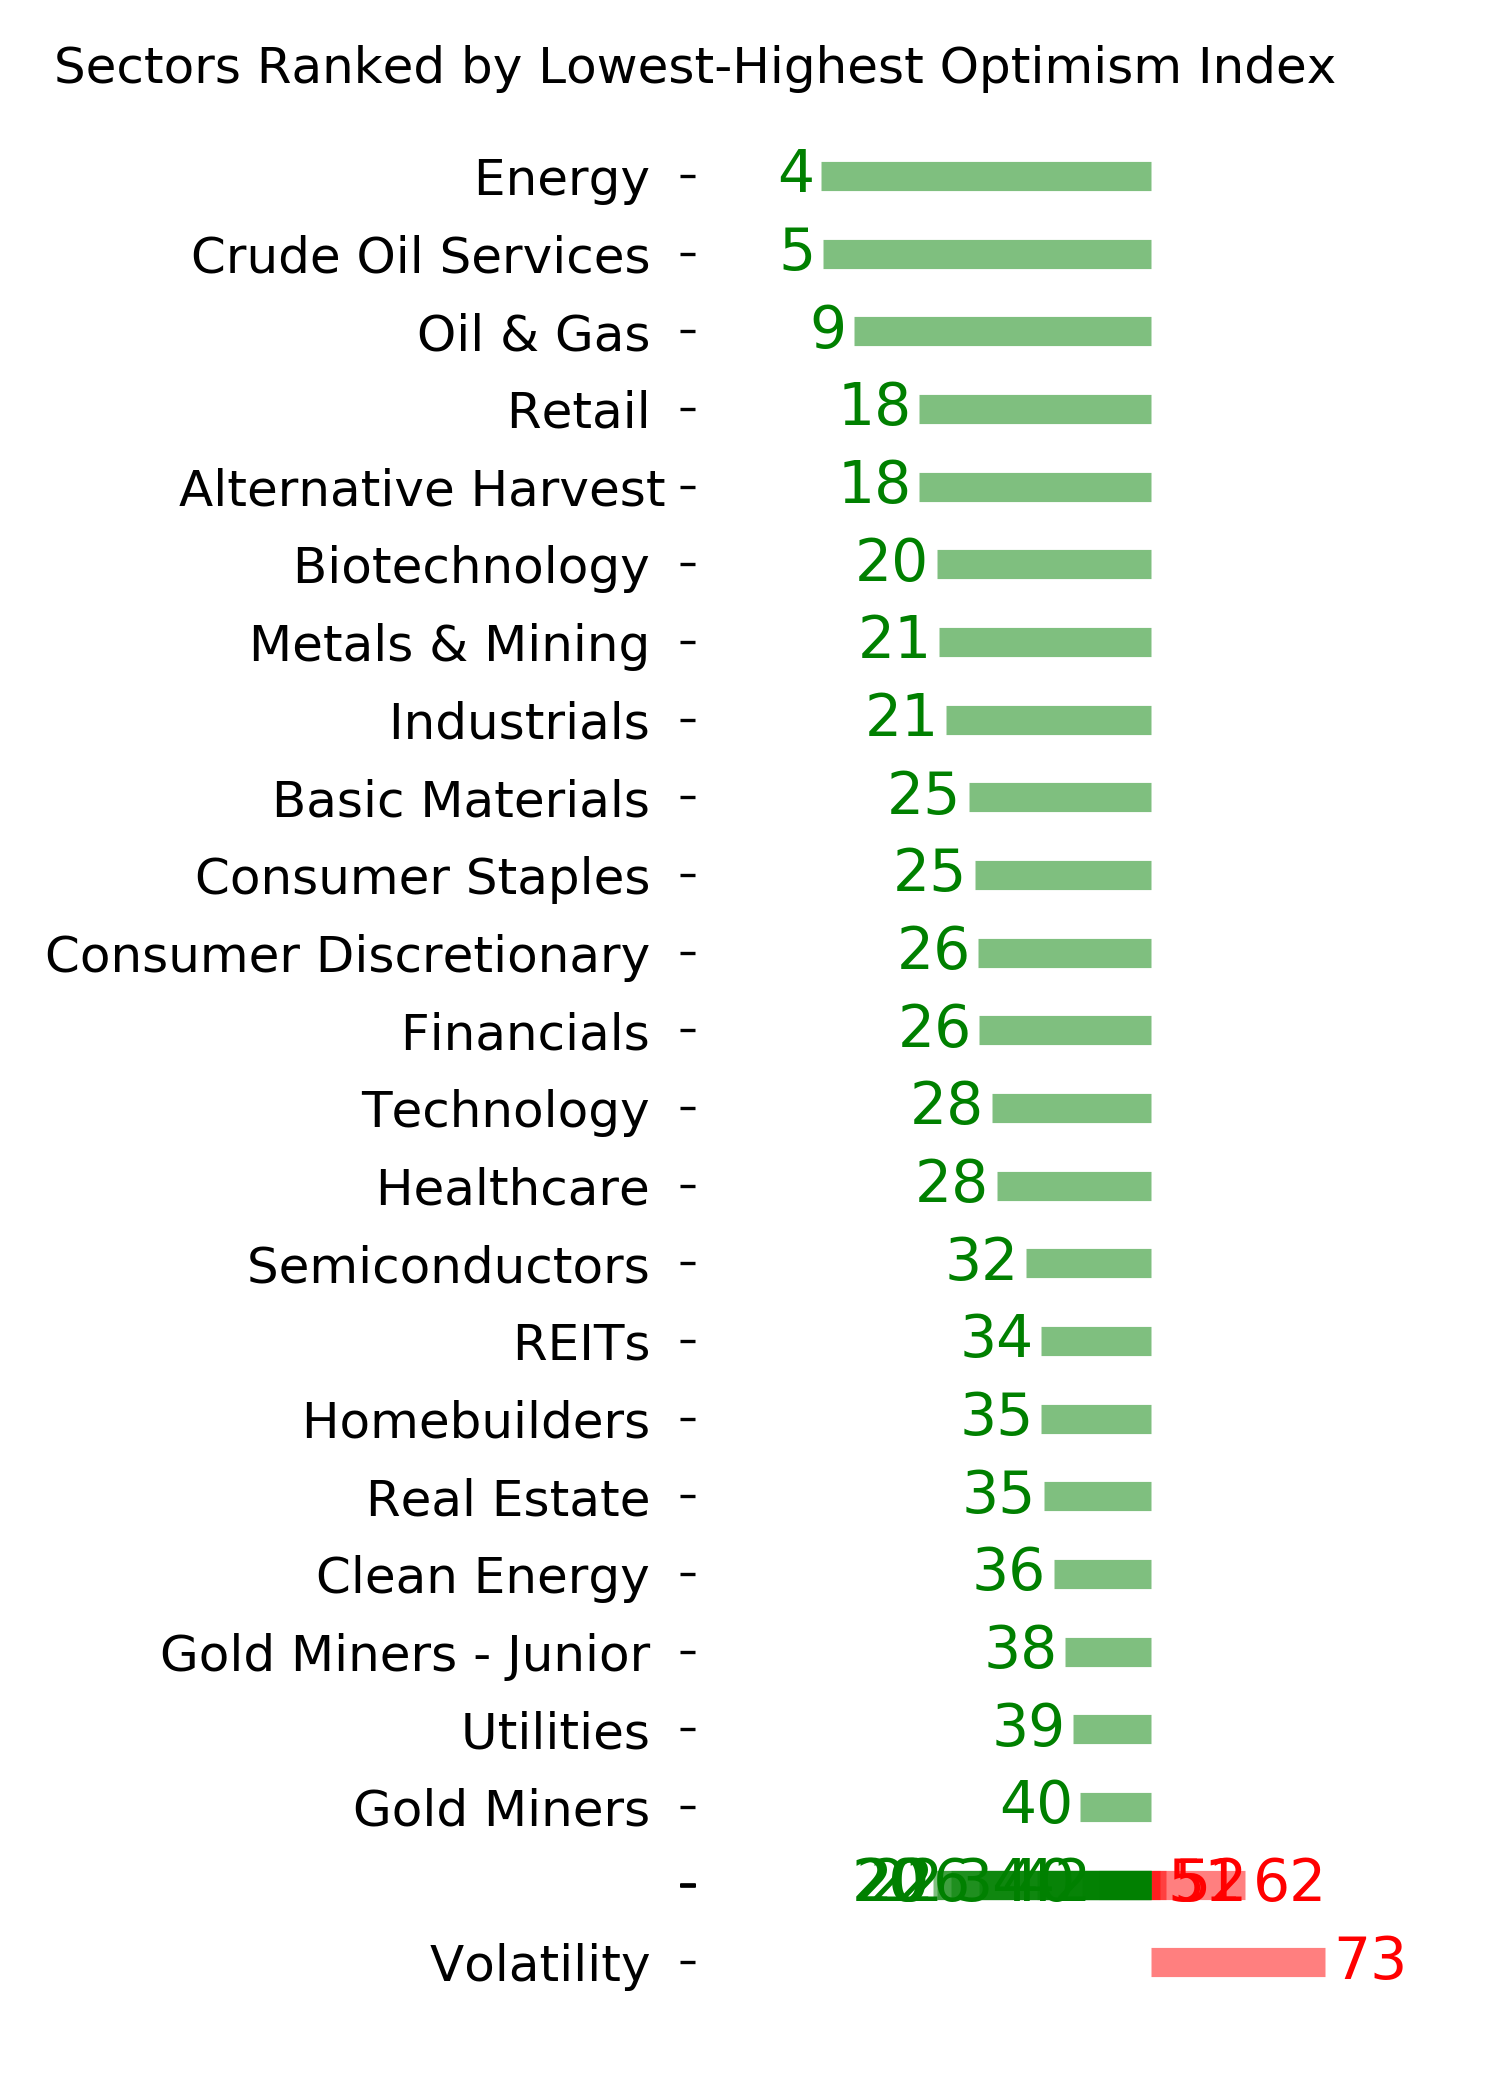
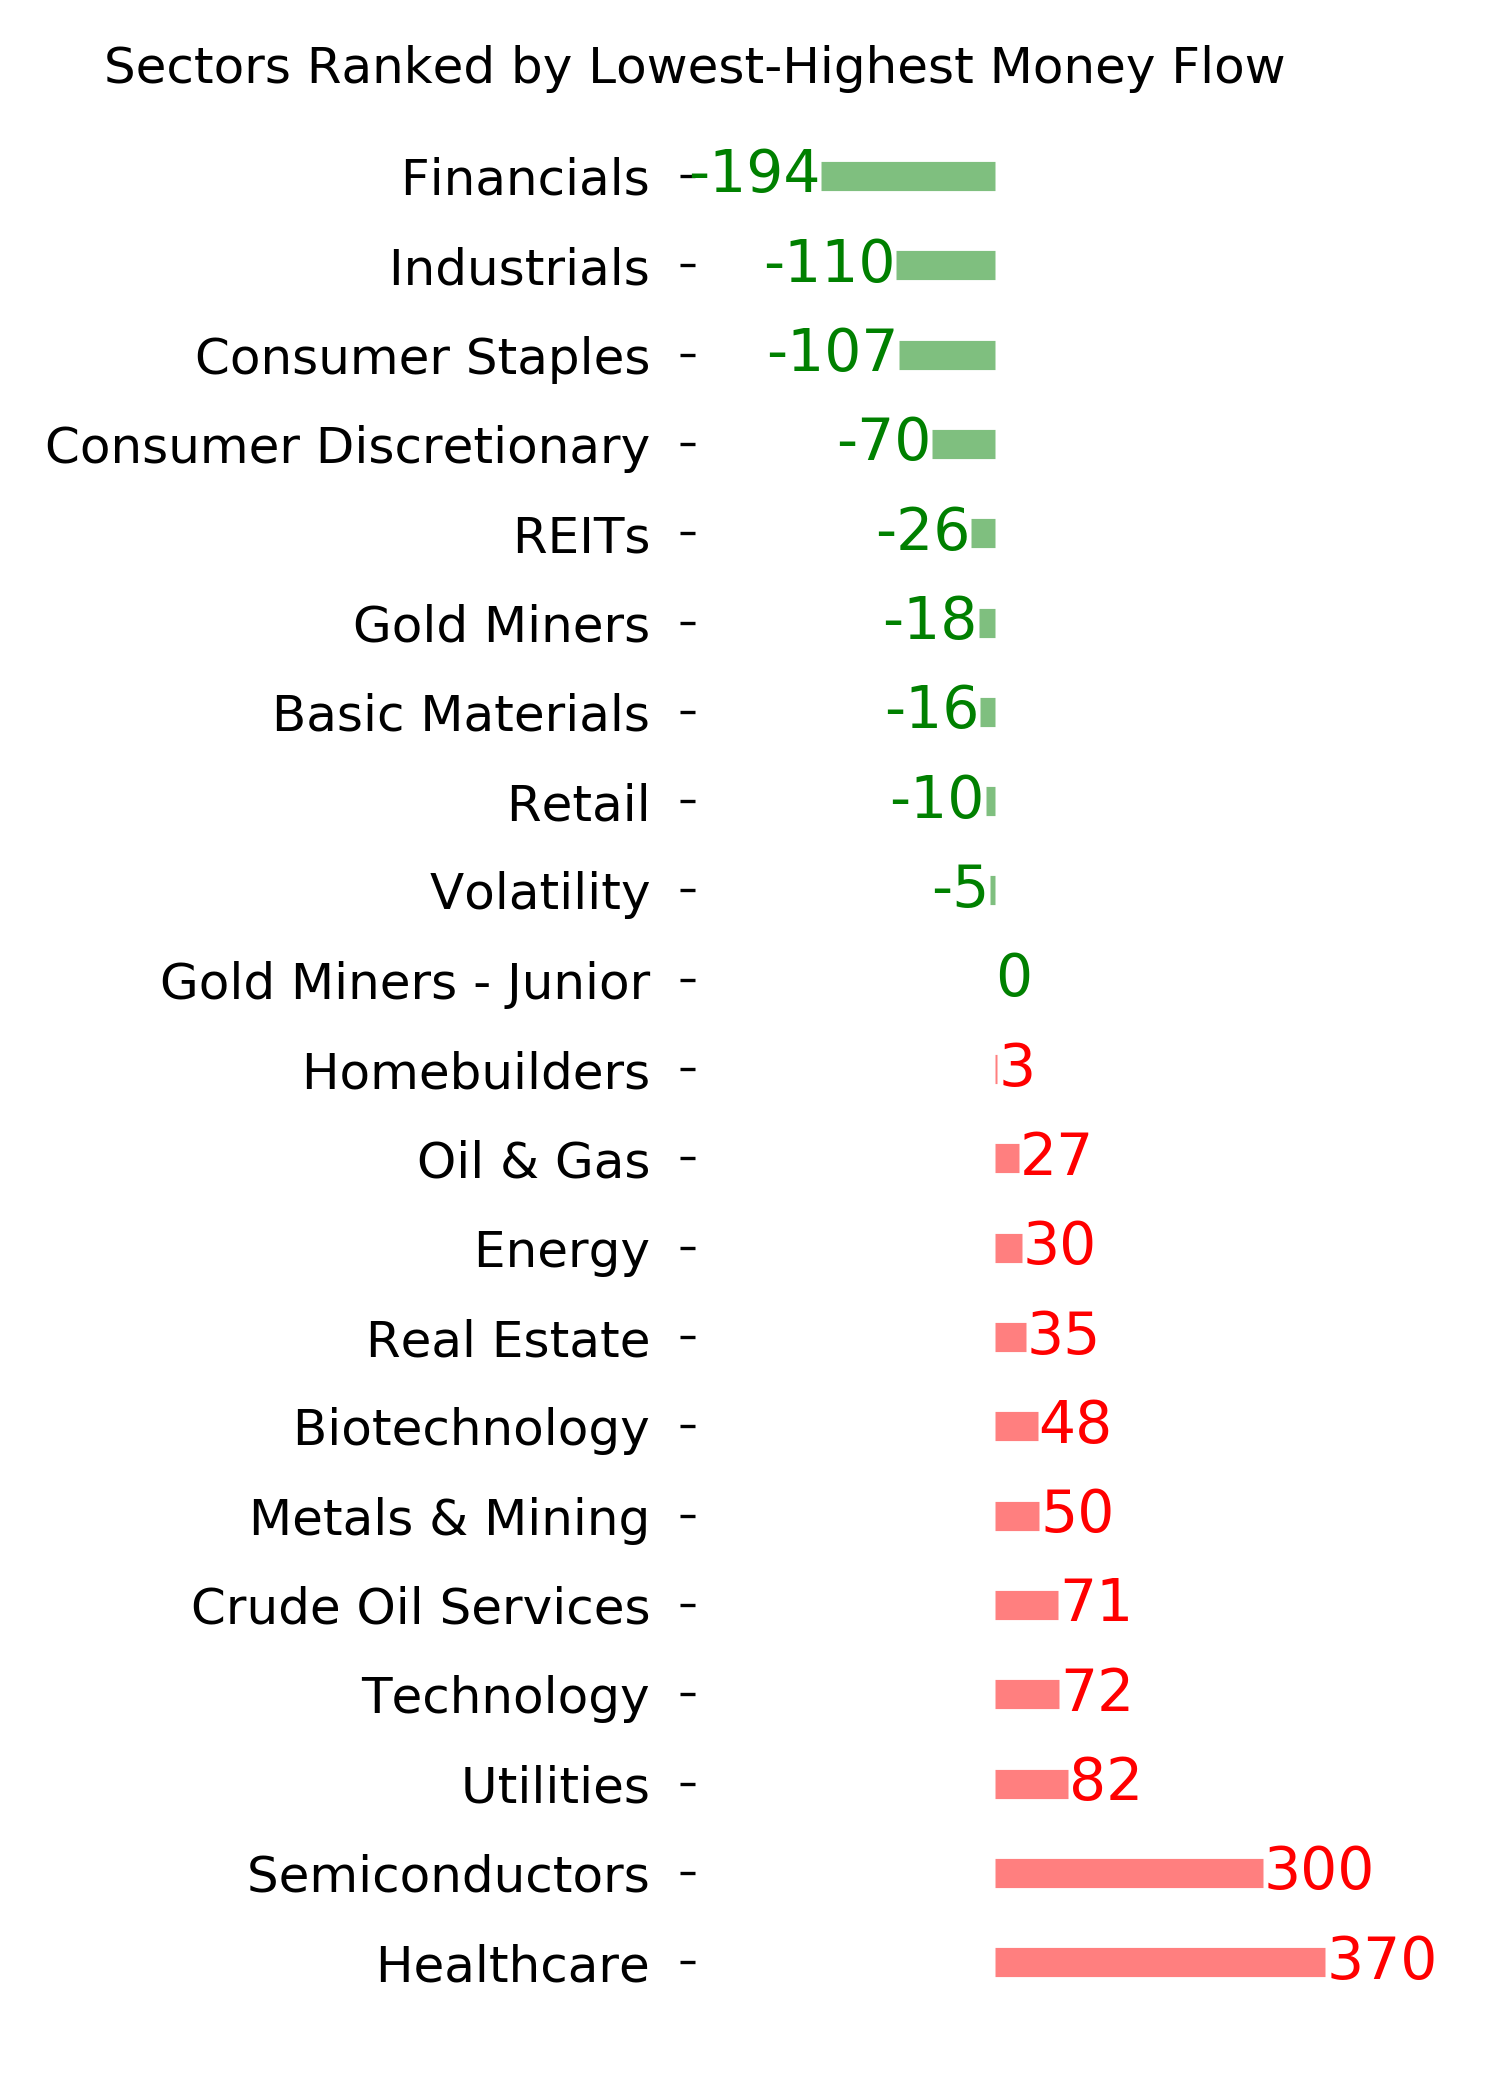
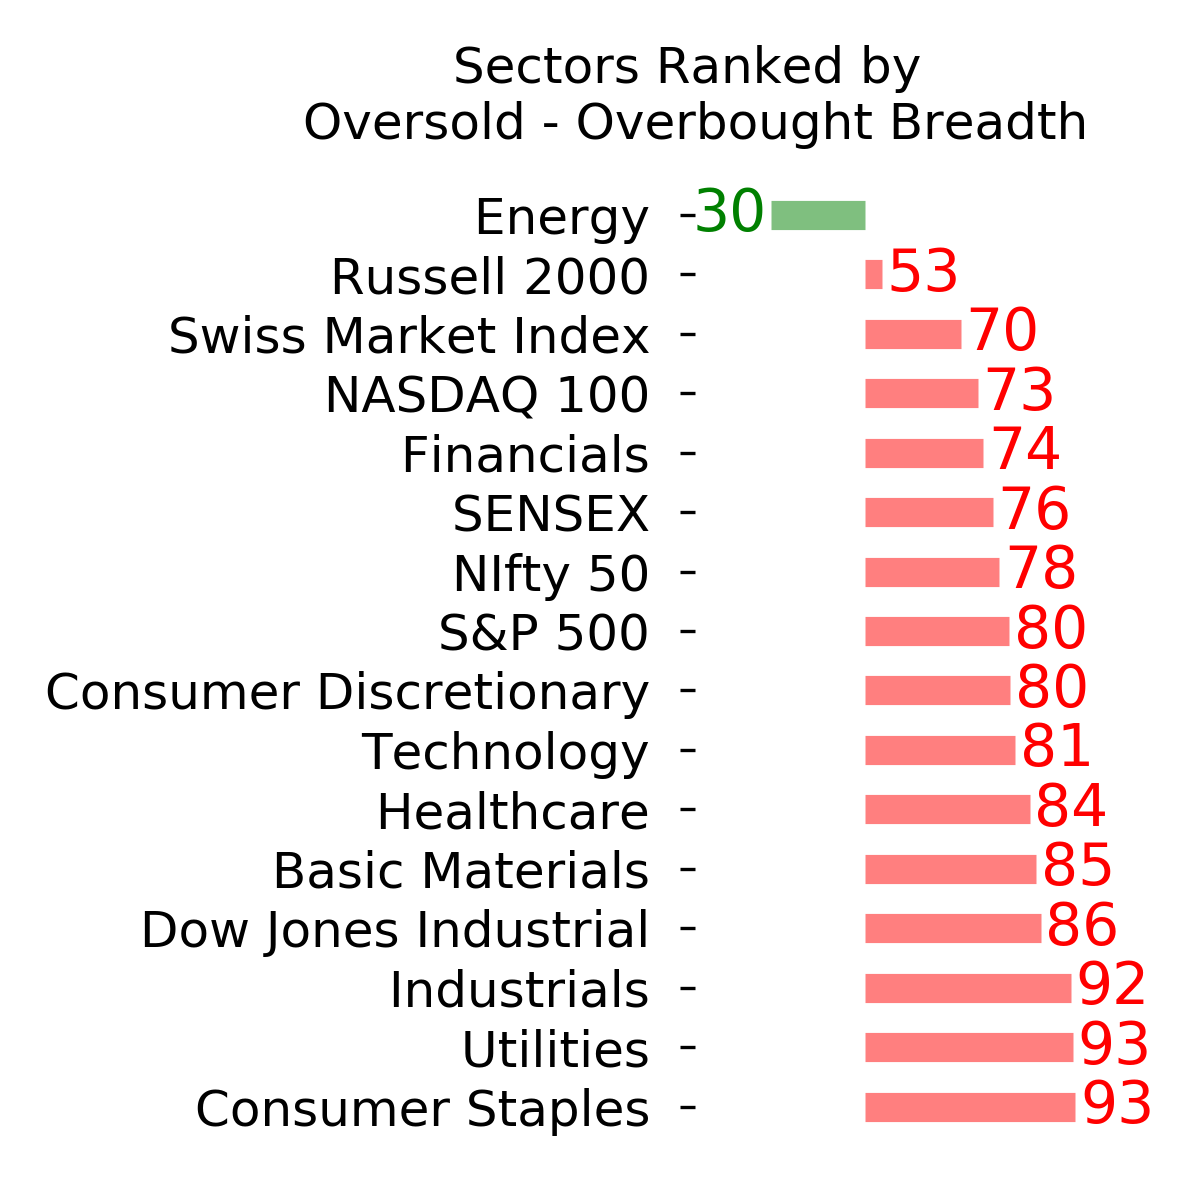
Ranks
|
|
|
|
|
|
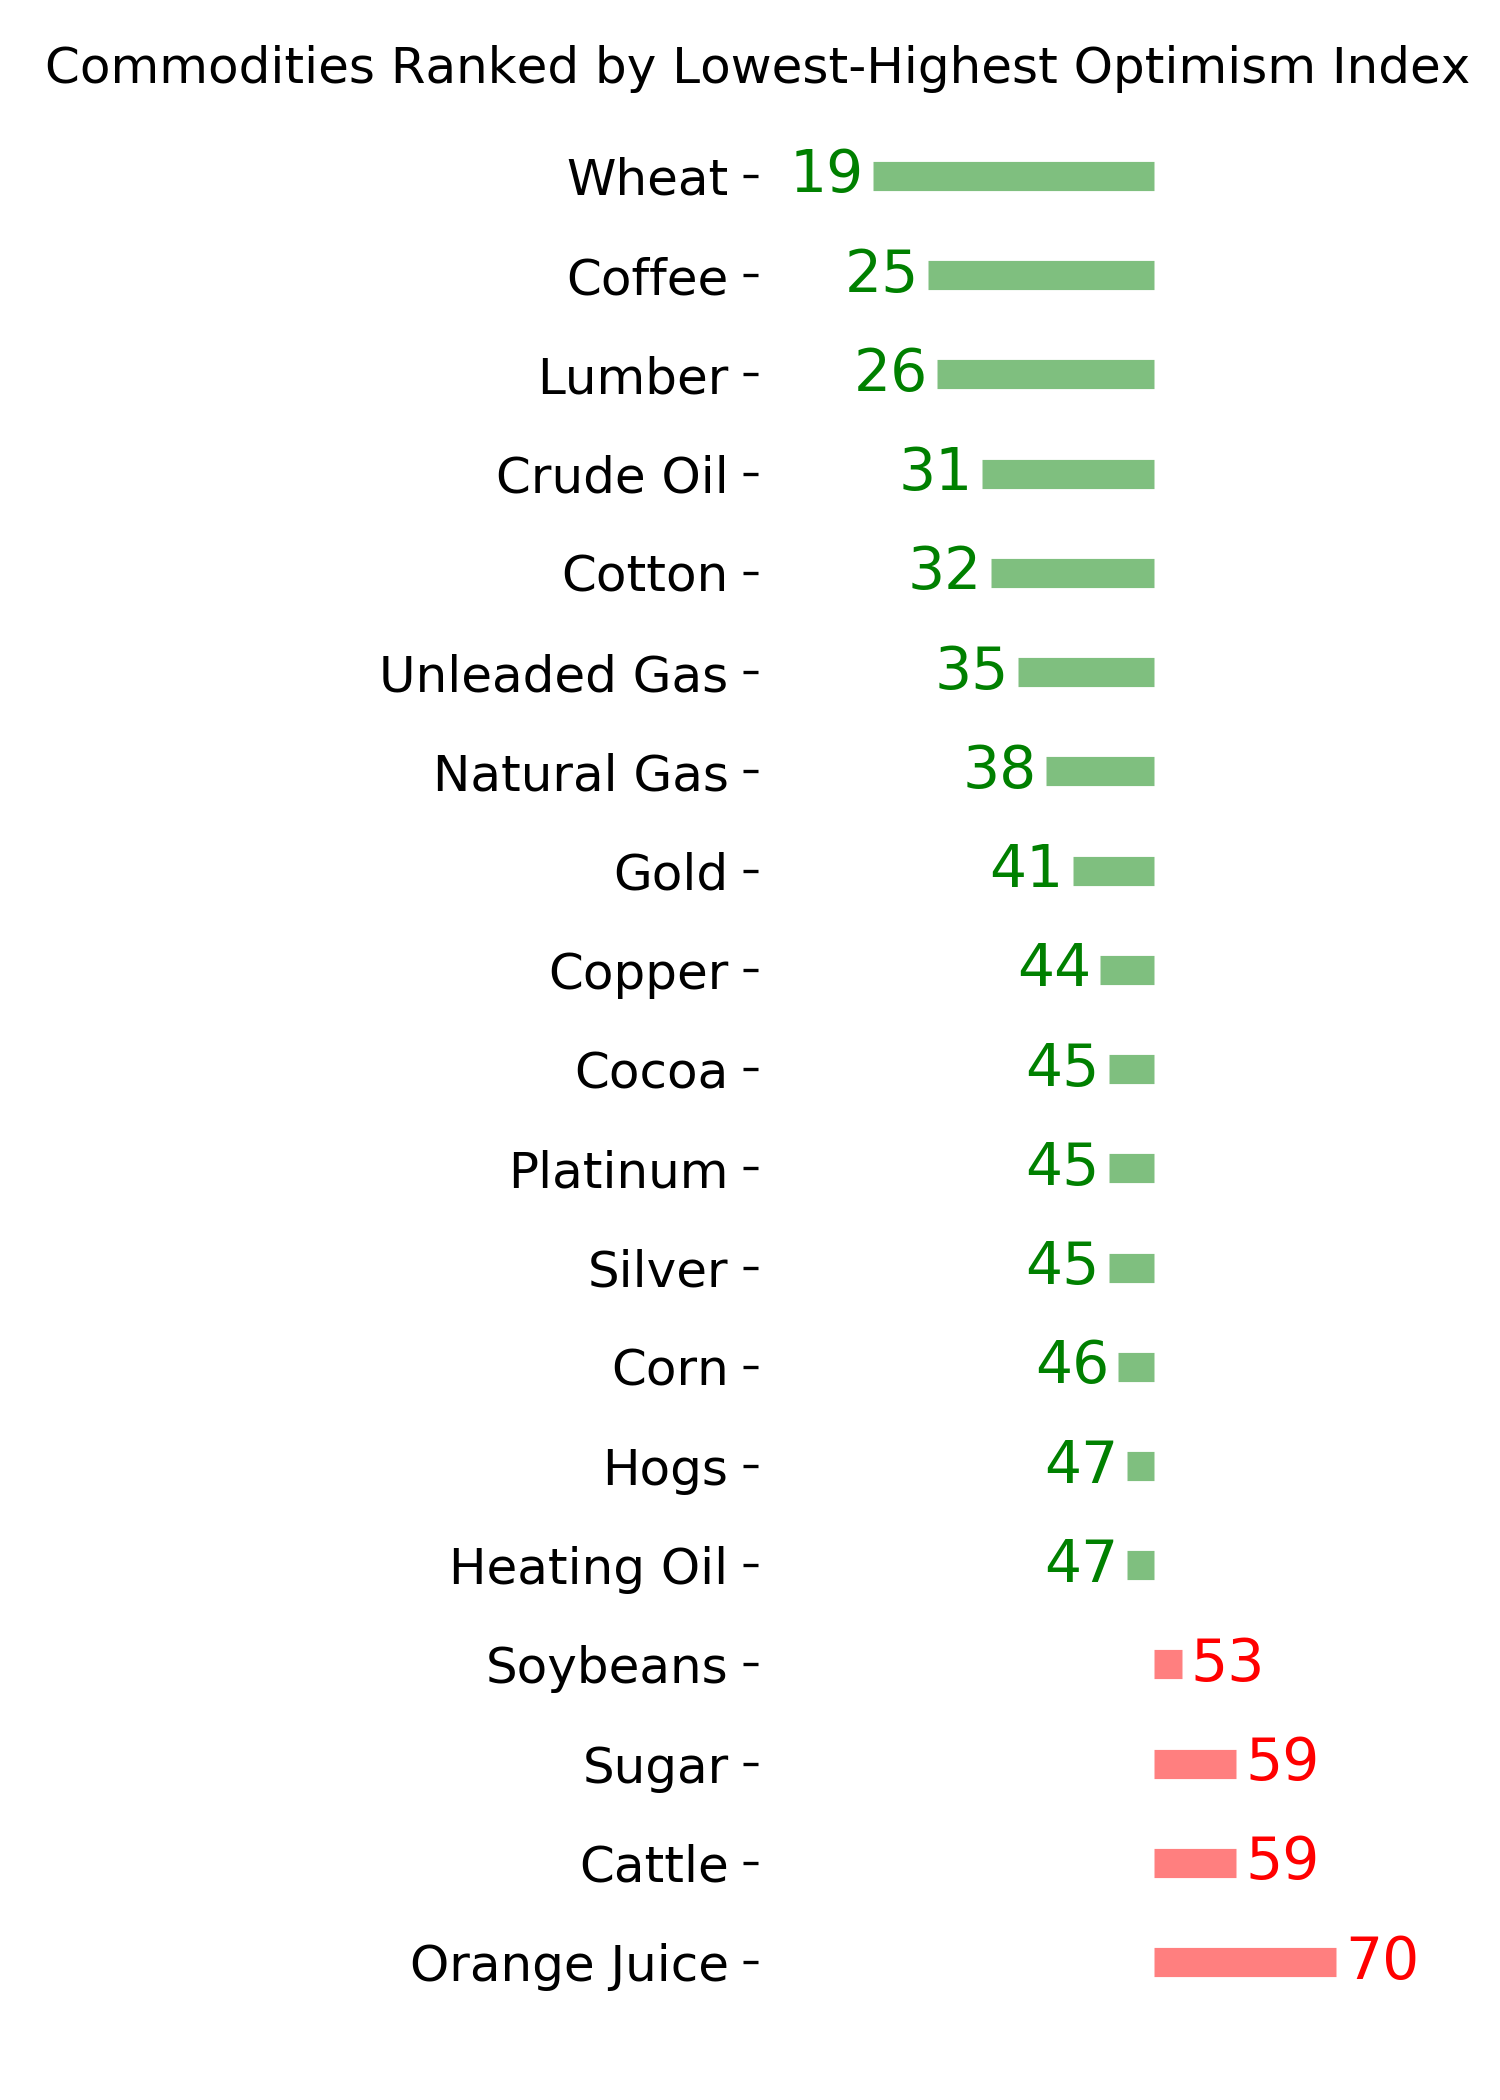
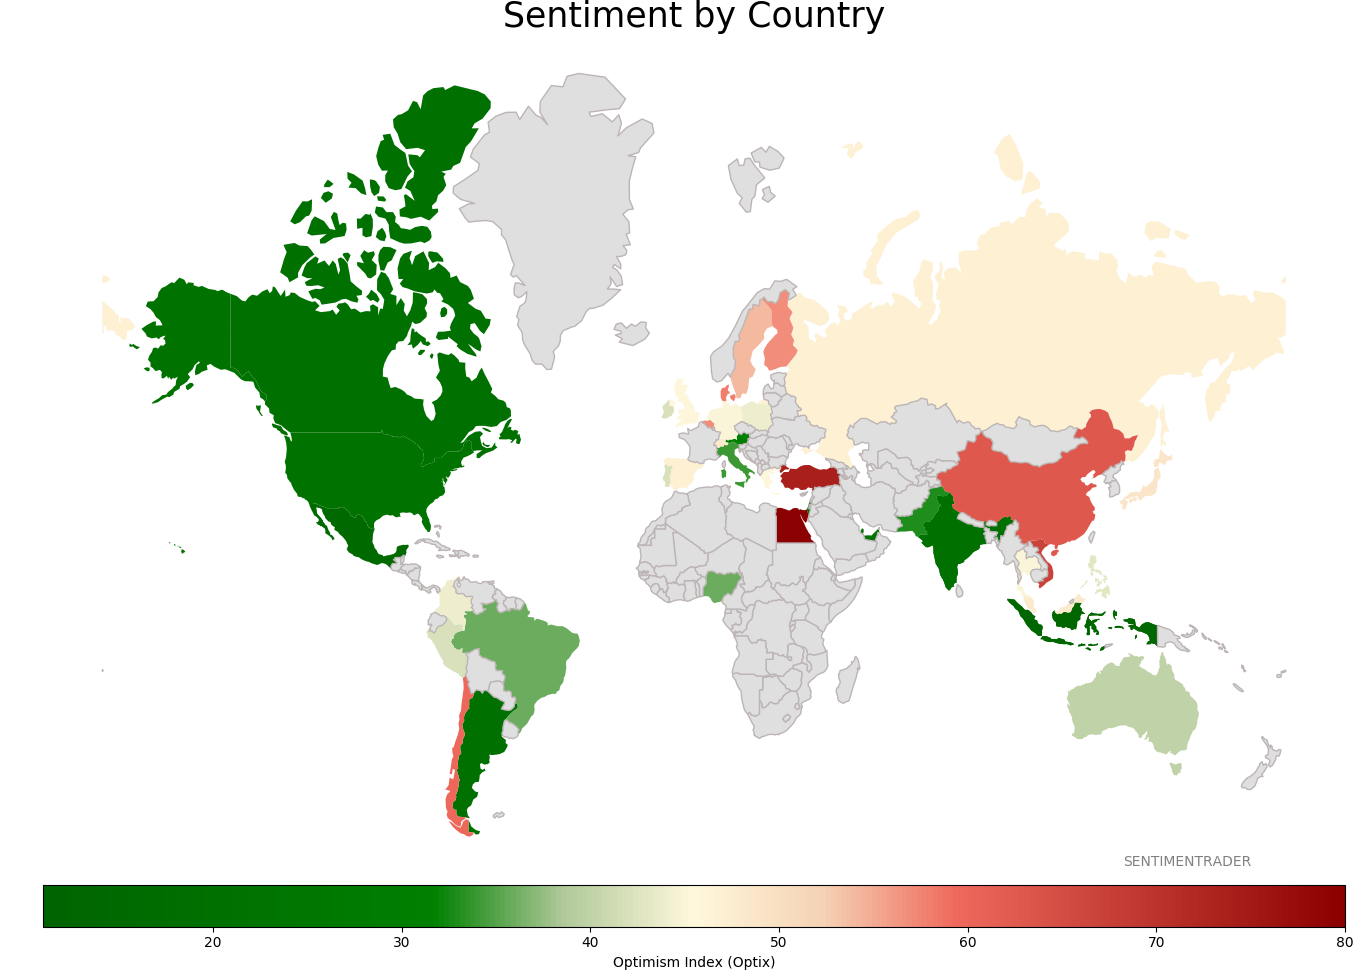
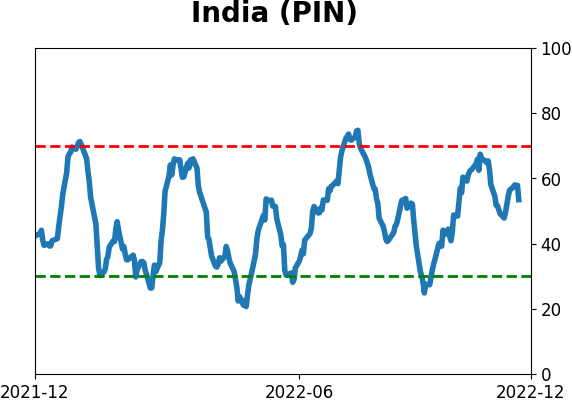
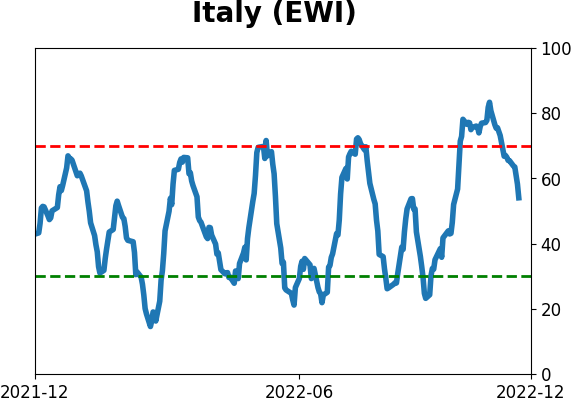
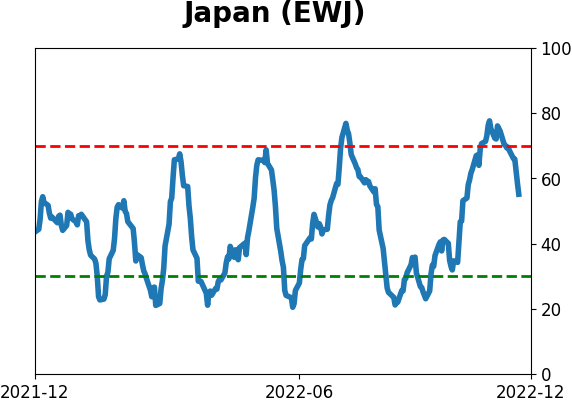
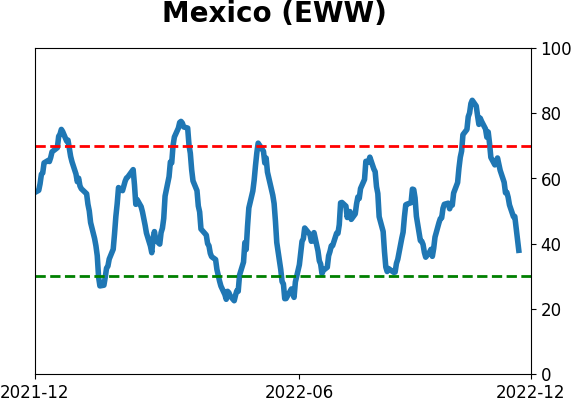
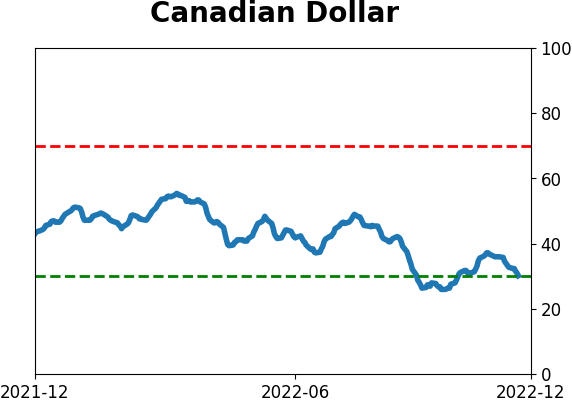
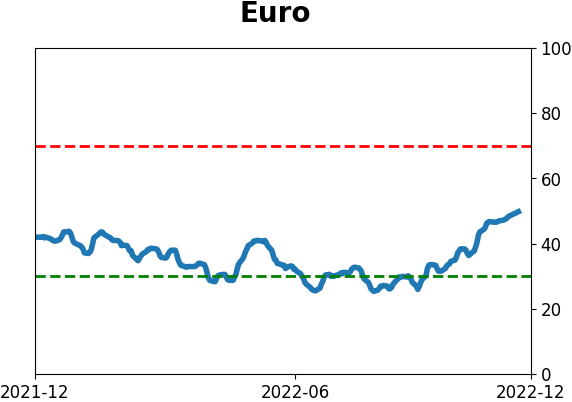
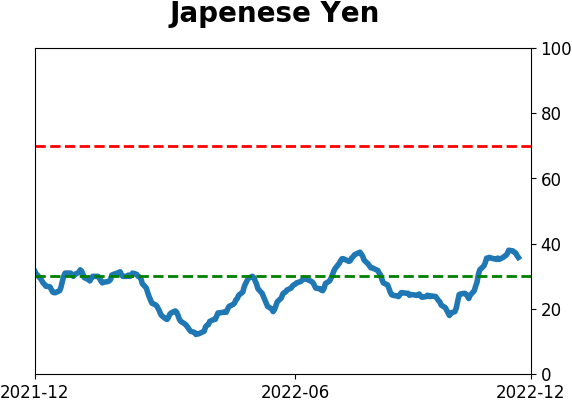
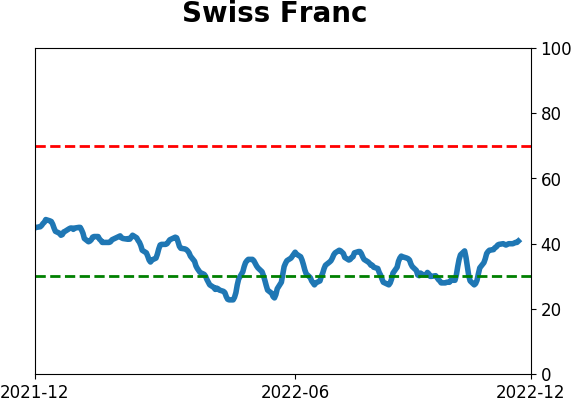
Sentiment Around The World
|
|
|
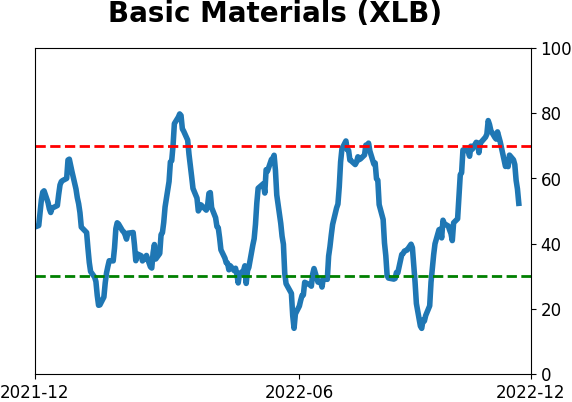
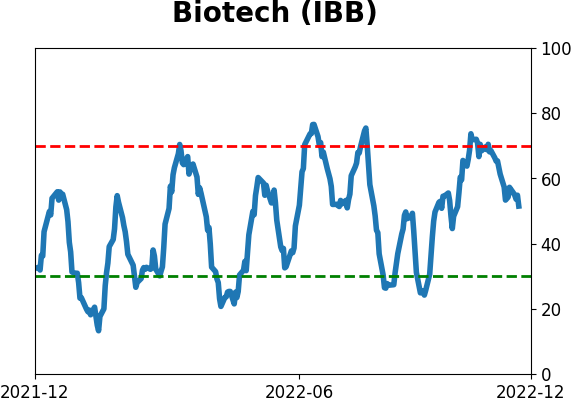
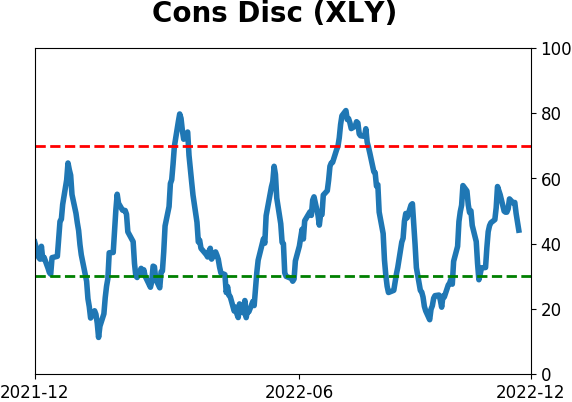
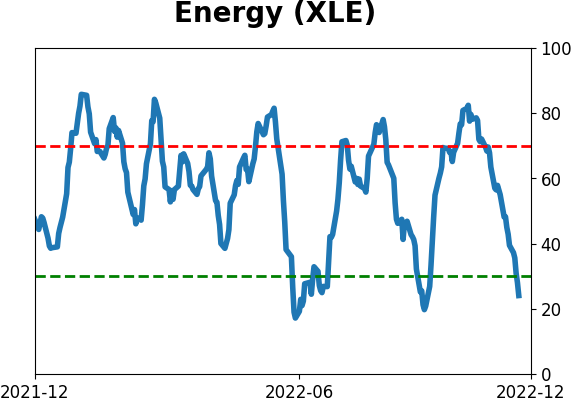
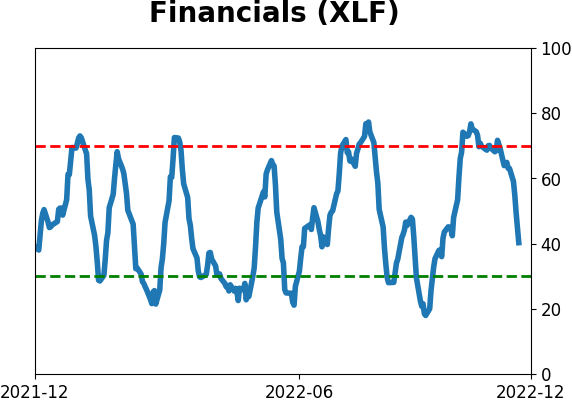
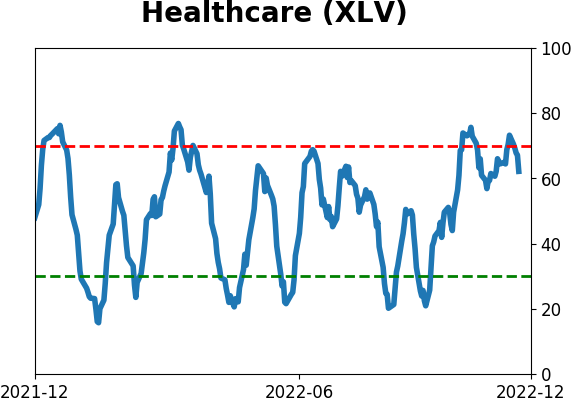
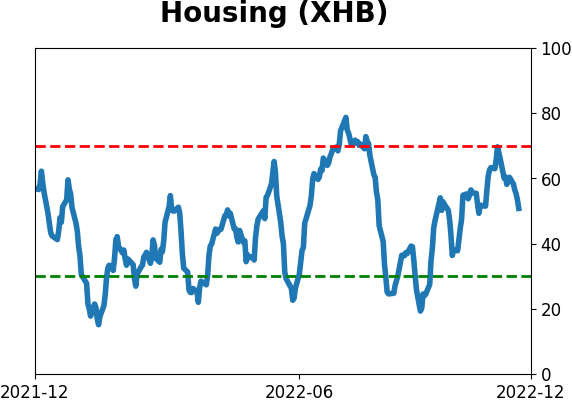
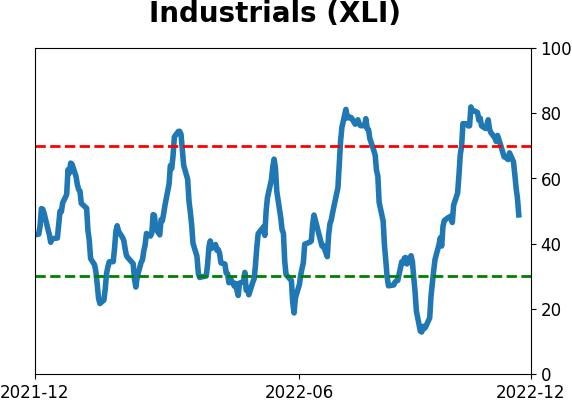
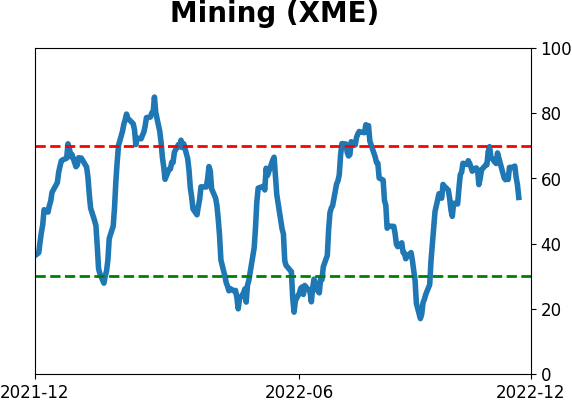
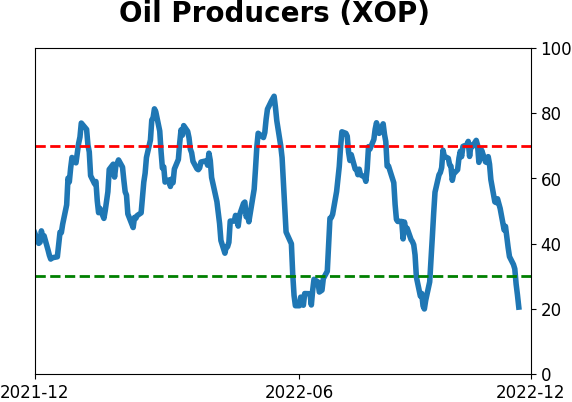
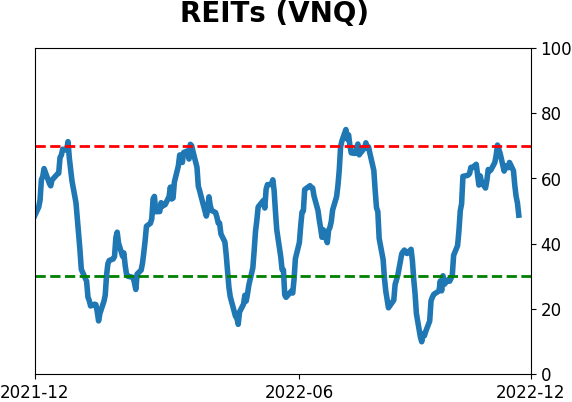
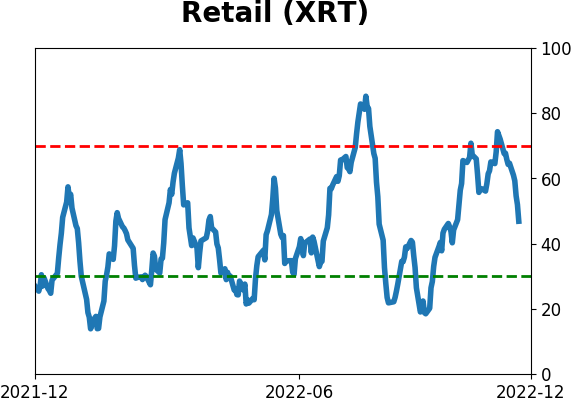
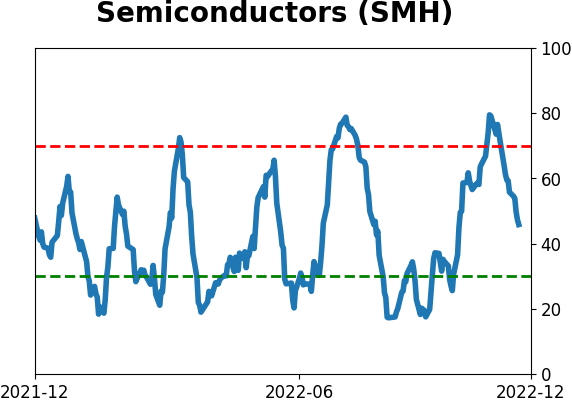
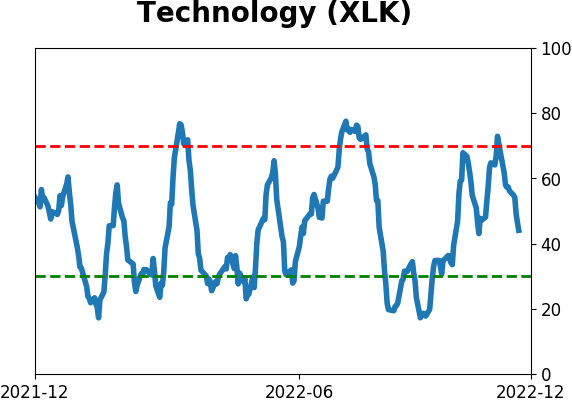
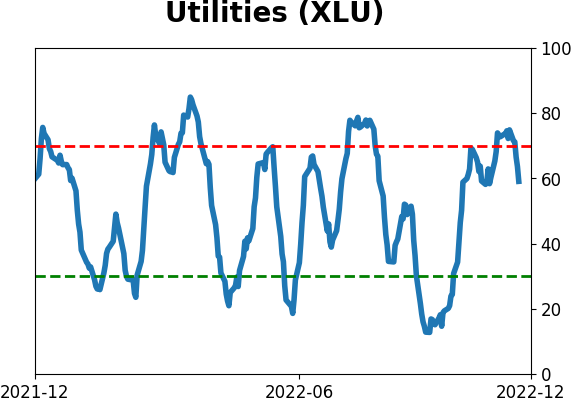
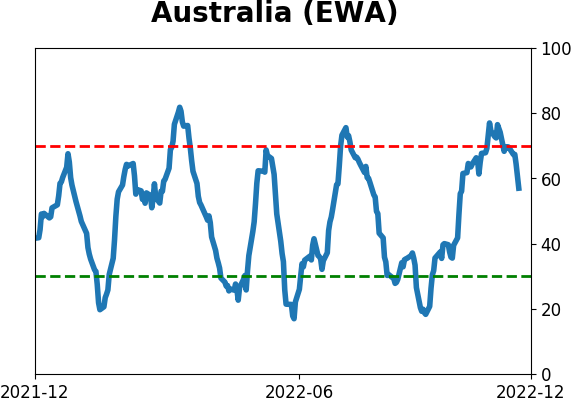
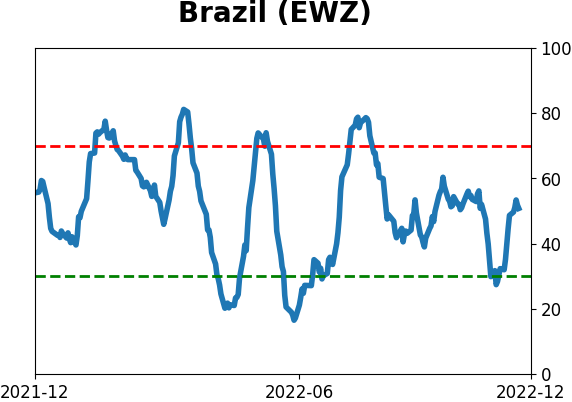
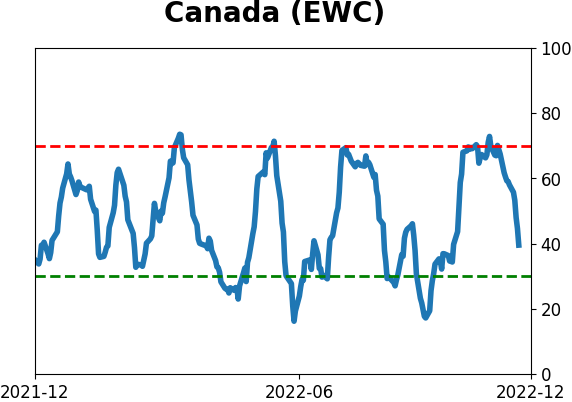
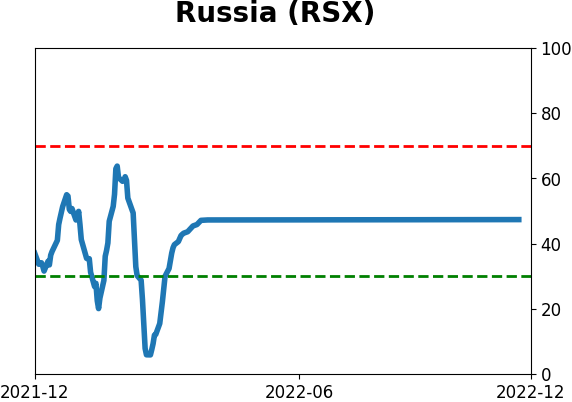
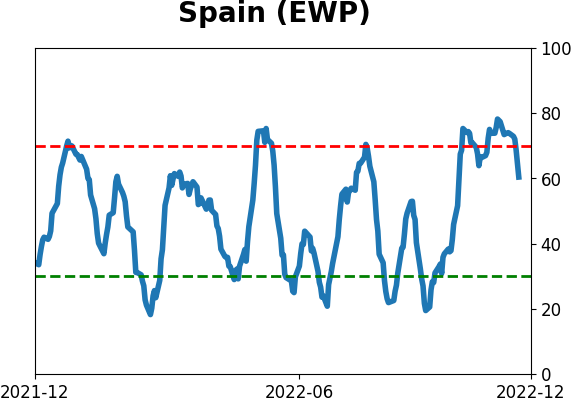
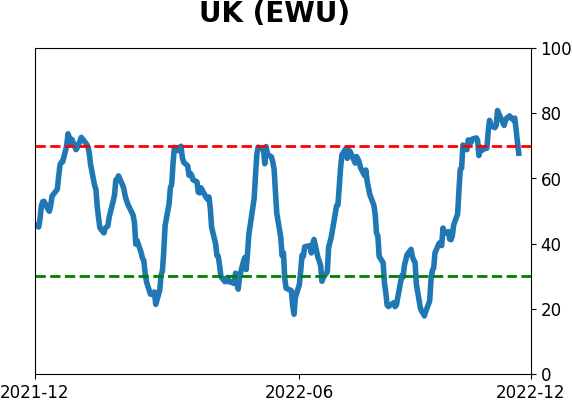
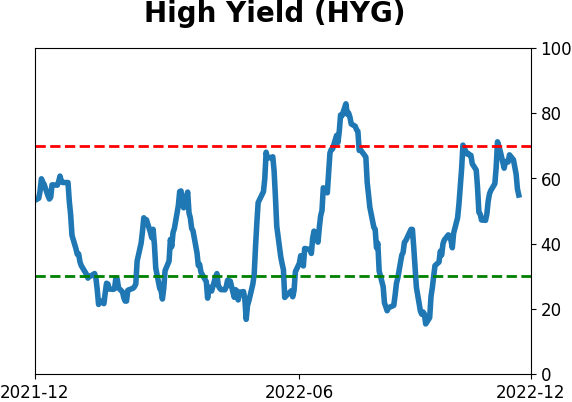
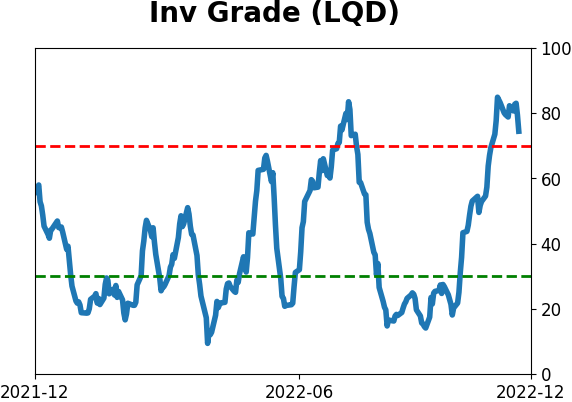
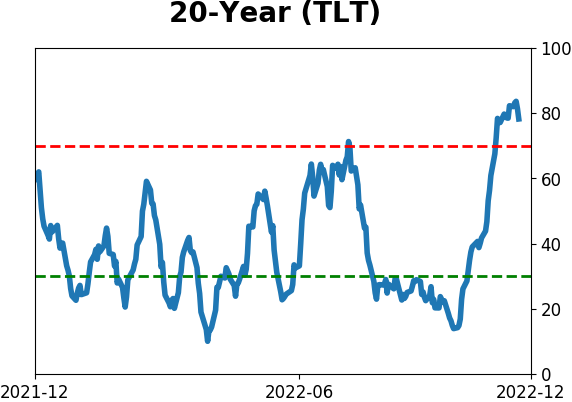
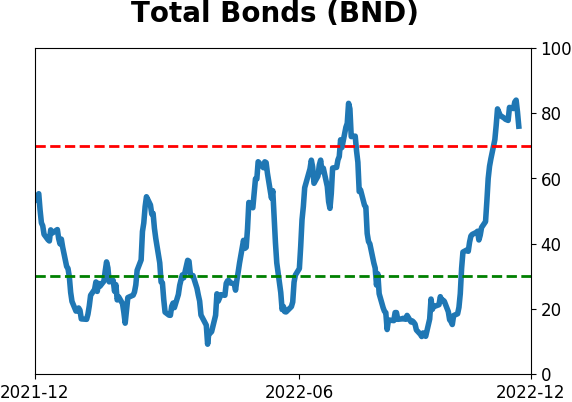
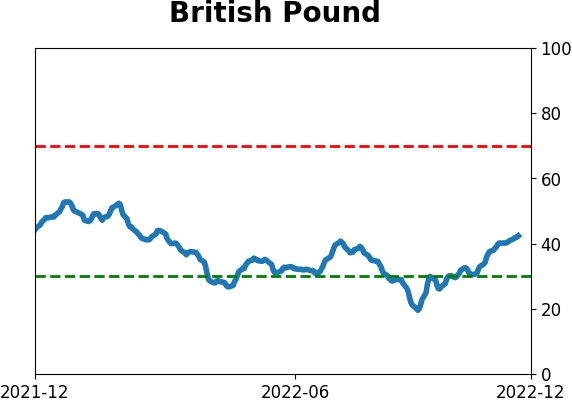
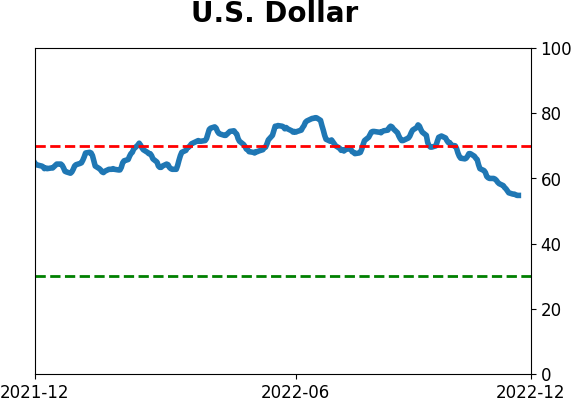
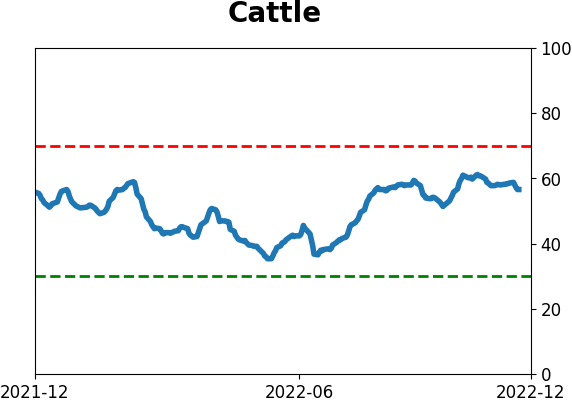
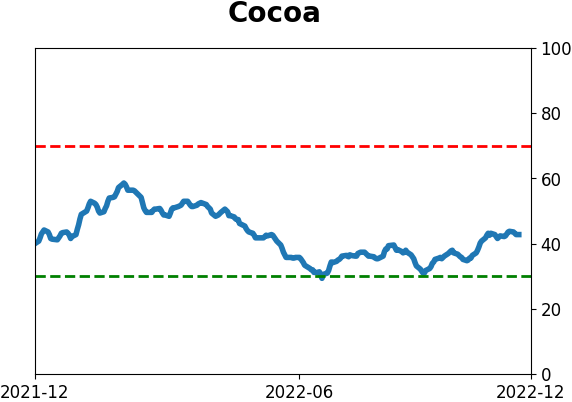
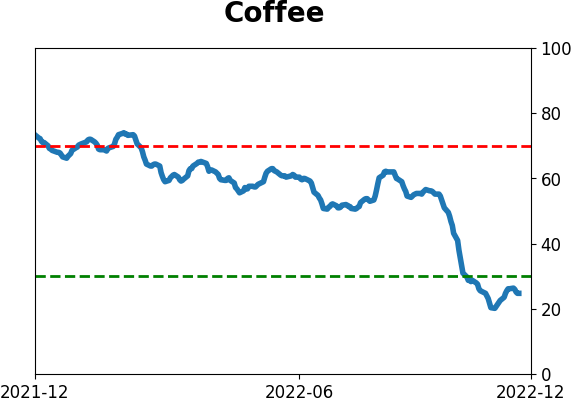
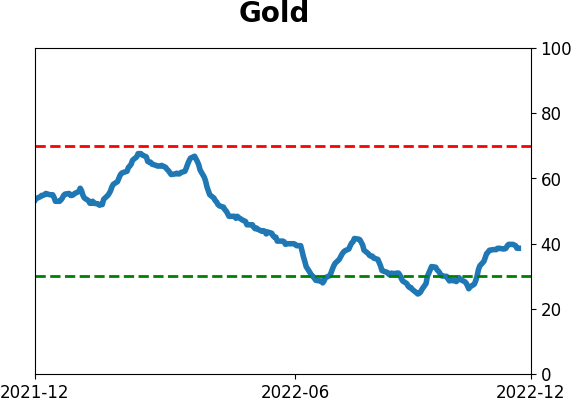
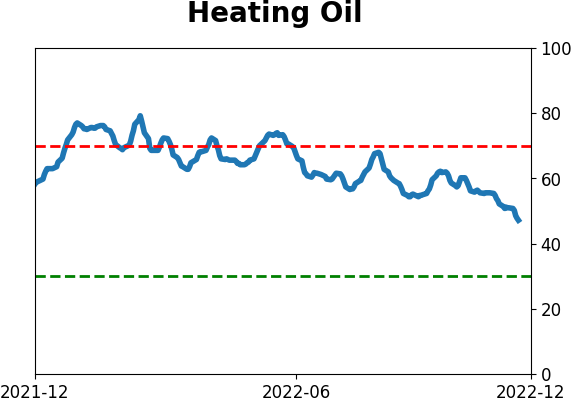
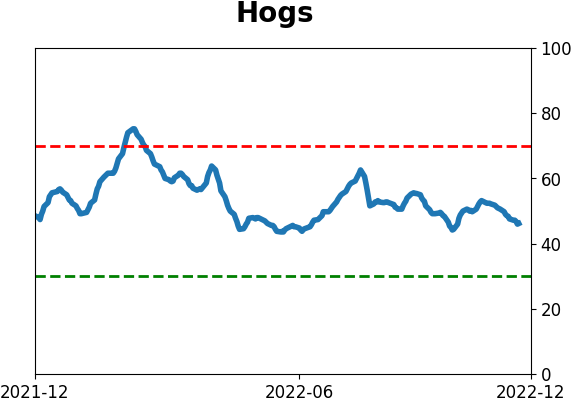
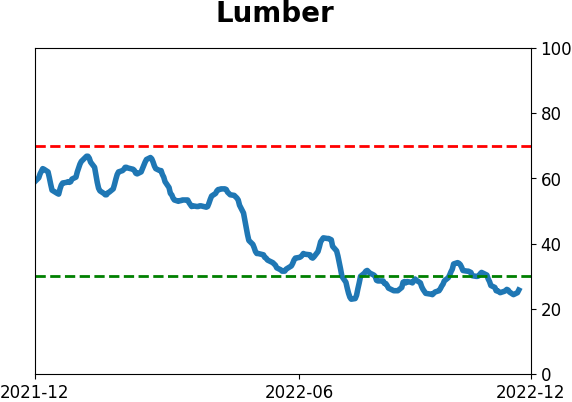
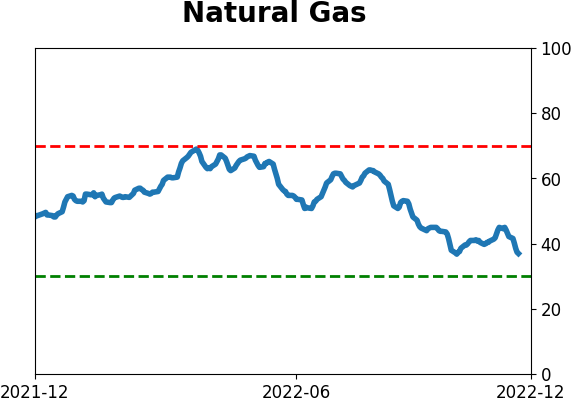
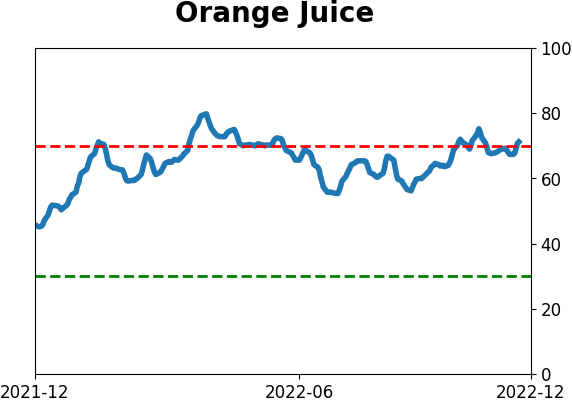
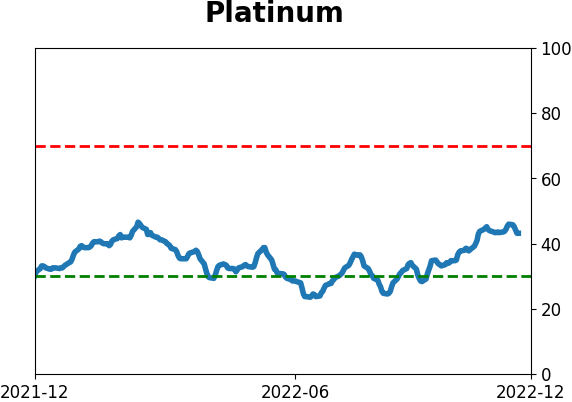
Optimism Index Thumbnails
|
|
|
|
|
|
|
|
|
|
|
|
|
|
|
|
|
|
|
|
|